
Abstract
Background:
Cost-effective and noninvasive methods for in vivo imaging of amyloid deposition are needed to screen Alzheimer’s disease (AD). Although retinal amyloid is a possible diagnostic marker of AD, there are very few studies on in vivo retinal amyloid imaging.
Objective:
To examine the usefulness of in vivo imaging of retinal amyloid in AD patients.
Methods:
To examine amyloid deposition, 30 Japanese subjects (10 normal control (NC), 7 with mild cognitive impairment (MCI), and 13 with AD) underwent a complete ophthalmic examination, including fundus imaging by scanning laser ophthalmoscopy before and after oral curcumin intake.
Results:
Retinal amyloid deposition was greater in AD than in NC subjects (*p < 0.05) while MCI showed a slight but insignificant increase of retinal amyloid deposition relative to NC subjects. Retinal amyloid deposition was correlated with whole gray matter atrophy (r = 0.51, *p < 0.05) but not with the cognitive score of the Mini-Mental State Examination, nor with medial temporal lobe atrophy.
Conclusion:
The present noninvasive in vivo detection of retinal amyloid deposition is useful for screening AD patients.
INTRODUCTION
Alzheimer’s disease (AD), which is the most common form of dementia, accounts for more than 60%of dementia cases [1]. Although a definitive diagnosis of AD requires pathological findings such as amyloid plaques and neurofibrillary tangles in the cerebral cortex [2], these are typically available only after death. Positive amyloid positron emission tomography (PET) [3] or a decrease of amyloid-β42 content in cerebrospinal fluids (CSF) [4] indicates AD pathology in living patients, but these are too expensive or excessively invasive for routine use. Therefore, cost-effective and noninvasive methods for in vivo imaging of amyloid deposition are needed.
The retina, the innermost layer of the eye, is an extension of the brain. Given its accessibility and histological similarity to the brain, some pathological changes in the brain can be conveniently estimated via the retina [5]. Recent studies showed that amyloid deposition was observed not only in the cerebrum but also in the retina of AD patients, suggesting that retinal amyloid could serve as a diagnostic marker of AD [6]. However, studies employing in vivo retinal amyloid imaging are very limited, especially for non-Caucasian subjects. In the present study, therefore, we examined the usefulness of in vivo imaging of retinal amyloid in Japanese AD patients.
MATERIALS AND METHODS
Study participants
Participants were prospectively collected at Okayama University from January to December 2020, and divided into three groups: cognitively normal control (NC), mild cognitive impairment (MCI), and AD. The diagnosis of AD was based on the Japanese Alzheimer’s Disease Neuroimaging Initiative (J-ADNI) criteria [7]. The criteria for MCI were a mild decline in one or more cognitive domains (with a clinical dementia rating (CDR) [8] of 0.5), essentially preserved basic activities of daily living (ADL), and the absence of dementia, delirium or any other mental disorders. Participants with a preserved cognitive function (CDR of 0) were classified as NC subjects.
This study, which was approved by the Okayama University Certified Review Board (approval #CRB19-003), was registered in the Japan Registry of Clinical Trials (jRCT) (registration number jRCTs061190024). All participants, or their substitutes, provided written informed consent.
Cognitive, affective, and ADL functions
Participants were evaluated with the Mini-Mental State Examination (MMSE) [9] and Hasegawa Dementia Scale-revised (HDS-R) [10] for cognitive function, the Geriatric Depression Scale (GDS) [11], apathy scale (AS) [12] and Abe’s behavioral and psychological symptoms of dementia (BPSD) score (ABS) [13] for affective function, as well as the AD cooperative study-activities of daily living [14] for ADL. All analyses were performed within three months prior to baseline retinal amyloid imaging.
Retinal amyloid imaging
Subjects initially underwent a complete ophthalmic examination, including fundus imaging after mydriasis by using the autofluorescence mode of a scanning laser ophthalmoscope (SLO; SPECTRALIS, Heidelberg Engineering, Heidelberg, Germany) as the baseline. According to previous studies [6, 15], the supero-lateral retinal quadrant was captured so that the optic disc (OD) was located on the lower and medial edge (768×768 pixels, Fig. 1A), as these are supposed to be the most vulnerable to retinal amyloid deposition. After baseline imaging, each subject orally ingested 4 g of Longvida optimized curcumin (Verdure Sciences, Noblesville, IN, USA), which contains 1 g of curcumin, for two consecutive days. Two to four hours after the second intake of curcumin, each subject was assessed once again by fundus imaging in the same manner as described above. To correct the unevenness of background intensity and speckle noise (Fig. 1A), acquired images were uniformly processed with OpenCV software (Intel Corp., Santa Clara, CA, USA) using background subtraction, filtering and histogram matching techniques (Fig. 1B, C).
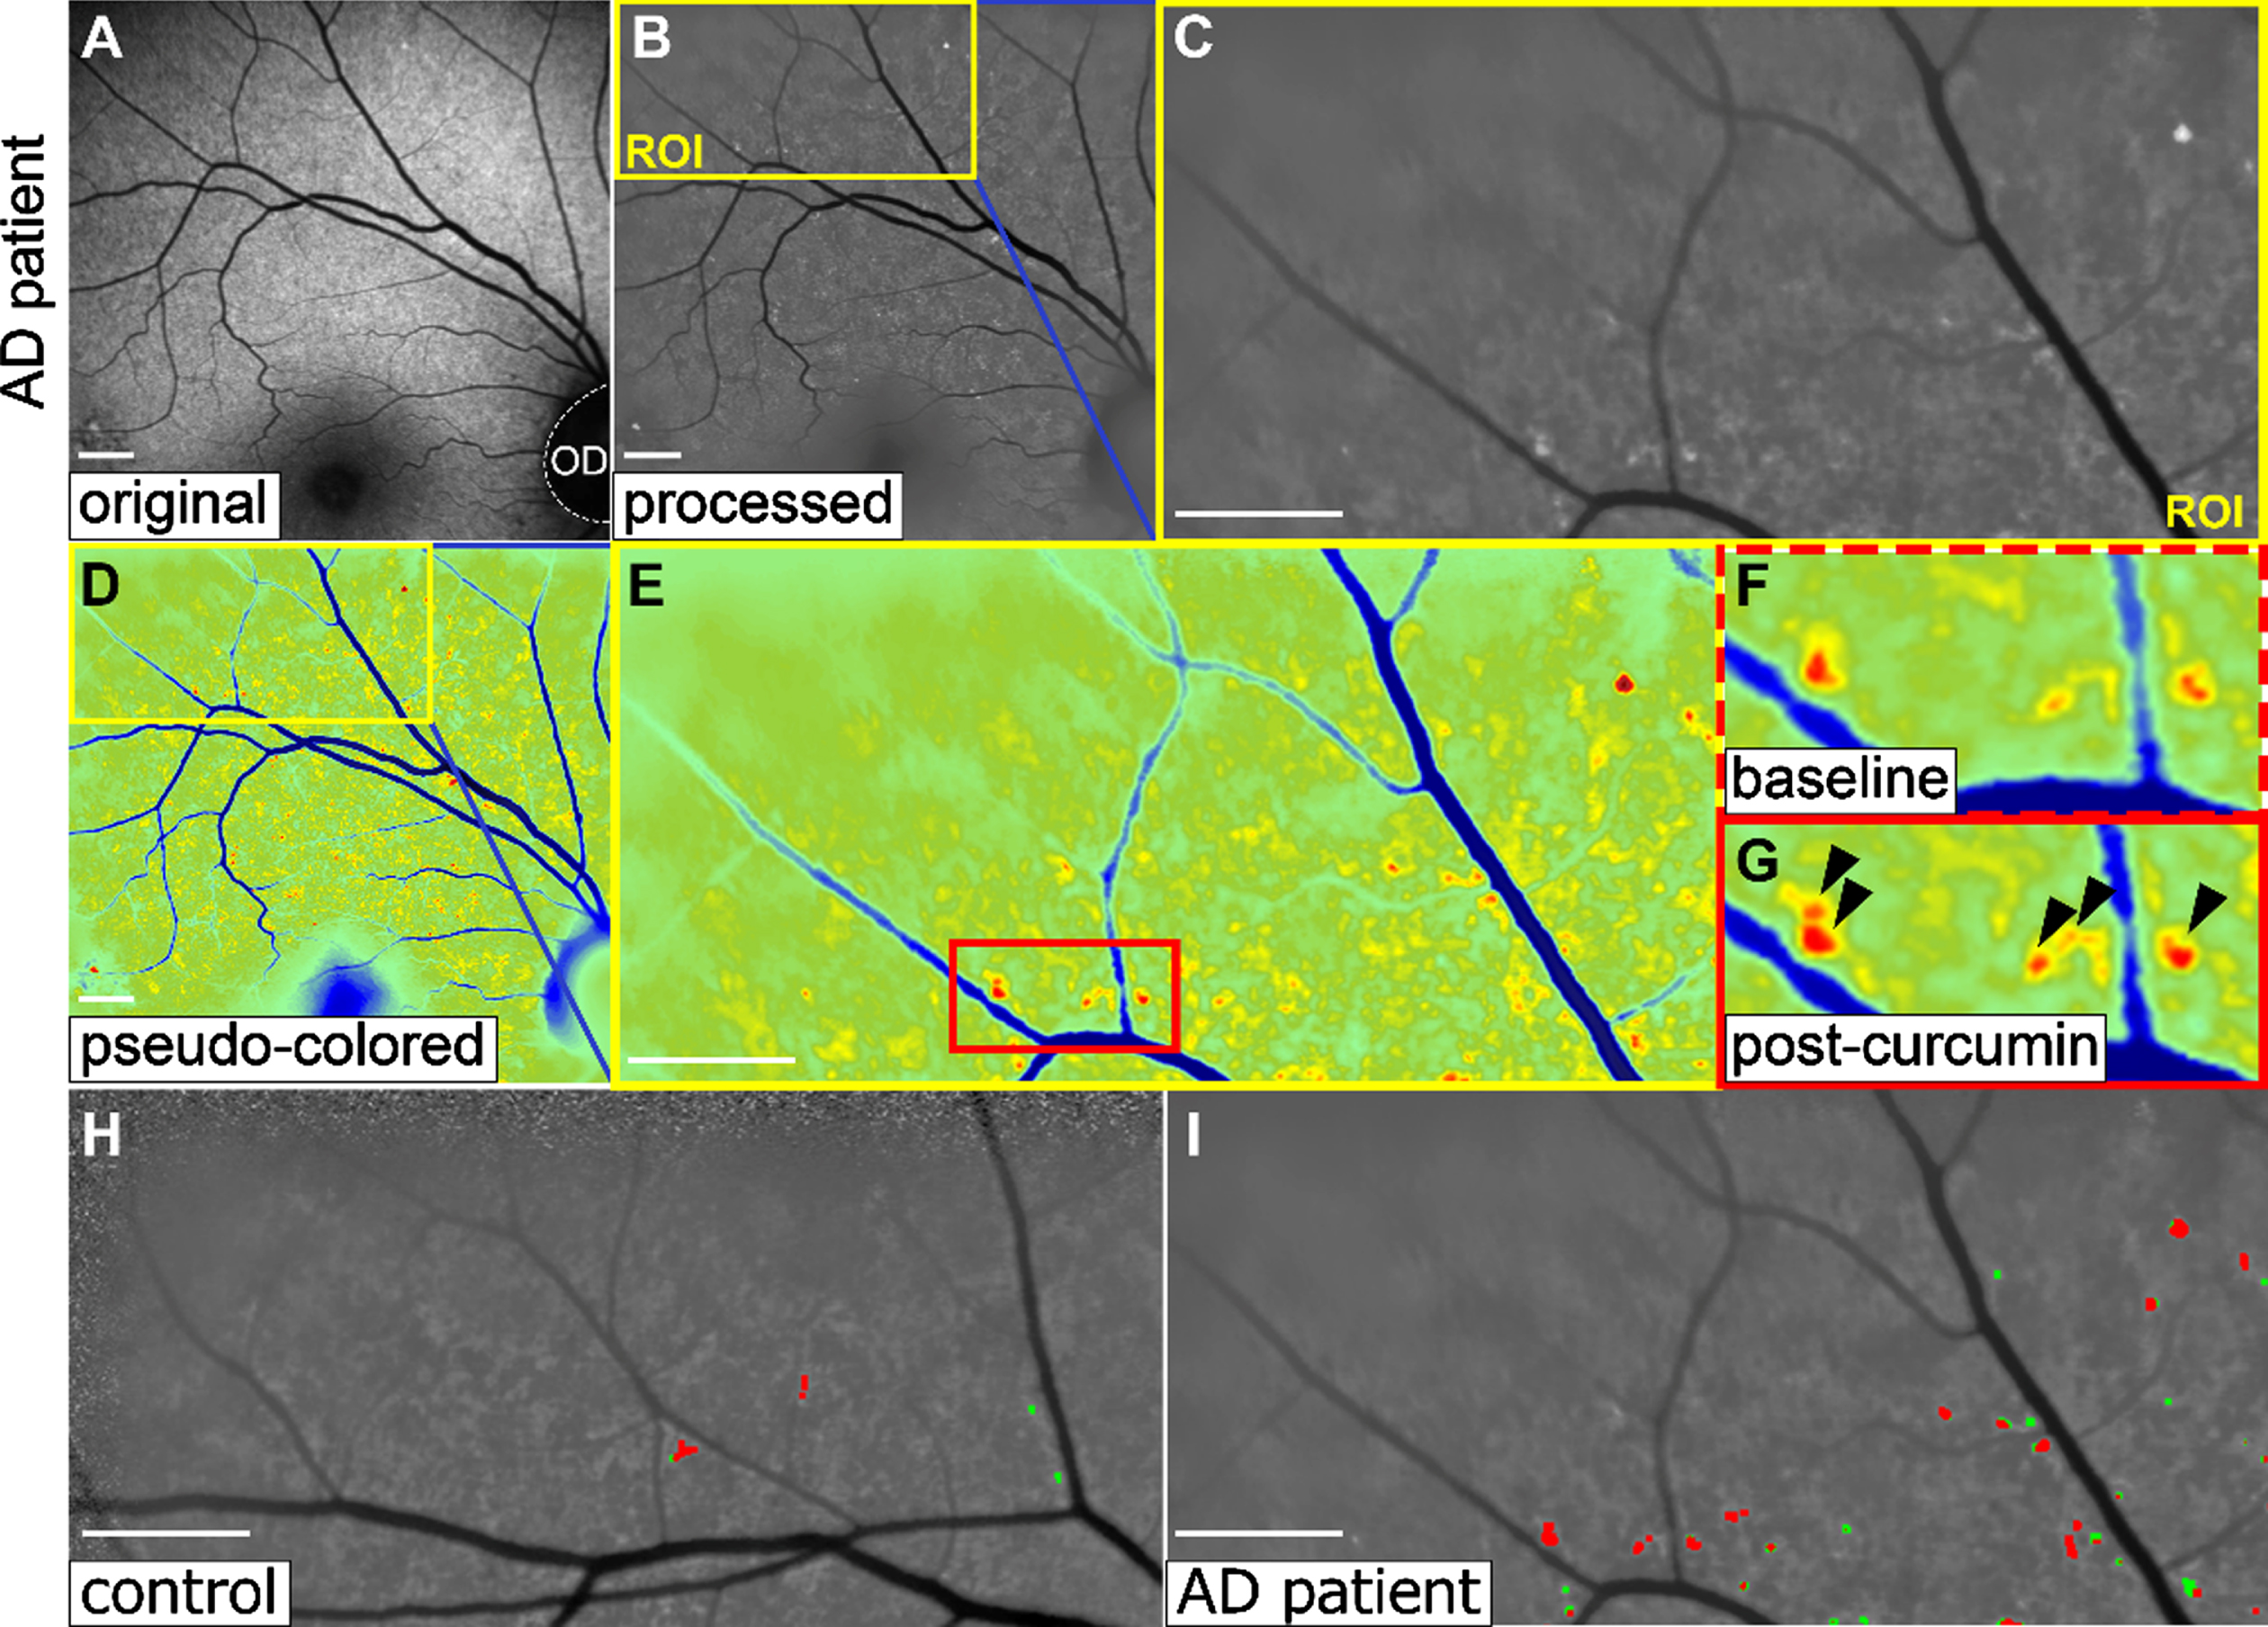
Representative retinal images of the amyloid PET-positive AD patient. A) The original image, which was processed uniformly (B). The upper lateral portion of that image was selected for quantitative analyses (C). D-G) Pseudo-colored images. Note the stronger signals of retinal amyloid spots in the post-curcumin image (G, arrowheads) than in the baseline (F). H-I) Automatically detected retinal amyloid spots (red spots), while some spots that were not enhanced after curcumin intake were excluded as noise (green). Note the larger number of spots in the AD patient (I) than in the control (H). Scale bars: 1 mm.
Quantitative analysis of retinal amyloid spots
Quantitative analysis of retinal amyloid spots was automatically and uniformly performed using the following four-step methodology. First, high-intensity spots were detected in the processed post-curcumin images (Fig. 1D, E). Second, several spots were excluded as noise, as these were not enhanced by curcumin intake, as indicated by a decrease in pixel intensity after curcumin intake (Fig. 1H, I, green), or they were not detected at all in the baseline, and only spots with increased signal intensity after curcumin intake were considered as retinal amyloid (Fig. 1F, G, arrowheads). Third, spots in the upper and lateral portions of images (512×256 pixels, Fig. 1H, I, red) were calculated using the methodology described in previous reports [6, 15]. Finally, the average areas of spots in both right and left eyes were used for quantitative analysis.
Conventional brain imaging data
Conventional brain imaging data, including magnetic resonance imaging (MRI) and Pittsburgh compound-B (PiB) amyloid PET [3], which were previously approved for a clinical examination or study (approval #OKU-1709-004), were retrospectively collected from the medical records of subjects. Brain atrophy in the medial temporal lobe (MTL) and whole gray matter (WGM) were evaluated by voxel-based regional analysis system for Alzheimer’s disease (VSRAD) software (Eisai Co., Ltd., Tokyo, Japan) [16] based on their MRI data. The positivity of PiB amyloid PET was judged by trained radiologists.
Statistical analysis
Continuous demographic and clinical data are presented as the mean±SD in the text and table. Comparisons of age, cognitive and affective function, ADL, retinal amyloid, and conventional imaging were carried out with Welch’s t-test. A gender comparison was performed with Pearson’s chi-squared test. Spearman’s correlation coefficient (r) was used to assess the correlation between measurements. All statistical analyses were performed with SPSS 22.0.0.0 (IBM Corp., Armonk, NY, USA). Statistical significance was assumed at p < 0.05. Receiver-operator characteristics (ROC) curves were computed with the scikit-learn module [17], and areas under the curve (AUC) values, which were calculated from the ROC curve, served as an indicator of diagnostic value.
RESULTS
A total of 37 Japanese subjects (12 NC, 8 MCI, and 17 AD) were enrolled in the present study. After examination, seven subjects were excluded because of poor image quality (n = 3) or the coexistence of an eye disease that affected the analysis, namely age-related macular degeneration and chorioretinal atrophy (n = 4). Finally, 30 subjects (10 NC, 7 MCI, and 13 AD) were analyzed.
The characteristics of study subjects are summarized in Table 1. Although age and gender were not significantly different among the three groups, cognitive analysis revealed a significant decline of MMSE and HDS-R scores in AD subjects compared with NC and MCI subjects (*p < 0.05). ADL score was also significantly lower in AD subjects (*p < 0.05). The affective scores of GDS, AS, and ABS were not significantly different among the three groups. Among the six NC, four MCI, and 13 AD subjects whose MRI data with VSRAD analysis were available, the z-score and percentage of MTL atrophy were significantly larger in AD subjects (*p < 0.05). The percentage of WGM atrophy was also significantly larger in AD subjects (*p < 0.05) while the difference in selectivity of MLT atrophy was not significantly different among the three groups. All three AD patients who underwent a PiB amyloid PET study were amyloid-positive (Fig. 2B).
Characteristics of study subjects
ABS, Abe’s behavioral and psychological symptoms of dementia (BPSD) score; AD, Alzheimer’s disease; ADL, activity of daily living; AS, apathy scale; GDS, geriatric depression scale; HDS-R, Hasegawa dementia scale-revised; MCI, mild cognitive impairment; MMSE, mini-mental state examination; MRI, magnetic resonance imaging; MLT, medial temporal lobe; NC, normal control; PET, positron emission tomography; PiB, Pittsburgh compound-B; VSRAD, voxel-based specific regional analysis system for Alzheimer’s disease; WGM, whole gray matter. *p < 0.05.
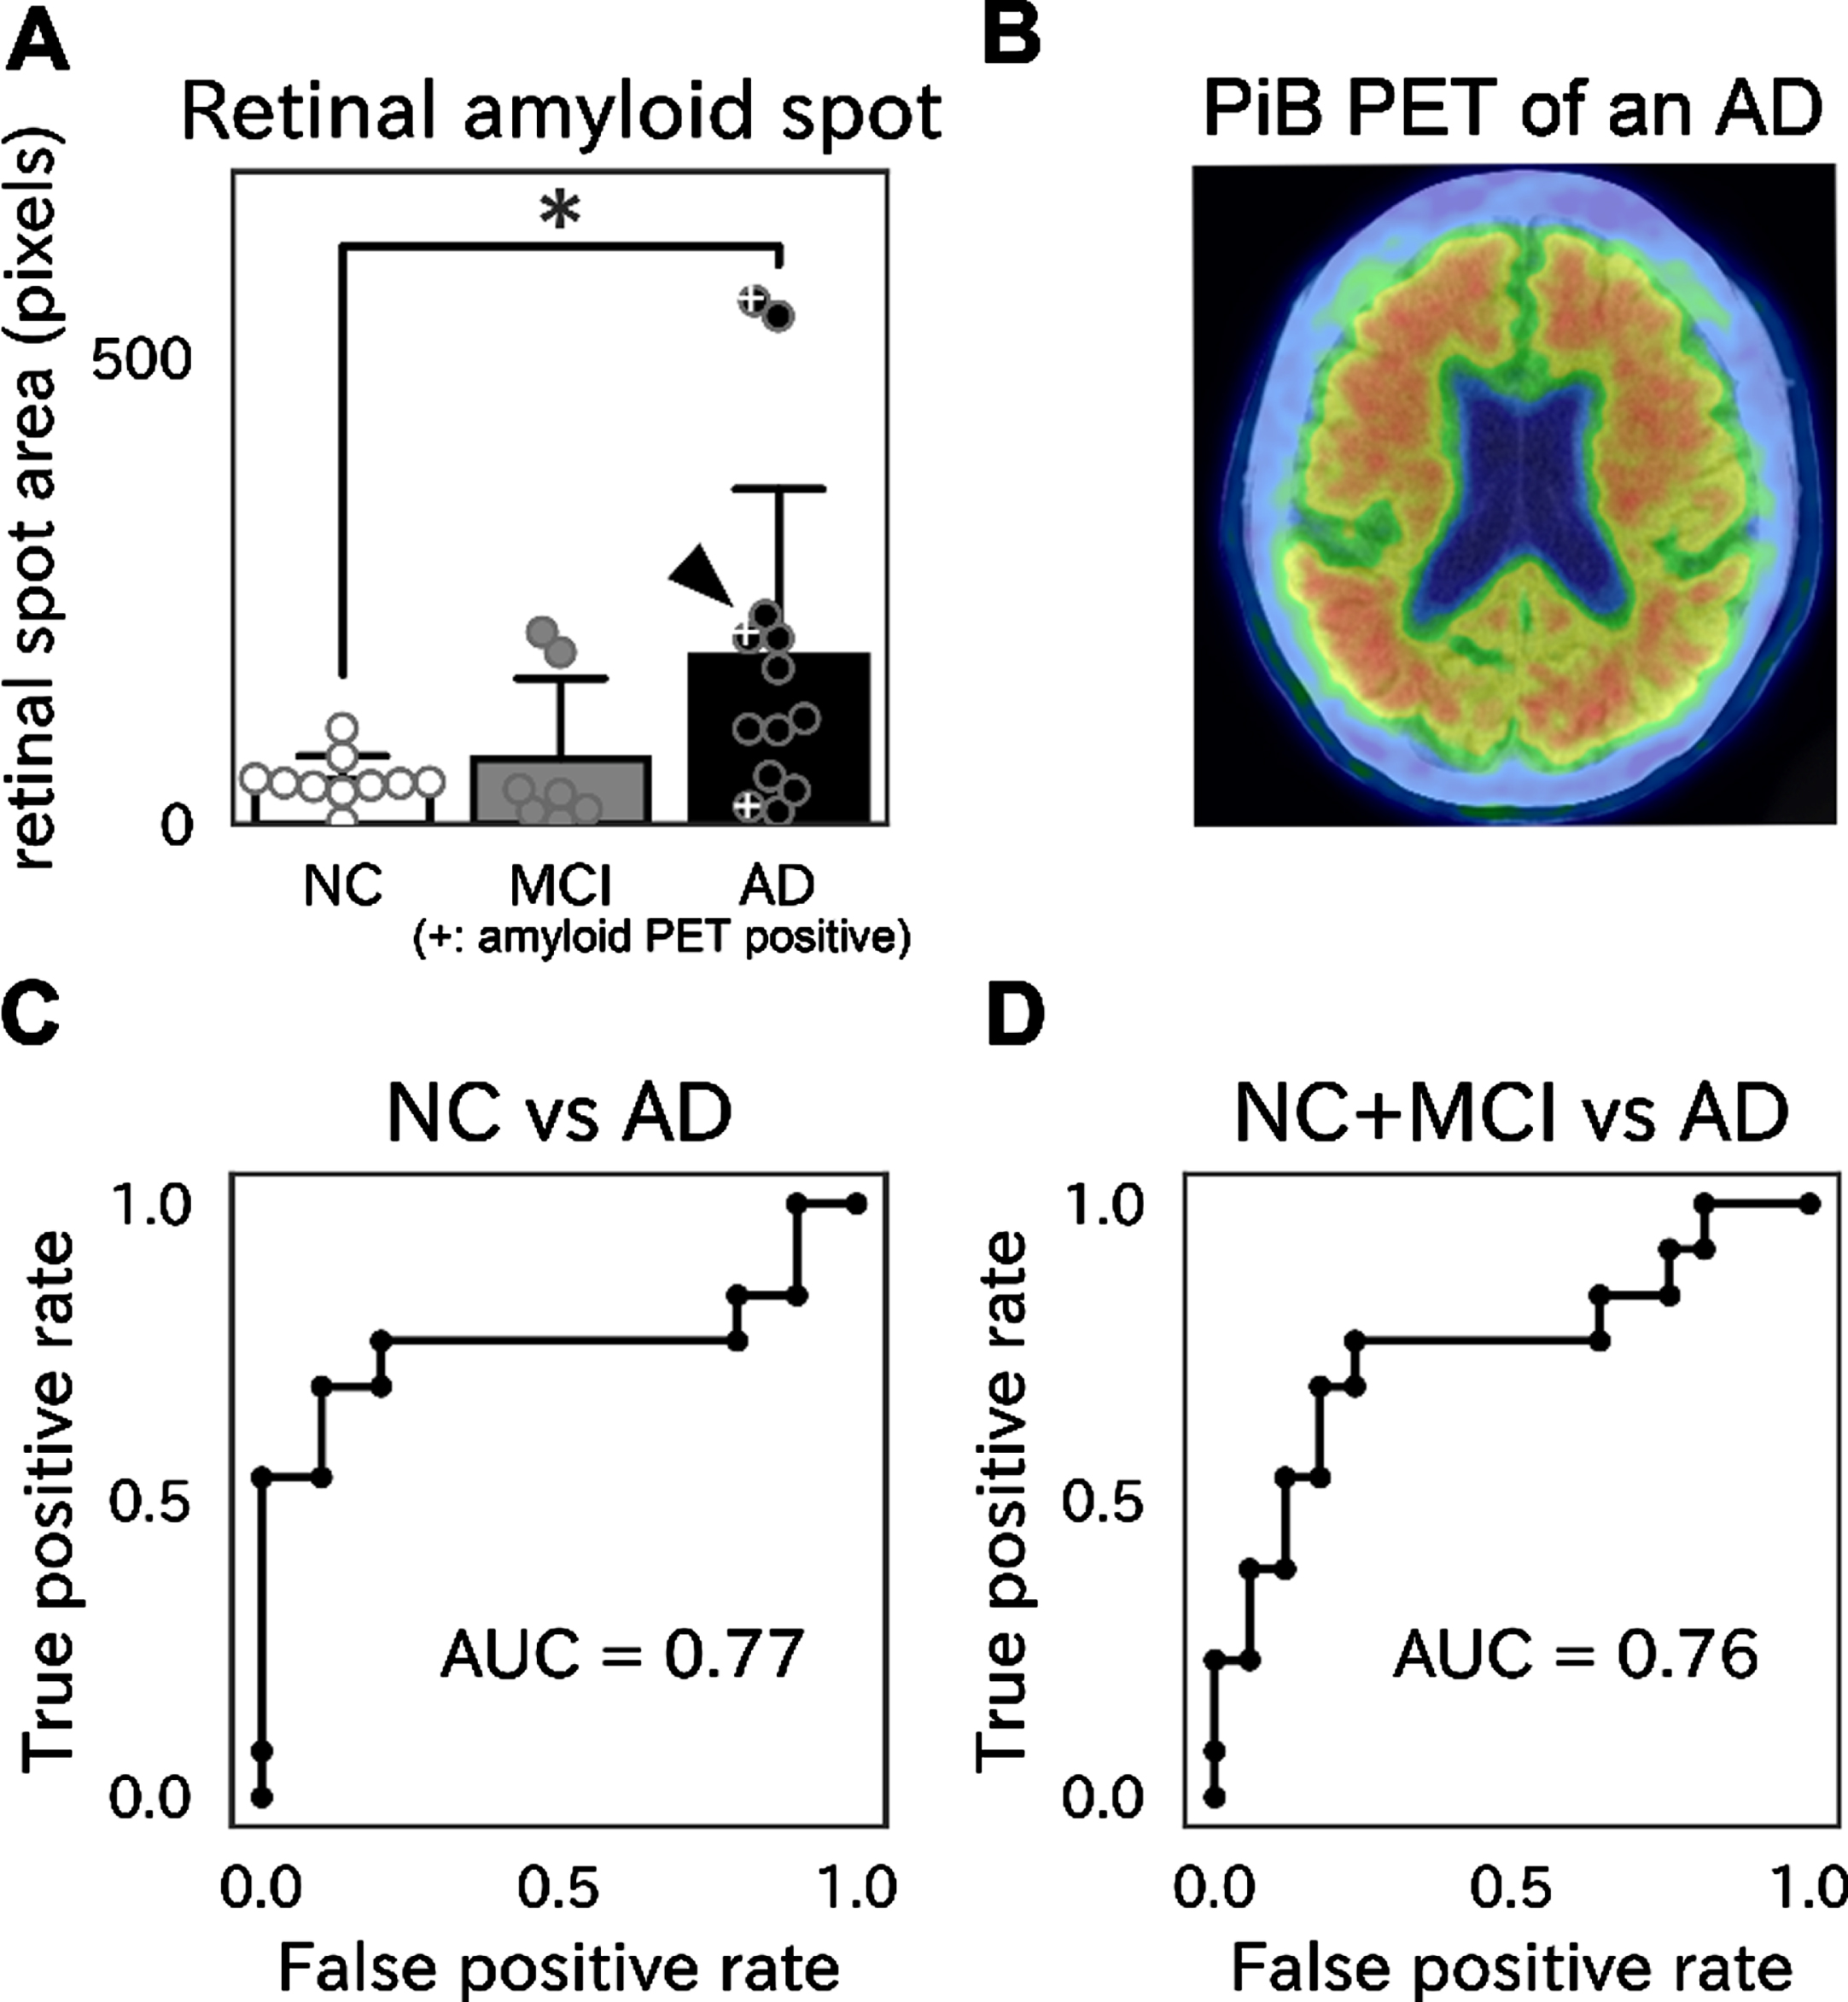
A) Areas of retinal amyloid spots. Note the significantly larger spot area in AD than in NC subjects (*p < 0.05). B) An example of positive PiB amyloid PET from an AD patient (A, an arrowhead). C, D) ROC curves, showing an AUC value of 0.77 for discriminating AD from NC subjects (C), and a value of 0.76 for discriminating AD from NC and MCI subjects (D).
Retinal amyloid spots were detected, especially along or close to (< 500μm) blood vessel walls (perivascular area) (Fig. 1H, I). Although a small number of spots was detected in control subjects, areas of retinal amyloid spots were significantly larger in AD subjects (*p < 0.05, Fig. 2A). Among the three amyloid PET-positive AD subjects (Fig. 2B), two showed the largest or a moderate area of retinal amyloid spots, while the third subject showed faint retinal amyloid deposition (Fig. 2A, marked with “+”). ROC analysis revealed that the AUC values were 0.77 for discriminating AD from NC subjects (Fig. 2C), and 0.76 for discriminating AD from NC and MCI subjects (Fig. 2D). Although the quantity of retinal amyloid spots was not related to the MMSE score or MTL atrophy (Fig. 3, left and middle), it was significantly correlated with WGM atrophy (r = 0.51, *p < 0.05). Among the three amyloid PET-positive AD subjects, of note were those subjects with greater WGM atrophy, as they showed a larger area of retinal amyloid spots (Fig. 3, right).
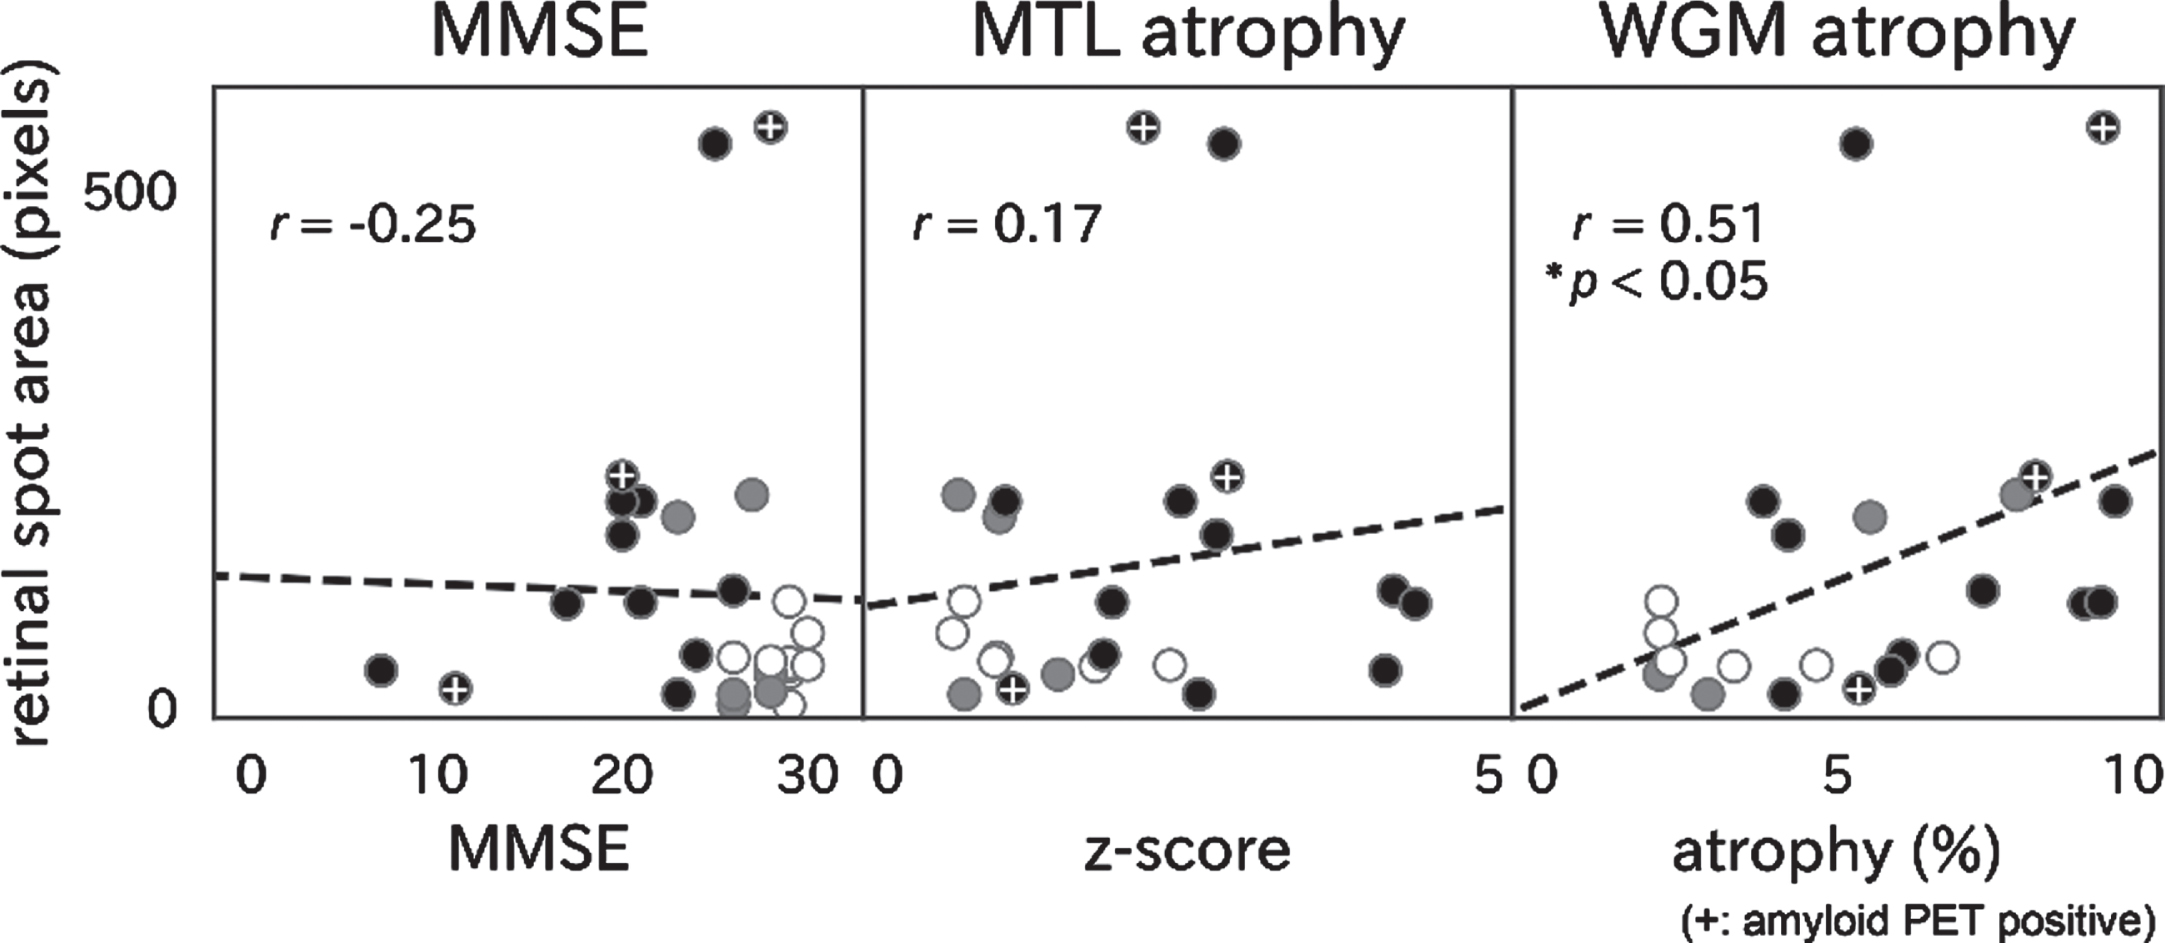
Correlations between retinal amyloid spots and MMSE score (left), medial temporal lobe (MTL) atrophy (center), and whole gray matter (WGM) atrophy (right). Only WGM atrophy was significantly correlated with retinal amyloid spots (r = 0.51, *p < 0.05). White, gray, and black points represent NC, MCI, and AD subjects, respectively.
DISCUSSION
In the present study, amyloid deposition was successfully detected in the retinas of AD subjects by SLO following the oral intake of curcumin (Fig. 1). Retinal amyloid deposition was greater in AD than NC subjects (Fig. 2) but was not correlated with the MMSE cognitive score or MTL atrophy, but rather with WGM atrophy (Fig. 3).
Retinal amyloid deposition has been pathologically proved, both in AD model mice [18, 19] and postmortem human AD patients [20, 21], and was strongly correlated with cerebral amyloid deposition [22, 23]. Furthermore, retinal amyloid was associated with neurodegeneration and inflammation [18], and hyperphosphorylated tau was also detected in the retinas of AD patients [24], suggesting that pathological changes of the retina were similar to those of the cerebrum in AD patients. Thus, retinal amyloid can serve as a surrogate marker of cerebral amyloid deposition. Curcumin is a natural polyphenolic compound that emits strong fluorescence [25] and selectively binds to amyloid-β. Thus, retinal fluorescent spots enhanced by curcumin were regarded as retinal amyloid spots (Fig. 1F-I) [6]. Curcumin potentially inhibits the formation of amyloid-β oligomers and fibrils [26], and destabilizes preformed fibrils [27], resulting in cellular and synaptic toxicity [28], even though two days’ intake of oral curcumin is not likely to wash out retinal amyloid deposits [26]. This method of detecting retinal amyloid with curcumin is less invasive and more cost-effective than amyloid PET or CSF and is thus more advantageous. In addition, curcumin can label both amyloid fibrils and oligomers, while a PET probe of PiB binds mainly to amyloid fibrils [29, 30]. Therefore, the present retinal amyloid imaging method may have the advantage of detecting the accumulation of neurotoxic oligomers.
In this study, we demonstrated an increase in retinal amyloid deposition in Japanese AD patients for the first time (Fig. 2A), unlike previous studies that mostly targeted Caucasian patients [6, 15], suggesting that retinal amyloid imaging may be useful for several ethnic groups. The perivascular localization of retinal amyloid spots (Fig. 1) was consistent with previous pathological and in vivo imaging studies [6], possibly reflecting a disrupted blood-retinal barrier [31] or impaired periarterial amyloid drainage [32, 33] in AD subjects. Compared to control subjects, retinal venules were more tortuous and arteriolar diameter was greater in subjects with cerebral amyloid deposition, suggesting retinal vascular modification in AD [34].
Retinal amyloid deposition was not correlated with MMSE score in our study (Fig. 3, left). This finding was consistent with previous studies [6, 15]. Cerebral amyloid plaques begin to deposit more than 10 years before the onset of dementia [35], so retinal amyloid deposition might also start prior to cognitive decline. On the other hand, retinal amyloid deposition was significantly correlated with WGM atrophy, which starts before the onset of dementia [36]. A stronger correlation of retinal amyloid deposition with WGM atrophy than with MTL atrophy (Fig. 3, middle and right) suggests a relationship between retinal amyloid deposition and atrophy in the occipital, temporal and parietal cortex, which are collectively involved in visual processing [37, 38].
We also noted that some AD patients, including one PET-positive patient, showed faint retinal amyloid deposition (Figs. 2 3). This might be due to limited detectability of the present retinal amyloid imaging method or a difference in amyloid deposition between the retina and cerebrum. Another possible explanation for retinal amyloid-negative AD patients in the absence of amyloid PET data is that they might not be characterized as having non-AD type dementia such as argyrophilic grain disease or senile dementia of the neurofibrillary tangle type [39]. Thus, an additional PET study may be necessary for clinically diagnosed AD patients with negative retinal amyloid deposition.
The present study has some limitations. The number of participants (10 NC, 7 MCI, and 13 AD subjects), especially those who had undergone amyloid PET analysis, was limited. Moreover, because AD-related biomarkers such as amyloid PET, CSF amyloid or tau were not examined, the present MCI subjects might include MCI due to diseases other than dementia-related diseases. Therefore, further studies with a greater number of pathologically-confirmed MCI and AD subjects will be required to confirm the effectiveness of retinal amyloid imaging.
In conclusion, the present noninvasive in vivo detection of retinal amyloid deposition is useful for screening AD patients.
Footnotes
ACKNOWLEDGMENTS
We are grateful to A. Fujiwara and K. Kanenaga for their technical assistance. This work was partly supported by a Grant-in-Aid for Scientific Research (B) 17H0419611, (C) 15K0931607, 17H0975609, and 17K1082709, and by Grants-in-Aid from the Research Committees (Kaji R, Toba K, and Tsuji S) from the Japan Agency for Medical Research and Development (7211800049, 7211800130, and 7211700121).