
Abstract
Background:
Mild cognitive impairment (MCI) is a transitional condition between normal cognition and dementia. [18F]FDG-PET reveals brain hypometabolism patterns reflecting neuronal/synaptic dysfunction, already in the prodromal MCI phase. Activated microglia is part of the pathogenetic processes leading to neurodegeneration.
Objective:
Using [11C]-(R)-PK11195 and [18F]FDG-PET, we aimed to in vivo investigate the presence of microglial activation, and the relationship with brain glucose metabolism, in single MCI subjects.
Methods:
Eight MCI subjects underwent both [18F]FDG-PET and [11C]-(R)-PK11195 PET. We used validated quantification methods to obtain brain hypometabolism maps and microglia activation peaks in single subjects. We investigated both the spatial overlap and the relationship between brain glucose hypometabolism and microglia activation, by means of Dice similarity coefficient and using Pearson’s correlation at single subject level.
Results:
Each MCI showed a specific brain hypometabolism pattern indicative of different possible etiologies, as expected in MCI population (i.e., Alzheimer’s disease-like, frontotemporal dementia-like, hippocampal-type, normal aging type). [11C]-(R)-PK11195 PET analysis revealed a spatial concordance with regional hypometabolism in all subjects with several clusters of significant microglia activation showing an inverse correlation with the regional metabolism. This was proportional to the strength of between-signals correlation coefficient (β = –0.804; p = 0.016).
Conclusion:
Microglia activation is present in the prodromal MCI phase of different underlying etiologies, showing spatial concordance and inverse correlation with brain glucose metabolism at single-subject level. These findings suggest a possible contribution of activated microglia to neurodegeneration, showing important implications for local immune activity in the early neurodegenerative processes.
Keywords
INTRODUCTION
Mild cognitive impairment (MCI) is an intermediate state between normal aging and dementia [1]. MCI represents a heterogeneous condition, including subjects with different underlying etiologies and variable outcomes [2]. MCI subjects may convert to Alzheimer’s disease (AD) dementia with an annual rate of 10–15% and, traditionally, the amnestic presentation of MCI (aMCI) is considered the prodromal stage of dementia due to AD [1, 3]. Other less fre-quent presentations, involving language, frontal or visuospatial functions at the onset can eventually lead to AD representing, respectively, the logopenic variant of AD, the frontal variant of AD, and posterior cortical atrophy [1]. Clinical heterogeneity may also reflect a variety of underlying neuropathological conditions other than AD, such as frontotemporal lobar degeneration, Lewy bodies disease, cortico-basal de-generation, and cerebrovascular disease [4–7]. Eventually, a non-negligible amount of MCI cases can show long-term clinical stability or reversion to normal cognition [8–10].
The pathological deposition of misfolded proteins has been recognized as the main culprit in the neu-rodegenerative cascade leading to dementia. Abnormal accumulation of proteins including amyloid-β, tau-protein, and α-synuclein is linked to synaptic dysfunction and neuronal loss, hallmark events which can be detected early in the neurodegenerative process [11]. Along with protein accumulation, neuroin-flammation is now considered a key element in the development of neurodegenerative conditions [12, 13]. Microglia are the resident macrophages in the central nervous system and, together with astrocytes, are the main players of neuroinflammatory responses in both health and disease [14, 15]. The activity of these cells is tightly modulated in order to maintain homeostatic balance and provide neuroprotective functions, such as protein aggregates and cellular de-bris clearance, synapses remodeling, and neurotro-phic factors production [16]. However, a chronic or prolonged immune activation may induce deleterious effects contributing to neuronal damage [17].
Currently, no effective treatment is available to stop progression to neurodegenerative dementia, thus the early identification of structural and molecular changes characterizing MCI condition may offer a potential therapeutic window to test disease modifying therapeutic strategies [18, 19]. Positron emission tomography (PET) imaging represents a unique tool to detect, in vivo, early functional neuronal abnor-malities, pathological protein deposition, and neuro-inflammatory responses [20].
18F-2-fluoro-2-deoxyglucose ([18F]FDG)-PET is considered a proxy of synaptic dysfunction, able to identify early neuronal metabolic changes [21, 22]. In MCI populations, [18F]FDG-PET imaging has shown to be useful in supporting clinical diagnosis and in predicting the prognosis [22–27]. The use of standardized and validated semi-quantitative methods for imaging analysis allows to predict, at the single-sub-ject level, early in the disease course, and with high accuracy, whose subjects will develop AD or other dementia and those who will remain stable over time [24–26].
PET imaging of neuroinflammation is largely fo-cused on visualizing microglia activation. Neuroinflammatory responses can be detected in vivo using PET tracers for the 18 kDa-translocator protein (TSPO), a mitochondrial protein which is overexpressed by activated microglia and astrocytes [28]. [11C]-(R)-PK11195 represents the prototypical and most widely used TSPO PET tracer [29, 30]. It has been employed to detect neuroinflammation in several neurodegenerative conditions, showing to be associated, in vivo, with both clinical deterioration and brain hypometabolism, implying its contribution to neuronal damage [31–37]. In addition, a variable degree of microglia activation has been revealed in the prodromal but even also in preclinical and asymptomatic phases of neurodegenerative diseases, suggesting an early role for neuroinflammation in the cascade of events leading to neurodegeneration [32, 38–42].
The role of neuroinflammation in neuronal dysfunction and neurodegeneration has not been fully elucidated. Variable results across studies emerged, mainly due to different quantification methods of the TSPO signal [43, 44]. In addition, it is still unclear whether the early microglia activation detected by TSPO-PET represents an initial protective response rather than a deleterious process, or whether it represents a leading actor in the neurodegenerative cascade or a consequence of other pathological processes [15, 46].
This is the first study evaluating in vivo both brain metabolism and microglia activation in single MCI individuals, using validated single-subject procedures. We aimed to explore the pattern of neuronal dysfunction and neuroinflammation and their spatial overlap in each subject, evaluating the correlation between the amount of neuroinflammation and brain hypometabolism in the main affected areas, in the hypothesis of a detrimental effect of microglia activation on neuronal functioning.
MATERIALS AND METHODS
Participants
We enrolled eight subjects fulfilling the Petersen criteria for MCI (mean age±standard deviation (SD) = 63.87±8.49; female/male: 3/5), showing obj-ective cognitive impairments with preserved independence in functional abilities and in the absence of dementia [47]. All participants were clinically assessed by experienced cognitive neurologists and underwent standard neuropsychological evaluation. MCI subjects had a Mini-Mental State Examination (MMSE) >24/30 (mean MMSE score±SD = 27.12±1.12). Demographics and cognitive characteristics of subjects are detailed in Table 1. All MCI participants underwent both [18F]FDG and [11C]-(R)-PK11195 PET. [11C]-(R)-PK11195 PET scans of ten healthy volunteers (mean age±SD = 44.2±10.5 years; female/male: 6/4) were available from an in-house database [32, 48].
Demographics, clinical, and cognitive characteristics of the MCI sample
F, female; M, male; MCI, mild cognitive impairment; md-MCI, multiple domain mild cognitive impairment; sd-MCI, single domain mild cognitive impairment; MMSE, Mini-Mental State Examination.
The study was approved by the local ethic committee and it was performed in accordance with the Declaration of Helsinki. Informed consent was obt-ained from all participants.
PET imaging acquisition
FDG-PET scans were performed at the Nuc-lear Medicine Unit, San Raffaele Hospital, Milan, Italy and at the Nuclear Medicine, Spedali Civili Brescia, Brescia, Italy, using identical acquisition and reconstruction protocols. In detail, the [18F]FDG-PET studies were acquired with a Discovery STE (GE Medical System, Milwaukee, WI) multi-ring PET tomography (PET-CT) system. Subjects were fasted for at least 6 h before radiopharmaceutical in-jection (185–250 Mbq via a venous cannula). Subje-ct’s blood glucose level was up to 120 mg/dl. Scans were acquired in resting state and with a time interval between injection and scan start of 45 min (15 min scan duration). The reconstruction of images was performed using an ordered subset expectation maximization (OSEM) algorithm. Attenuation correction was based on a low-dose CT scan contextually acq-uired. Scatter correction was performed with the specific software integrated in the scanner.
All [11C]-(R)-PK11195 PET scans were perfor-med at the Nuclear Medicine Unit, San Raffaele Hospital, Milan, Italy, within six months from the execution of the [18F]FDG-PET. PET scanning was performed on a multi-ring 3D PET scan, either PET-CT “Discovery LS” or “Discovery 690” general ele-ctric medical system (GEMS), using the same linear reconstruction algorithm and ensuring perfect com-patibility between the two acquisitions. [11C]-(R)-PK11195 synthesis was performed as previously described in the Cyclotron Unit of the Nuclear Med-icine of the San Raffaele Hospital (optimal radio-chemical purity > 95%) [49]. Mean [11C]-(R)-PK11195 injected dose was 339±46 MBq for MCI subjects and 375±64 MBq for healthy controls. The acquisition protocol included a dynamic scan of 15 frames lasting 58 min (i.e., 6×30 s / 2×1 min / 1×3 min / 3×5 min / 2× 10 min / 1×15 min). PET data were corrected for attenuation, radioactive decay, and scatter. For each scan, the realignment over time of individual frames was performed using the Statist-ical Parametric Mapping (SPM) 12 software (http://www.fil.ion.ucl.ac.uk/spm/software) to minimize ef-fects of subject movement.
Imaging processing and data analysis
[18F]FDG-PET
Data analysis was performed using the SPM12 software, according to optimized and validated procedures implementing a standardized dementia-specific SPM [18F]FDG-PET template for spatial normalization [50]. Images were smoothed with 8 mm full width at half maximum (FWHM) Gaussian kernel and global-intensity scaled to remove inter-subject uptake variability. Each scan was tested for relative hypometabolism by means of a two-sample t-test in comparison with a large normal [18F]FDG-PET image database (N = 112) on a voxel-by-voxel basis, including age as covariate [51]. Statistical threshold for the resulting SPM t-maps was set at p = 0.05, considering significant clusters containing more than 100 voxels. SPM t-maps were, then, binarized for the subsequent analysis.
[11C]-(R)-PK11195-PET
[11C]-(R)-PK11195 binding potentials (BPs) were estimated adopting a receptor parametric mapping (RPM) procedure [52], a basis function implementation of the simplified reference tissue modeling (SRTM) method [53]. [11C]-(R)-PK11195 images were analyzed using the curve distance clustering algorithm (CDCA) [54], an adaptation of the validated SuperVised Clustering Algorithm [55]. The CDCA algorithm estimates the similarity of the time activity curves (TACs) of each voxel with four predefined TACs (tracer delivery in blood, white matter, grey matter with non-specific binding, and grey matter with high specific binding). This method allows to identify a cluster of voxels where the tracer kinetic is devoid of specific uptake, a pseudo-reference region which can be used for the subsequent parametric analysis [54]. The [11C]-(R)-PK11195 BPs maps obtained with the CDCA procedure were spatially normalized to the standard Montreal Neurological Institute (MNI) space, using a previously described PET template [48].
TSPO is likely to be overexpressed differently in the regions of the brain due to physiological and biological differences [30]. Previous studies that have evaluated the [11C]-(R)-PK11195 BPs in healthy controls showed a TSPO overexpression in the subcortical structures, such as thalamus, midbrain, pons, and brainstem, with midbrain and thalamus showing significant increases with age [56, 57]. Thus, non-specific binding due to TSPO overexpression was removed by subtracting mean [11C]-(R)-PK11195 BPs of healthy controls to each MCI [11C]-(R)-PK11195 BPs map.
Correlation analyses
Cortical and subcortical regions of interest (ROIs) were defined by the WFU PickAtlas toolbox [58] using the automated anatomical labeling (AAL) atlas [59]. PickAtlas tool was created in MATLAB (Mathworks Inc., Sherborn, Mass., USA) for accessing the atlas volumes, selecting regions, and generating masks [58]. The selected regions were: frontal lobe, occipital lobe, parietal lobe, temporal lobe, insula, hi-ppocampus, parahippocampal region, amygdala, caudate, putamen, pallidum, and thalamus.
[11C]-(R)-PK11195 BPs and cerebral glucose metabolism signals were extracted from each ROI, by using the toolkit REX, implemented in MATLAB (https://www.nitrc.org/projects/rex/). Clusters of increased [11C]-(R)-PK11195 BPs are scattered and so a ROI-based approach will include both voxels with raised and normal [11C]-(R)-PK11195 signal. In order to avoid dilution by partial volume effects from surrounding normal voxels, we extracted signals only from [11C]-(R)-PK11195 BPs peaks. For consistency, we also extracted [18F]FDG-PET regional metabolic rate only from regions found to be hypometabolic in the SPM t-map.
The extracted signal was then used for correlation analysis, in which correlation between regional brain metabolism and microglia activation was investigated using Pearson’s correlation at subject level.
Dice similarity coefficient
Between-maps concordance was assessed using each single-subject FDG-SPM t-map and the spatially corresponding [11C]-(R)-PK11195 BPs map by means of Dice similarity coefficient.
Dice measuring spatial overlap between two binarized maps (A and B) is defined as:
Where A ∩ B represented the number of elements common to the two masks, and A + B represented the sum of all elements present both in A and B. Dice takes the value of 1 if A and B assume the same logical value in every voxel (high concordance), and a value of 0 if they always disagree (null concordance). Basically, Dice coefficient represents the amount of spatial overlap between brain local hypometabolism and TSPO overexpression. Dice was calculated for the whole brain and crucially for each ROI (see Table 2).
The Dice similarity coefficient for brain regions showing significant [18F]FDG PET brain hypometabolism and/or [11C]-(R)-PK11195 PET uptake. Brain regions are ordered according to the increasing degree of similarity (Dice) between [18F]FDG PET brain hypometabolism and [11C]-(R)-PK11195 PET binding potential
Linear regression analysis
Finally, we calculated a linear regression analysis in MCI subjects, considering Dice similarity coefficients, as independent variables, and the betw-een-signals Pearson’s correlation coefficients as the dependent variable. This statistical design was ado-pted to test whether the strength of the inverse correlation between microglia and metabolism was due to the spatial overlap between the two signals.
Statistical analysis was performed using IBM SPSS 22 (Statistical Package for Social Sciences software, IBM, Armonk, NY, USA).
RESULTS
Demographics, clinical, and cognitive characteristics of each MCI subject are summarized in Table 1.
[18F]FDG-PET SPM analysis revealed different hypometabolism patterns at the single subject level, as expected in MCI population due to different underlying etiologies. The most frequent hypometabolic pattern involved temporo-parietal cortices, suggesting underlying AD pathology (MCI01, MCI02, MCI03, MCI04). There were, in addition, other [18F] FDG-PET patterns indicative of frontotemporal dem-entia (MCI08), cortico-basal degeneration (MCI07), or medial-temporal lobe dysfunction (MCI05). [11C]-(R)-PK11195 PET single-subject analysis showed major clusters of significant [11C]-(R)-PK11195 BPs increases (microglia activation) in temporal, parietal, occipital, and frontal regions with a strong correspondence to the hypometabolism topography (Fig. 1 and case presentations). [11C]-(R)-PK11195 BPs and brain glucose metabolism showed an inverse trend, indicating that higher microglia activation was associated with lower brain metabolic rate (Fig. 2).

Patterns of [18F]FDG-PET brain hypometabolism and [11C]-(R)-PK11195 PET binding potentials in single individuals.
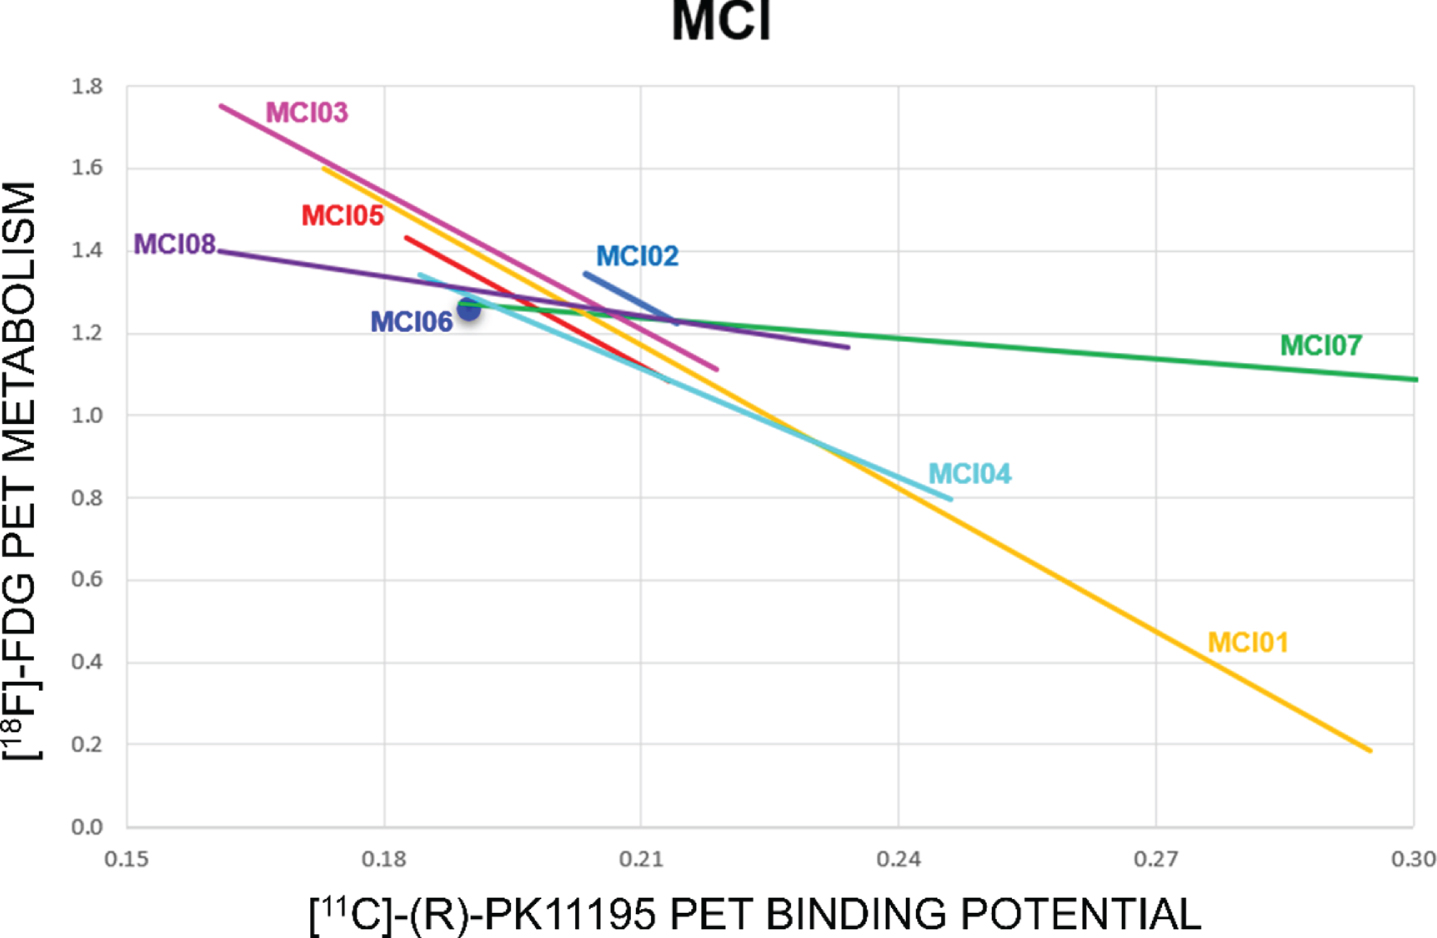
Correlation analysis between cerebral glucose metabolism and [11C]-(R)-PK11195 binding potentials (ROIs pooled together) in each subject. The colored lines show the linear fitting of each subject. Correlation analysis indicates a trend to an inverse correlation between the two measures (except for one subject), meaning that higher microglia activation is associated to a lower level of regional metabolism in the same regions.
A variable degree of spatial overlap between brain hypometabolism FDG SPM t-maps and increased [11C]-(R)-PK11195 BPs was evident in all MCI sub-jects, as measured by Dice similarity coefficient (whole brain 0.02 to 0.24, ROIs level 0 to 0.61) (see Table 2 and Fig. 3).
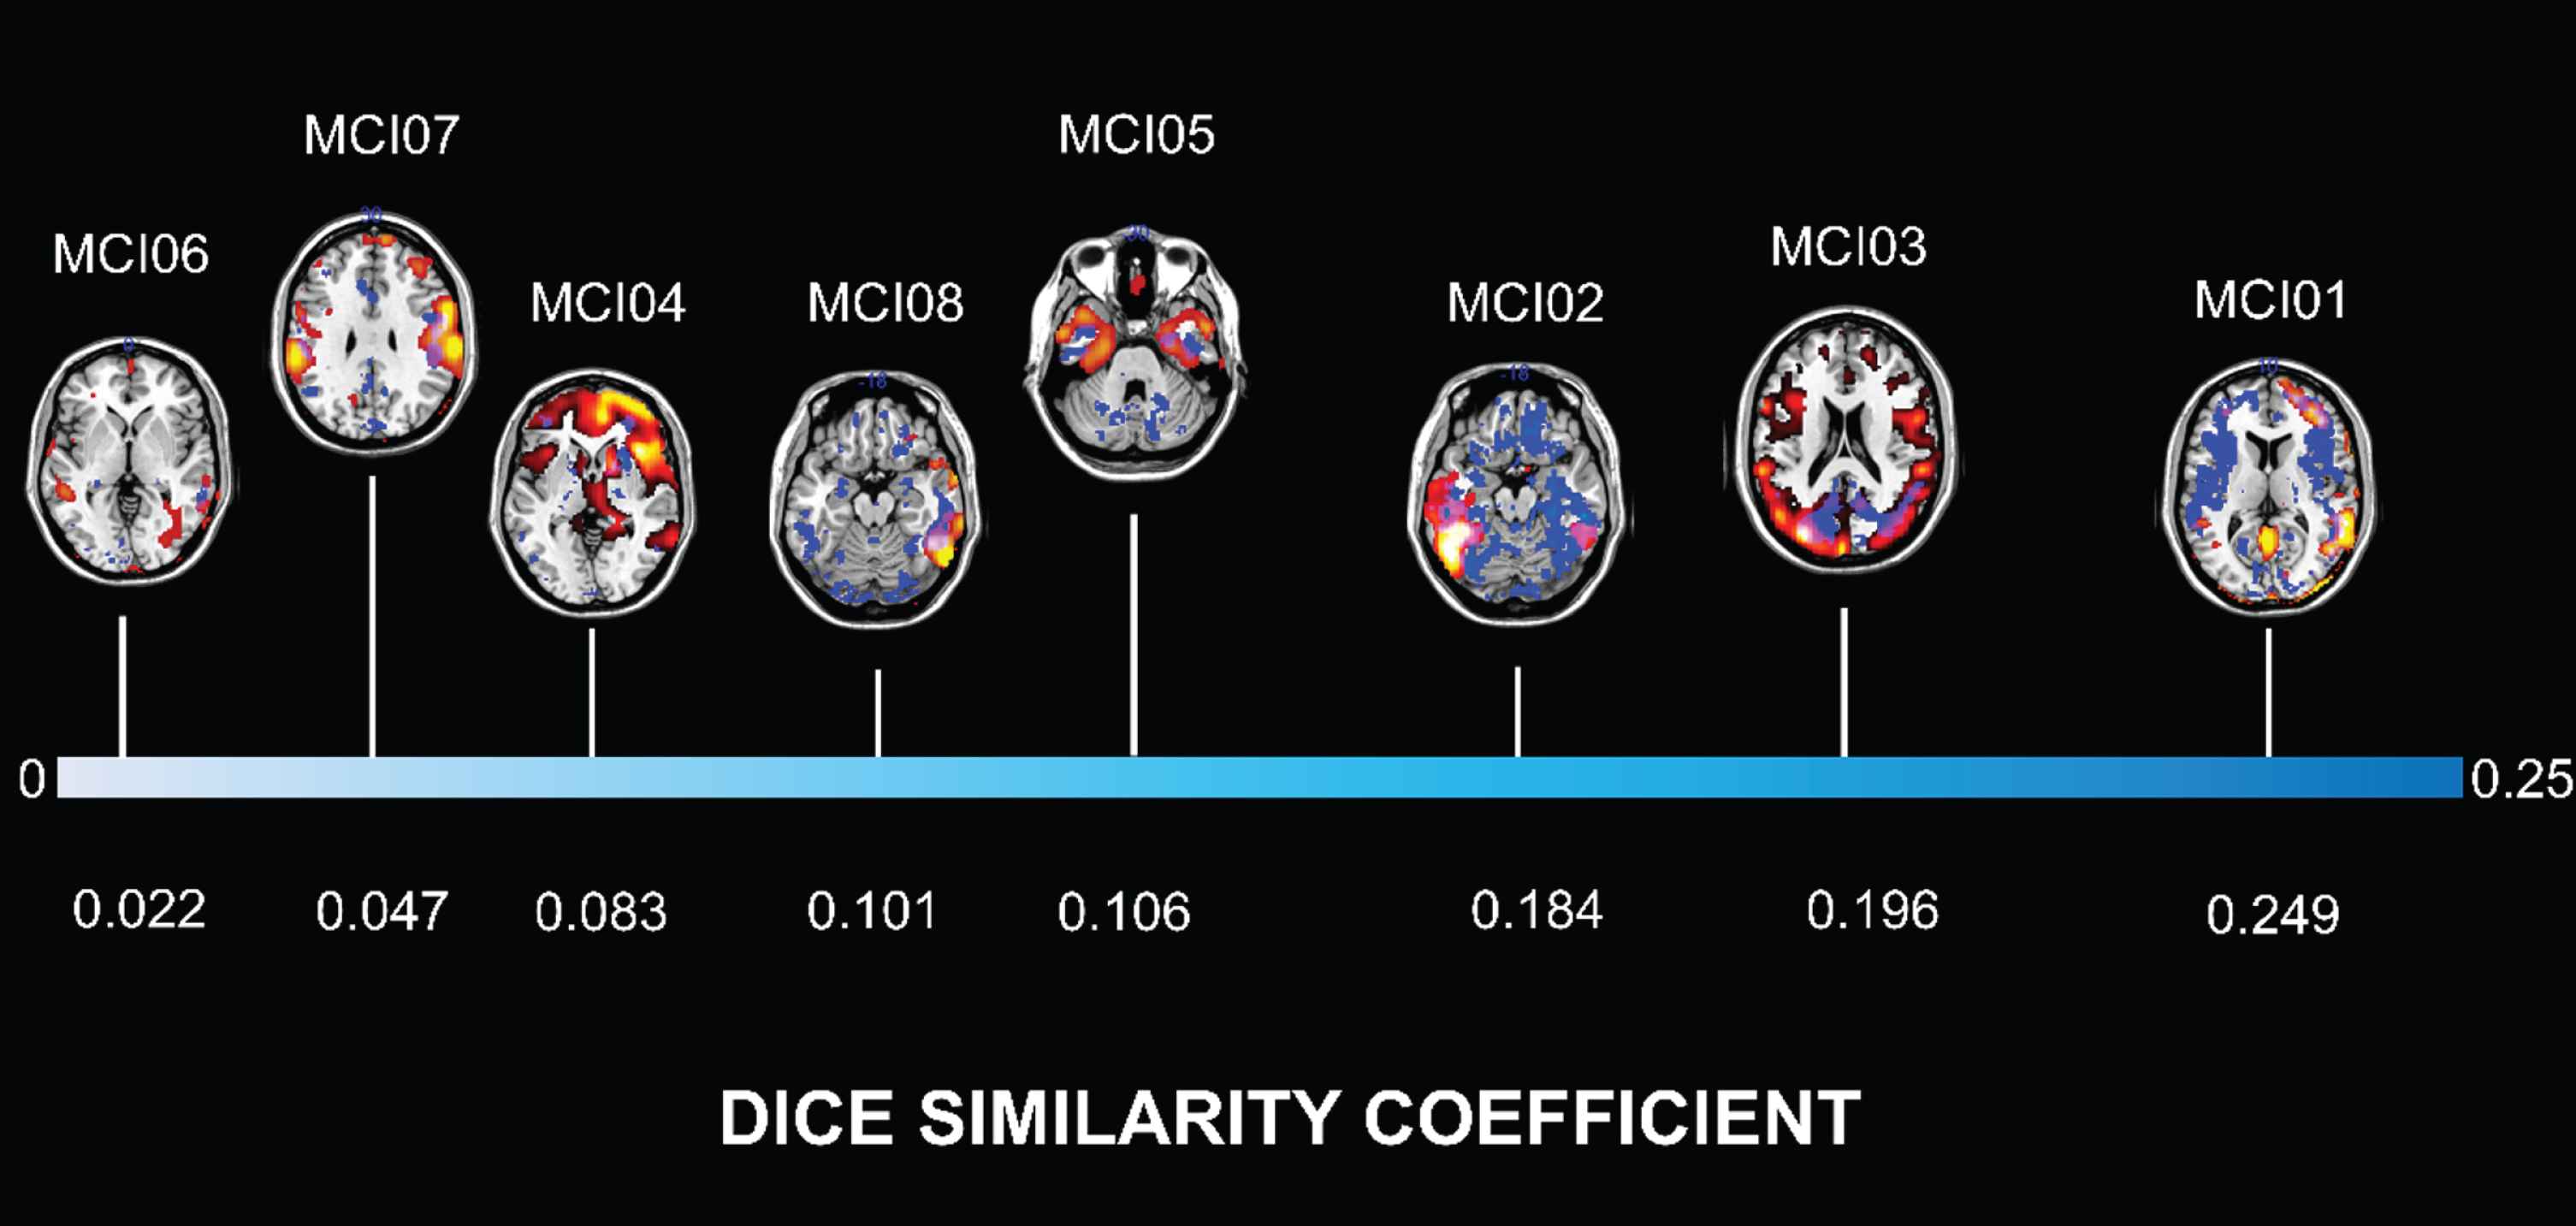
MCI subjects are ordered according to the degree of similarity between brain hypometabolism and increased TSPO expression, as measured by Dice similarity coefficient. Lower (white), medium (light blue) and high (blue) values of Dice indicate the increasing degree of overlap. Patterns of [18F]FDG-PET brain hypometabolism and [11C]-(R)-PK11195 PET binding potential in single individuals are depicted according to Fig. 1 (overlap areas are violet).
The linear regression analysis showed, at the group level, a significant inverse correlation between Pearson’s correlation coefficients and Dice coefficients (β=–0.804; p = 0.016), indicating that the spatial con-cordance was proportional to the strength of between-signals correlation (Fig. 4).

Linear regression analysis at group level, considering Dice similarity coefficients as independent variables and the Pearson’s correlation coefficients as the dependent variable, shows a significant negative correlation. Black line shows the linear fitting. Regression analysis indicates that higher spatial overlap predicts greater strength of inverse correlation between microglia activation and brain metabolism.
Case presentations
MCI01
A 56-year-old male received a diagnosis of amnestic MCI due to a selective memory deficit (MMSE: 25/30). FDG SPM t-map revealed hypometabolism in temporo-parietal cortex, in the precuneus and the posterior cingulate cortex, bilaterally, as in the typical AD-like hypometabolism pattern, suggesting an underlying AD pathology [22, 26]. Increased TSPO expression was widespread, involving mainly the temporo-parietal and the frontal cortex, but also the occipital and the posterior cingulate cortex. The spatial concordance, as measured by Dice coefficient (0.249), between microglia activation and brain glucose hypometabolism was high in temporo-parietal regions and in the posterior cingulate cortex. Specifically, the temporal lobe (0.487) and the parietal lobe (0.432) showed greater spatial overlap between hypometabolism and [11C]-(R)-PK11195 BPs compared to other ROIs.
MCI02
A 75-year-old man presented with difficulties in naming and mild memory problems with normal global cognitive status (MMSE: 27/30). FDG SPM t-map showed hypometabolism mainly involving the left superior, middle and inferior temporal gyri, and the inferior and superior parietal lobules on the left side, as a typical pattern of logopenic primary pro-gressive aphasia [60, 61]. [11C]-(R)-PK11195 PET revealed left-lateralized microglia activation in the temporal, parietal, and frontal regions. The global Dice similarity coefficient was 0.184. The temporal lobe (Dice = 0.548) and the parietal lobe (0.312) showed greater spatial overlap between hypomet-abolism and [11C]-(R)-PK11195 BPs compared to other ROIs.
MCI03
A 65-year-old man presented with impaired perfo-rmances in tests evaluating memory and visuospatial abilities (MMSE: 28/30). FDG SPM t-map showed hypometabolism involving temporo-parietal and occipital regions, as usually observed in posterior cortical atrophy [62, 63]. [11C]-(R)-PK11195 BPs were increased in occipital, temporal, and parietal regions bilaterally, with significant overlap with hypometabolism in the posterior cortical regions. The global Dice similarity coefficient was 0.196. The occipital lobe (0.519), the parietal lobe (0.247), and the temporal lobe (0.135) were the ROIs showing the highest spatial overlap.
MCI04
A 53-year-old man was diagnosed as MCI showing memory deficits, executive and behavioral disturba-nces, including apathy and irritability (MMSE: 27/30). CSF analysis revealed low amyloid and high p-tau and t-tau levels, suggesting a diagnosis of MCI due to AD [1]. FDG SPM t-map revealed diffuse hypometabolism involving the right frontal, the lat-eral temporal, and parietal cortices, but also the precu-neus and the posterior cingulate cortex. [11C]-(R)-PK11195 BPs map showed very limited microglia activation, involving frontal and temporal medial cor-tices, and subcortical regions. The global Dice similarity coefficient was 0.083. Spatial overlap between brain hypometabolism and microglia activation was mainly found in the bilateral parahippocampal re-gions (left: 0.165; right: 0.135).
MCI05
A 73-year-old female presented a pure amnestic syndrome without any other objective deficit (MMSE: 27/30). Structural imaging showed atrophy of the medial temporal lobe structures. FDG SPM t-map showed a selective hypometabolism involving the medial and anterior temporal lobes and the posterior cingulate cortex. This metabolism pattern has been associated with long-term clinical stability and several possible underlying etiologies, including primary age-related tauopathy, hippocampal sclerosis, argyrophilic brain disease, and the limbic-predominant age-related TDP-43 encephalopathy [27, 65]. [11C]-(R)-PK11195 BPs were increased in temporal medial structures, but also in right temporal lateral cortex and to a lesser degree, in the orbitofrontal re-gions. The global Dice similarity coefficient was 0.106. The right hippocampus (0.617) and the ri-ght parahippocampal region (0.521) showed greater spatial overlap between hypometabolism and [11C]-(R)-PK11195 BPs compared to other ROIs.
MCI06
A 62-year-old female received a diagnosis of amn-estic MCI due to memory deficit without impact on global cognitive status (MMSE: 29/30). [18F]FDG-PET scan was unremarkable. When compared with controls, [11C]-(R)-PK11195 PET analysis showed unremarkable microglia activation. The global Dice similarity coefficient was very low (i.e., 0.022), suggesting no overlap.
MCI07
A 71-year-old male was diagnosed as MCI due to difficulties in language tasks which did not impact on his activities of daily living (MMSE: 27/30). He also manifested anxiety and depression. Structural imaging showed a marked cortical atrophy mainly involving frontal and parietal regions of the right hemisphere. FDG SPM t-map revealed a significant fronto-temporal hypometabolism with an extensive involvement of the perisylvian cortex including the parietal opercula, bilaterally. Both MRI and [18F]FDG-PET were thus highly suggestive for cortico-basal degeneration [66, 67]. [11C]-(R)-PK11195 BPs map revealed increased TSPO signal in temporo-par-ietal regions, the amygdala and in subcortical regions including pallidum and putamen. The global Dice similarity coefficient was 0.047, suggesting low over-lap. The right insula (0.183) and the parietal operculum (0.111) showed greater spatial overlap between hypometabolism and [11C]-(R)-PK11195 BPs compared to other ROIs.
MCI08
A 56-year-old woman presented anxiety, depre-ssion, and attentive disturbances (MMSE: 27/30). FDG SPM t-map showed asymmetric hypometa-bolism in the dorsolateral frontal cortex, and in the lateral temporal and inferior parietal cortex, more evident in the right hemisphere, suggesting a front-otemporal dementia-like pattern. [11C]-(R)-PK11195 PET analysis showed microglia activation in the frontal cortex, lateral temporal, occipital, and parietal cortex and, notably, prevalent on the right side. The global Dice similarity coefficient was 0.101. Spatial overlap between brain hypometabolism and microglia activation was mainly found in the temporal lobe (0.344).
DISCUSSION
The present study provides evidence for an in-teraction between microglia activation and brain metabolism in MCI subjects, showing topographic overlap and significant correlations. Notably, the results were obtained in the early stage of neurodegeneration.
MCI is a heterogeneous condition, characterized by multiple possible etiologies and cognitive distu-rbances, whose pathogenesis may include amyloi-dopathy, tau deposition, other misfolded protein aggregations, and vascular disease [68]. Here, by employing a standardized SPM procedure [50, 51] to extract [18F]FDG-PET hypometabolism map at individual level, we showed disease-specific brain hypometabolism patterns, highly indicative for different underlying etiologies, as reported in the lit-erature [22, 69] (see Fig. 1). The SPM applied procedure has shown high accuracy in diagnosis and in predicting prognosis of MCI subjects [24]. Notably, by correlating the brain metabolism patterns and regional [11C]-(R)-PK11195 BPs, we showed an inverse correlation, indicating that lower brain metabolism was associated with higher TSPO expression, therefore in regions with the greatest neuroinflammatory responses. These findings allow to support the hypothesis that, in MCI with identifiable signs of neurodegeneration, microglia activation is present and contributes to neuronal dysfunction.
A variable degree of neuroinflammatory response has been reported as a common feature in different neurodegenerative diseases, where protein homeostasis is unbalanced and the microglia activation profile seems to be region and context dependent [70]. Microglial activation may be regulated by the local microenvironment, including biochemical and cellular composition, neuronal subpopulations and circuitries, which are specific of each neurodegen-erative condition and can also influence the development of a disease-dependent microglia phenotype. However, disease-dependent microglial activation mechanisms are far to be fully elucidated [70]. We reported, for the first time in single MCI subjects, that the anatomical distribution of activated microglia mirrors the specific hypometabolic patterns characterizing different neurodegenerative conditions.
In literature, only few reports exist addressing in MCI condition the relationship between brain met-abolism and microglia activation, as measured by [11C]-(R)-PK11195 PET [45, 71]. Cagnin and colleagues reported, however, only one subject with MCI showing left temporal [11C]-(R)-PK11195 binding, but normal metabolism. Coherently with the [18F]FDG-PET findings, this subject did not show further cognitive deterioration at the follow-up (23 months later), but left temporal atrophy was detected at the MRI, suggesting a subclinical active process [71]. Fan and colleagues investigated microglia activation, brain metabolism, and amyloid deposition in ten MCI subjects (in a cohort including also 10 AD dementia and 11 Parkinson’s disease dementia patients). The authors reported significant inverse correlation between microglia activation and brain glucose metabolism, along with significant positive correlation between amyloid and microglial activation. While the TSPO overexpression was evident in multiple clusters across frontal, temporal, parietal and occipital cortical regions, brain hypometabolism was detectable only in hippocampal structures and was evident in all amyloid-positive MCI subjects [45].
Our findings, confirming presence of microglia activation in the early phase of neurodegeneration, extend these results, showing that neuroinflammation is a common mechanism in response to the neurodegenerative changes irrespective of the underlying condition. It should also be noted that, in case of no evidence for neurodegeneration at the FDG SPM t-map, as in MCI06 case, also microglia activation was absent, further supporting an association between hypometabolism and neuroinflammation in neurodegenerative conditions.
The spatial overlap between brain hypometabolism and increased TSPO expression was more evident in patients with likelihood to have AD (MCI01, MCI02, MCI03, Dice coefficient >0.15). This was based on the available biomarker of neurodegeneration that is [18F]FDG-PET hypometabolism, whose pattern was indicative for both typical and atypical AD. The linear regression analysis showed that the higher the overlap, the stronger was the inverse correlation between neuroinflammation and glucose consumption. We can thus hypothesize a significant effect of activated microglia and neuronal dysfunction in MCI due to AD, as previously reported [72].
Neuroinflammation is one of the key players in the process leading to neurodegeneration. Postmortem and preclinical studies consistently reported the ass-ociation between microglia activation and both misfolded protein deposition and neuronal damage, in several neurodegenerative conditions [73–76]. Currently, the most appealing hypothesis regarding the role of microglia in neurodegenerative diseases suggests that, while expressing a protective phenotype in the earliest disease stages, aiding in pathological protein aggregates clearance, when chronically activated microglia cells lead to deleterious effects and neuronal damage [77]. Accordingly, several in vivo studies using [11C]-(R)-PK11195-PET imaging reported a consistent microglia activation in the overt phase of neurodegenerative disorders [31–33, 79]. In MCI, when neuronal dysfunction is still early, the results are less clear-cut [44]. Most [11C]-(R)-PK11195-PET studies showed a variable degree of increased tracer binding in neocortical regions of MCI subjects like in AD [33, 80]. A recent meta-analysis confirmed that, overall, increased TSPO levels are present in the neocortex of MCI subjects when compared with controls, but the magnitude of response and the affected regions can vary across studies [41]. In addition, few studies failed to detect significant TSPO overexpression in MCI subjects [81, 82]. The previous literature on microglia activation in MCI populations is, however, mostly based on group level approaches, without considering the heterogeneity of the sample. Interpreting the results in studies involving MCI subjects, the heterogeneity of this condition should be mandatory considered. The role of microglia in favoring pathological protein deposition and neuronal dysfunction in MCI has been raised in this specific population. Some studies reported microglia activation correlating with amyloid deposition [45, 72], and mirroring the pattern of increasing with tau deposition [80, 83]. Other [11C]-(R)-PK11195-PET studies did not find any correlation between TSPO signal and pathological protein deposition and clinical impairment [81, 84]. These inconsistent results may be due primarily to methodological differences among studies in TSPO-signal quantification and to the selected MCI sample. In previous works, different methods for TSPO-signal quantification have been employed, justifying very different results across studies [30, 43]. In the current study, we employed the [11C]-(R)-PK11195, which is the most used and validated TSPO tracer. Limitations in the use of this tracer are its low brain uptake and the high level of non-specific binding, with a consequent high signal-to-noise ratio [85]. To overcome this caveat, we included ten healthy controls, previously recruited for other research protocols [32, 39], to subtract in each subject the non-specific tracer binding. The remaining specific signal was further enhanced by including in the analysis only peaks of microglia activation. These procedures also contributed to the analyses on the specific regional relationship between brain metabolism and signifi-cant neuroinflammatory responses at the single subject level.
Differences in properties and target of the tracers can explain the topographic distribution of the two signals, given in some subjects a more spread regional [11C]-(R)-PK11195 BPs than hypometabolism patterns. [18F]FDG-PET is a proxy for neuronal/synaptic activity and density [21], whereas TSPO PET is a marker of microglia expression. We know that several activated microglia phenotypes exist, and [11C]-(R)-PK11195 might not be able to disentangle them [30]. It is possible that, in MCI, different phenotypes are equally distributed in the brain. Cluster of significant microglia activation might represent the expression of both a protective and a pro-inflammatory phenotype, the latter related to neurodegeneration, and thus correlated with brain hypometabolism.
The two peaks hypothesis speculate that activated microglia can adopt a protective phenotype in the early phase of MCI, then shifting to a proinflammatory phenotype as disease progresses, together with the failure of amyloid clearance [86]. Recently, it has been reported that high levels of neuroinflammation can predict cognitive decline and correlate with worse prognosis in MCI subjects [80, 87]. These results might indicate that microglia cells have already lost their protective function in a second phase [88]. In the present research study, we cannot conclude whether neuroinflammation precedes neurodegeneration, or which different microglia phenotypes exist in our cohort. Considering, however, the correlation with hypometabolism, we suggest a detrimental role of microglia activity affecting neuronal function. Longitudinal studies are necessary to better understand the timeline of these phenomena.
Our findings imply important prognostic and therapeutic repercussions. Individualized biomarkers are crucial to translate research findings into clinical trials and clinical care. Furthermore, it is vital to develop therapeutic strategies acting in a timeframe characterized by subtle or initial clinical changes, allowing a potential disease modifying approach. Further studies and conclusive results on the role of microglia in neurodegeneration would challenge to potential targets for therapeutic approaches aiming at controlling neuroinflammatory responses. Accordingly, the fine modulation of microglia, reactive astrocytes, and molecules involved in neuroinflammatory environment has already shown potential effects in modifying disease-related changes in vitro and in animal models of neurodegenerative conditions [70, 90]. Limitations in our study includes the lack of CSF measures, which was not available in most subjects, and the unavailability of longitudinal follow up. Nevertheless, the [18F]FDG-PET hypometabolism pattern is considered in the research diagnostic criteria a biomarker supportive for the diagnosis, as in each individual case in our series. In conclusion, these findings add important insights into the possible role of neuroinflammation in the early neurodegenerative phases.