
Abstract
Background:
Alzheimer’s disease (AD) is the most common form of dementia and biomarkers are essential to help in the diagnosis of this disease. Image techniques and cerebrospinal fluid (CSF) biomarkers are limited in their use because they are expensive or invasive. Thus, the search for blood-borne biomarkers is becoming central to the medical community.
Objective:
The main objective of this study is the evaluation of three serum proteins as potential biomarkers in AD patients.
Methods:
We recruited 27 healthy controls, 19 mild cognitive impairment patients, and 17 AD patients. Using the recent A/T/N classification we split our population into two groups (AD and control). We used ELISA kits to determine Aβ42, tau, and p-tau in CSF and clusterin, PKR, and RAGE in serum.
Results:
The levels of serum clusterin, PKR, and RAGE were statistically different in the AD group compared to controls. These proteins showed a statistically significant correlation with CSF Aβ42. So, they were selected to generate an AD detection model showing an AUC-ROC of 0.971 (CI 95%, 0.931–0.998).
Conclusion:
The developed model based on serum biomarkers and other co-variates could reflect the AD core pathology. So far, not one single blood-biomarker has been described, with effectiveness offering high sensitivity and specificity. We propose that the complexity of AD pathology could be reflected in a set of biomarkers also including clinical features of the patients.
Keywords
INTRODUCTION
Biomarkers are objective and quantifiable tools that can aid in the diagnosis of a specific disease. In the field of dementia, imaging-based techniques and specific cerebrospinal fluid (CSF) molecules can be used as biomarkers as they reflect the underlying pathology [1]. As Alzheimer’s disease (AD) is the most common form of dementia, many studies have focused on specific AD biomarkers. Earlier studies in AD patients found increased tracer retention on specific amyloid positron emission tomography (PET), medial temporal lobe atrophy on nuclear magnetic resonance image (MRI), and temporal/parietal hypometabolism detected by fluorodeoxyglucose PET (FDG-PET). In CSF, decreased amyloid-β 42 (Aβ42) and increased total tau and phospho-tau (p-tau) are the gold standard biomarkers [2–5]. These alterations reflected amyloid pathology, tauopathy and neurodegeneration, common processes in mild cognitive impairment (MCI) and AD. Furthermore, some of these alterations could also be seen on healthy subjects many years before the onset of clinical symptoms [6, 7].
Recently, a new framework for the use of biomarkers in research has been proposed [8]. This framework classifies patients based on pathological alterations and not by clinical symptoms: the named A/T/N classification. The A/T/N system uses a binary scheme (positive or negative) according to the measured biomarker, “A” referring to amyloid biomarkers (amyloid-PET or CSF Aβ42); “T” to specific tau biomarkers (CSF p-tau or tau-PET); and “N” to biomarkers of neurodegeneration or neuronal injury (18FDG–PET, structural MRI, or CSF total-tau) [9].
In this new framework, the underlying pathophysiological lesions in AD are the main criteria for classification, therefore the A/T/N classification is independent of the clinical manifestations of the disease. This moves AD definition from a clinical diagnosis to a purely biological construct that reflects changes in pathophysiology that may not be apparent in neuropsychological tests. At the moment, this framework is only intended for research purposes and not routine clinical care. Nonetheless, this new classification provides an important tool to improve subject selection in the context of new studies or new clinical trials. Also, according to Tang et al. (2018) [10], this framework is useful for observational studies since it emphasizes the predictive value of biomarkers. Moreover, since the A/T/N system has the advantage of being unbiased and independent of clinical status, we have the possibility of studying a clinical cohort previously defined by clinical parameters by its pathophysiology using the A/T/N system. Nevertheless, when selecting individuals for research, a combination of clinical evaluation and biomarkers may still be needed [11].
In a recent study, Burham et al. (2019) [12] applied the A/T/N classification system to the CSF biomarkers from participants belonging to the longitudinal Australian Imaging, Biomarker & Lifestyle (AIBL) study to see if the implementation of this system could help to further characterize the population. They conclude that the implementation of the A/T/N classification could help to better characterize prognosis in clinical practice and, also, it could help to identify those individuals that could have increased risk to progress to AD to include them in future therapeutic trials. Despite this, they also propose applying this classification system to larger groups of participants
As CSF and imaging-biomarkers are invasive and expensive techniques, researchers have been trying to find useful blood-based biomarkers that reflect AD’s core pathologies. These might be collected in a health center or even in the patient’s home, would be minimally invasive, and could be used for repeated analysis and monitoring, providing a valuable tool to analyze therapeutic interventions. In this study, we investigate three blood proteins that are involved in AD pathophysiology: clusterin, double-stranded-RNA-activated protein kinase (PKR), and the receptor of advanced glycation end-products (RAGE).
Clusterin (also known as Apolipoprotein J or APOJ) is a multifunctional protein with a high affinity to bind Aβ42 peptides, interfering with Aβ42 aggregation and decreasing Aβ42 toxicity [13]. However, when the levels of Aβ exceed those of clusterin, it helps its aggregation [14–16], and clusterin and Aβ42 could be co-localized into the amyloid plaques [17]. Genome-wide association studies (GWAS) indicated that some clusterin genetic variants could act as AD risk factors [18]. Thus, even it is controversial [19], investigators turned clusterin plasma levels as a potential biomarker of AD. Furthermore, clusterin plasma levels were associated with hippocampal and entorhinal cortex atrophy [20–23]. This could also be seen in healthy middle-aged adults, that showed an association between plasma clusterin concentration and atrophy in AD-related areas [24]. Clusterin was included in this study since there was enough evidence of its role in AD and it was suggested as a potential biomarker of the disease [18].
RAGE is a receptor located in endothelial cells of the blood-brain barrier (BBB), where it is normally expressed at low levels [25]. Evidence shows that the expression of RAGE is substantially increased in an Aβ42-rich environment [26, 27], leading to a RAGE-mediated influx of Aβ42 from the blood into the brain [28, 29]. Due to the impairment of the blood-brain barrier which occurs in AD [30, 31], we also propose RAGE as a potential peripheral biomarker [32]. The interaction between Aβ42 and RAGE is a source of pro-oxidant molecules that will increase oxidative stress and will also contribute to the inflammatory response generated by microglia [33–36]. In APP transgenic mice, the targeted expression of RAGE in neurons accelerates cognitive decline and Aβ42-induced neuronal toxicity [36, 37].
Lastly, PKR is a serine-threonine kinase important in cellular processes such as the regulation of apoptosis and cell proliferation [38, 39]. Under conditions of oxidative stress, PKR could modulate β-secretase (BACE1) levels, thus enhancing Aβ42 formation [40]. Phosphorylated PKR (p-PKR) is incremented in the brains of patients with AD [41], accumulates in degenerating hippocampal neurons, and partially co-localizes with p-tau [42, 43]. CSF PKR levels are increased in patients with AD and MCI [41–44], and also PKR kinases in lymphocytes correlate with memory and cognitive decline in AD [45]. Finally, previous results from our laboratory showed that the lymphocyte levels of PKR were also increased in APOE4 carriers, a major AD genetic risk factor [46]. We wanted to see if this increase was still happening in people suffering from AD.
Therefore, in this study, we aim to investigate if these three blood proteins—clusterin, PKR, and RAGE—have a potential role as blood-based bio-markers. We also consider if a combination of these proteins and other clinical features could perform AD detection in a well-characterized sample based on A/T/N classification.
METHODS
Inclusion of participants and clinical examination
Sixty-three participants were recruited in the Hospital Clinico Universitario de Valencia. The inclusion criteria for the control group were the absence of memory complaints, preservation of general cognitive functioning, and no active neurological or psychiatric disease. Also, the subject should be in an age range between 60 and 85 years old. Finally, if a subject refuses to sign the informed consent, he/she would be excluded from the study. For the AD group, the exclusion criteria were the absence of relatives, refusing to sign the informed consent (either by the subject or by the relative), and rejecting the clinical examination by the neurologists.
The control population consisted of aged-matched 27 volunteers, without memory complaints, preservation of general cognitive functioning, and no active neurological or psychiatric disease. 19 MCI and 17 AD patients were diagnosed by experienced neurologists specialized in dementia. Dubois criteria [47] were used to diagnose AD pathology and Petersen criteria [48] were used to diagnose MCI. For research purposes, all subjects were classified according to the A/T/N classification as control (A-T-) or AD (A + T- and A + T + , belonging to the Alzheimer’s continuum). Subjects that were A-T + were excluded (n = 7) from the analysis, as they might have another form of tauopathy.
Clinical and cognitive data were obtained from all subjects including the Mini-Mental State Examination score (MMSE, Spanish version [49]), age, gender, and APOE genotype.
All patients or an authorized family member signed the correspondent informed consent before participating in the study. The study was conducted according to the provisions of the Helsinki Declaration and was approved by the Ethics Committee of Clinic University Hospital of Valencia, Spain.
Biochemical analysis
CSF and blood were collected between 8–10 AM in fasting conditions using lumbar puncture and venipuncture, respectively. CSF was collected in polypropylene tubes and stored at –80°C. Blood samples were drawn by vein puncture at the time of assessment and were allowed to clot for 30 min. The clot was removed by centrifugation (1500 g for 15 min) and the resulting supernatant was aliquoted according to the volume required for each set of assays and stored at –80°C.
CSF levels of tau, p-tau181, and Aβ42 were determined by solid-phase enzyme immunoassay (Inno-genetics, Ghent, Belgium; references: INX67497, INX74378, INX27352, respectively). All values had to be in the range of quality-control standards provided in the kit. APOE genotyping was determined in serum by ApoE4/Pan-ApoE ELISA kit (MBL International, MA, USA; reference: 7635).
Serum levels of clusterin were measured by Cusa-bio Biotech. Co. (MD, USA; reference: CSB-E09121h) ELISA kit. For the determination of serum RAGE levels, we used RayBiotech Inc. (GA, USA; Reference: ELH-RAGE-001) ELISA kit. Finally, we measured PKR serum levels by Cusabio ELISA kit (reference: CSB-EL007511HU). All samples were assayed in duplicate.
Statistical analysis
Statistical analysis was performed using the software SPSS 22 and graphs were constructed using GraphPad Prism version 8. The database included diagnostic group, age, gender, APOE genotype, MMSE, CSF biomarkers, and serum protein levels. The criteria to include a subject into the statistical analysis was to have all values determined or only one missed value. We compared the population’s baseline characteristics (age, MMSE, CSF biomarkers) between A + and A- individuals using chi-squared tests, t-tests, or non-parametric equivalents.
First, we wanted to demonstrate that clusterin, PKR, and RAGE were related to AD. Therefore, we test the differences in this protein’s concentration between the two study groups. Univariate statistical analysis began with a normality test, that was performed previously to the t-test or Mann-Whitney test to compare protein levels between A + versus A- subjects (control versus AD groups). The null hypothesis was accepted when p < 0.05. When the population distribution was not normal a Mann-Whitney test was performed.
Once these differences were proven, we tried to explain if the subjects recruited could be classified in either control or AD according to the three proteins. To achieve this goal, we performed binomial regression techniques where the dependent variable was to be AD patient or control and we introduced other individual-specific characteristics as control variables such as age, APOE genotype, gender, and MMSE score.
Finally, to confirm these results and to control the possibility of non-linearity relationships between our variables, we performed a factorial analysis. To contrast, if the factors obtained from the principal component analysis (PCA) are representative of the variables included in it, Kaiser-Meyer-Olkin (KMO) and Barlett’s sphericity tests were used. Two factors were extracted with this technique, that tightly represents the relationship between all the variables introduced in the model (these were clusterin, PKR, RAGE, and all the aforementioned control variables).
Finally, the PCA model classification power was studied by plotting a Receiver Operating Characteristic (ROC) curve and the area under the curve (AUC) was calculated with the confidence interval of 95%.
RESULTS
Clinical characteristics
Table 1 summarizes the demographic and clinical characteristics of the study population. The mean participant age was 63 for controls and 69 years old for patients. Regarding gender distribution, 54% of the control group and 79% in the AD group were women. Regarding the APOE genotype, we found more ɛ4 carriers in the AD group (69%) than in the controls (27%). Since age, gender, MMSE, and APOE genotype showed statistically significant differences between both groups, they were included as covariates in the multivariate models. CSF Aβ42, CSF Tau, CSF p-Tau181 levels, and MMSE score are also shown in Table 1. As expected, CSF Aβ42 levels were lower in the AD group compared to controls. Both CSF Tau and CSF p-Tau181 levels were increased in the AD group versus controls. Finally, AD patients had a significantly lower MMSE score than controls.
Demographic and clinical characteristics for the participants
AD, Alzheimer’s disease; MMSE, Mini-Mental State Examination; CSF, cerebrospinal fluid.
Group differences between blood-based biomarker candidates
Serum levels of clusterin and PKR were significantly lower in AD patients than in control subjects (Fig. 1A, B). Moreover, increased RAGE concentration in the AD group compared to the control was observed (Fig. 1C). The p-values as well as the mean and SD of each protein are shown in Table 2.
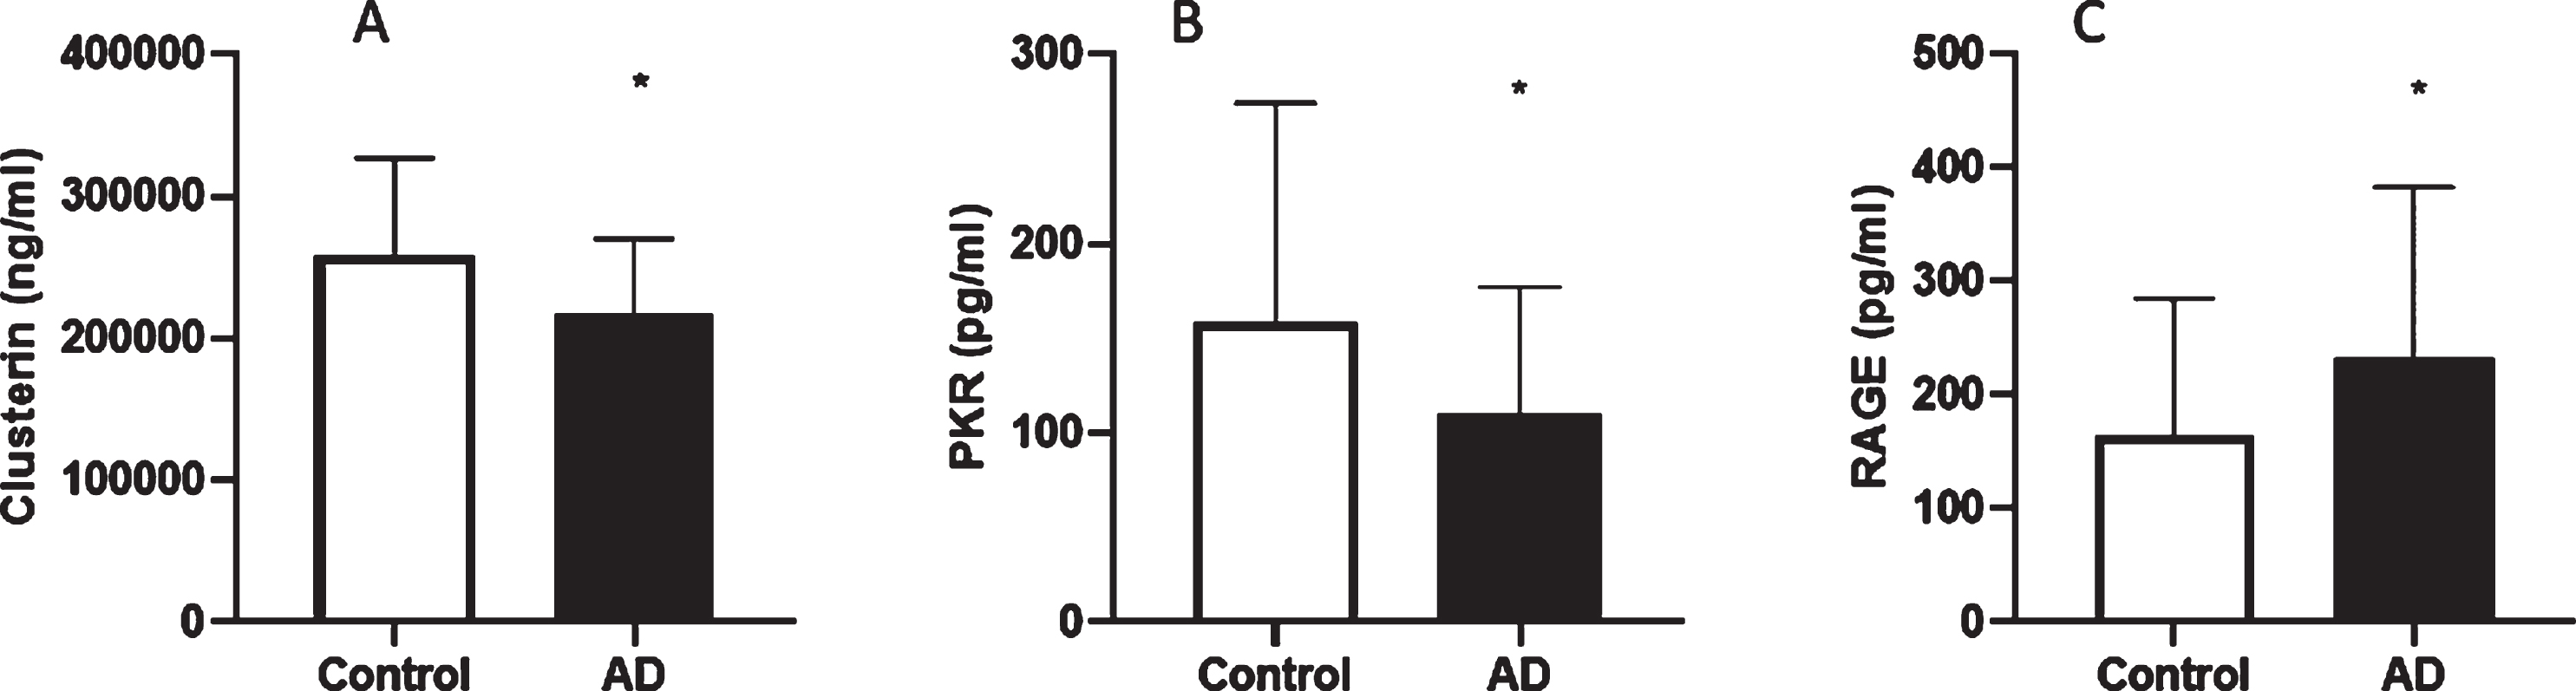
Serum clusterin (A), PKR (B), and RAGE (C) levels in control and AD subjects. Values are mean±SD. AD patients show lower levels of clusterin and PKR, they also show higher levels of RAGE. *p < 0.05 versus control group.
Mean and SD of each protein and their p-values
Due to the importance of finding biomarkers that reflect AD core pathology, we wanted to know if all three proteins are different in A + versus A- to evaluate amyloid implication and also between A + T + versus A + T- to assess the tau relationship. Our results showed that clusterin, RAGE, and PKR levels did not show differences between A + T + and A + T- groups. So, we conclude they are not related to tauopathy (Fig. 2). We also observed a strong correlation between CSF Aβ42 and clusterin (Spearman’s rho = 0.380, p < 0.01), CSF Aβ42 and RAGE (Spearman’s rho = –0.275, p < 0.05), and with CSF Aβ42 and PKR (Spearman’s rho = 0.292, p < 0.05). None of the proteins showed a significant correlation with CSF p-tau.
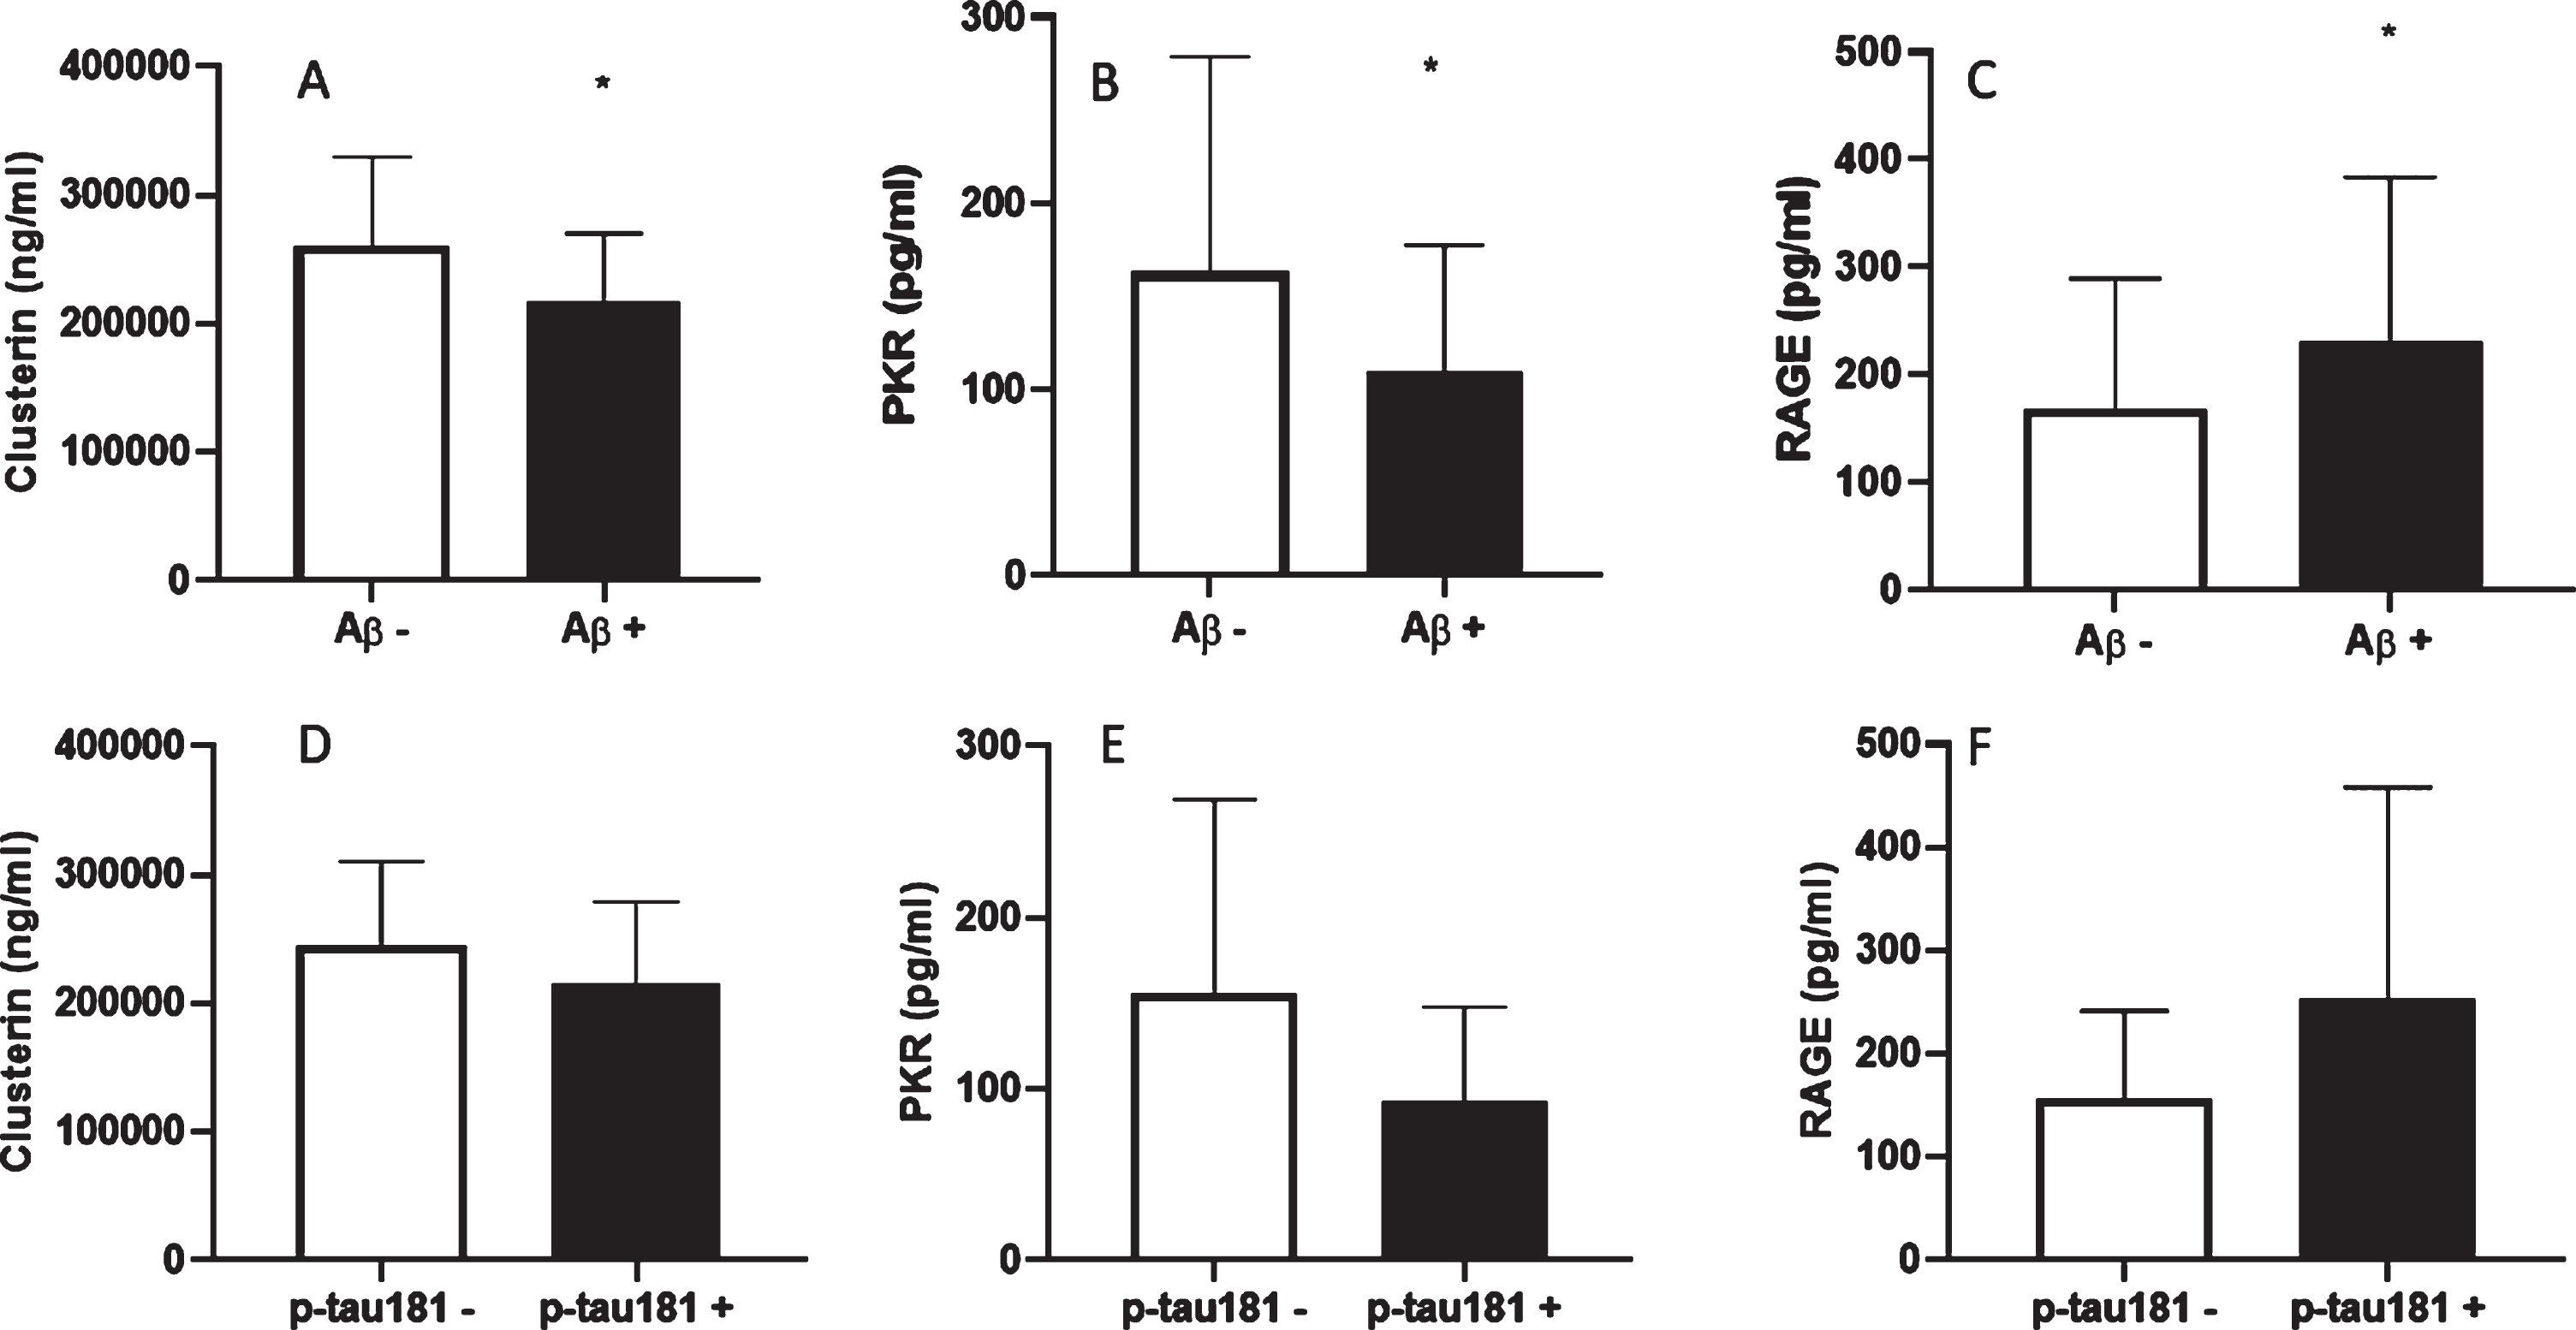
Serum clusterin (A and D), PKR (B and E), and RAGE (C and F) levels in Aβ+ (AD) versus Aβ- (control) subjects or in p-tau181 + (AD) versus p-tau181- (control) subjects. Values show mean±SD. *p < 0.05 versus Control group.
Given our results and to study the specificity and sensitivity of the candidate biomarkers, ROC curves for each protein were performed, but none of the individual ROC curves provide an acceptable AUC. We thus decided to determine whether the combination of the proteins could have a diagnostic utility.
Multivariate analysis
A factorial analysis (PCA) based on blood-based candidate protein levels, age, gender, MMSE, and APOE genotype was performed to generate a new, composite biomarker. The PCA was statistically significant (p < 0.05) and also KMO and Barlett’s sphericity were statically acceptable, which means that the two components extracted are representative of the variance of our sample. The loading graph for the factorial model is shown in Fig. 3A and the distribution of the variables shows a relationship between APOE, gender, and RAGE and also between PKR, sex, MMSE, and clusterin. This suggests that a non-linearity association exists among our variables.
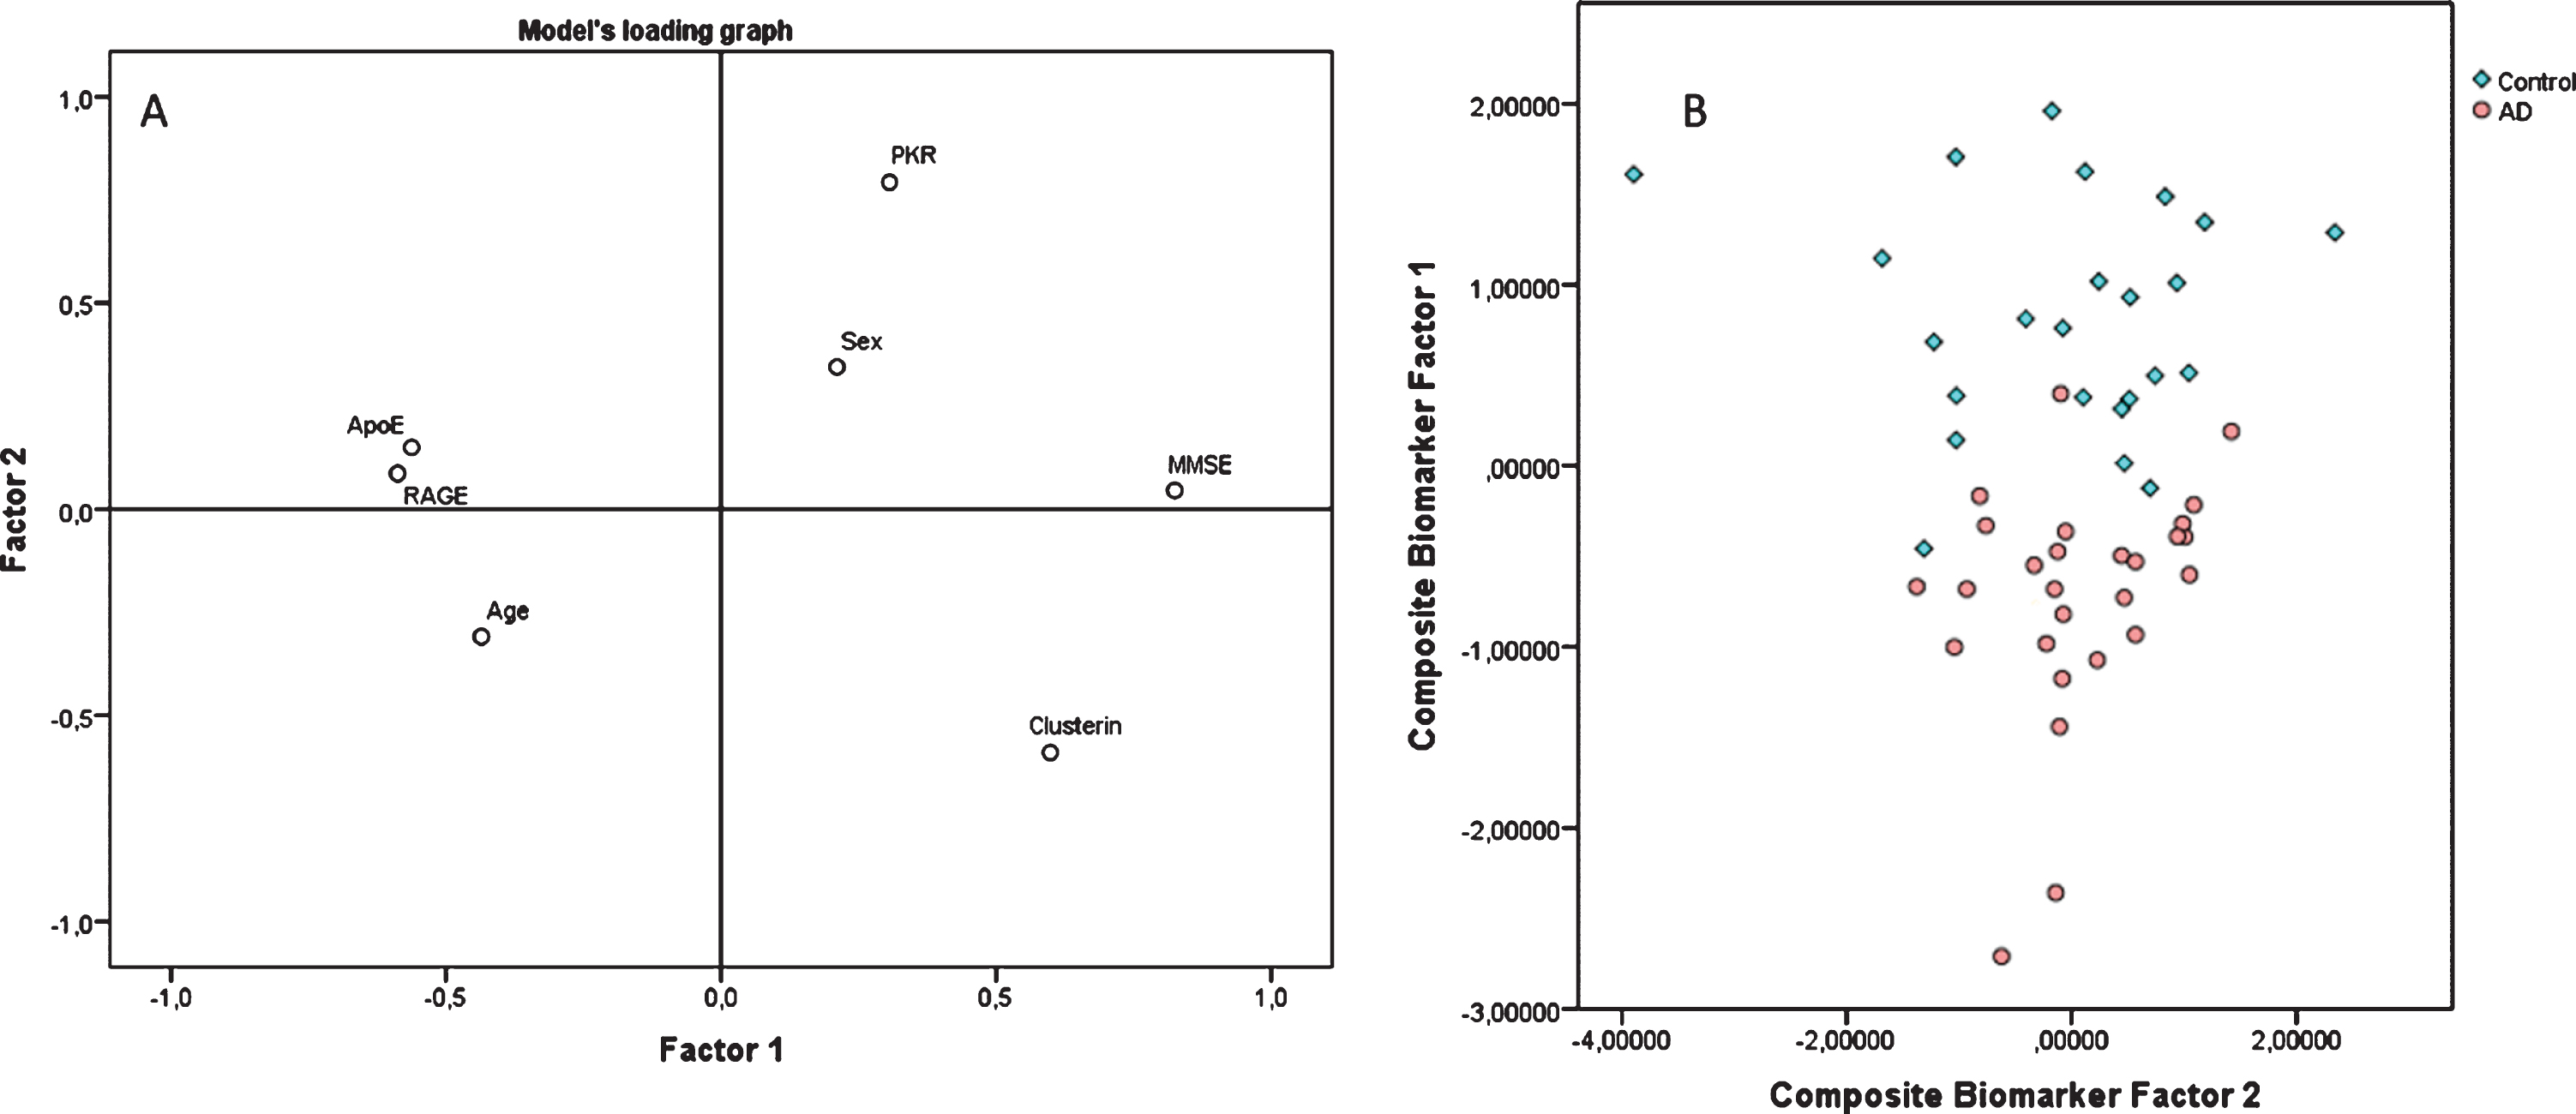
Multivariate model based on plasma biomarkers. The variables included in the model are clusterin, RAGE, and PKR levels and age, sex, APOE genotype, and MMSE score are included as covariates. We show the PCA loading graph (A) and the score plot (B), where AD patients are depicted in red while control subjects are depicted in blue. On image (B), the axes correspond to factor 1 (y-axis) and factor 2 (x-axis), extracted with the principal component analysis. Each one of the subjects is placed into the graph according to the load of both factors on it. This plot shows the capacity of our composite biomarker to discriminate among control group individuals and AD patients.
Finally, Fig. 3B shows a scatter plot where the subjects were classified by their A/T classification (controls in blue and AD in red). A binomial regression performed with the two resultant factors explained 78% of the dependent variable (control versus AD), therefore we think that the composite biomarker accurately identifies A + subjects. For this composite biomarker, the AUC is 0.971 (CI 95%, 0.931–0.998). Besides, this model has a sensitivity of 90% and a specificity of 86% (Fig. 4A).
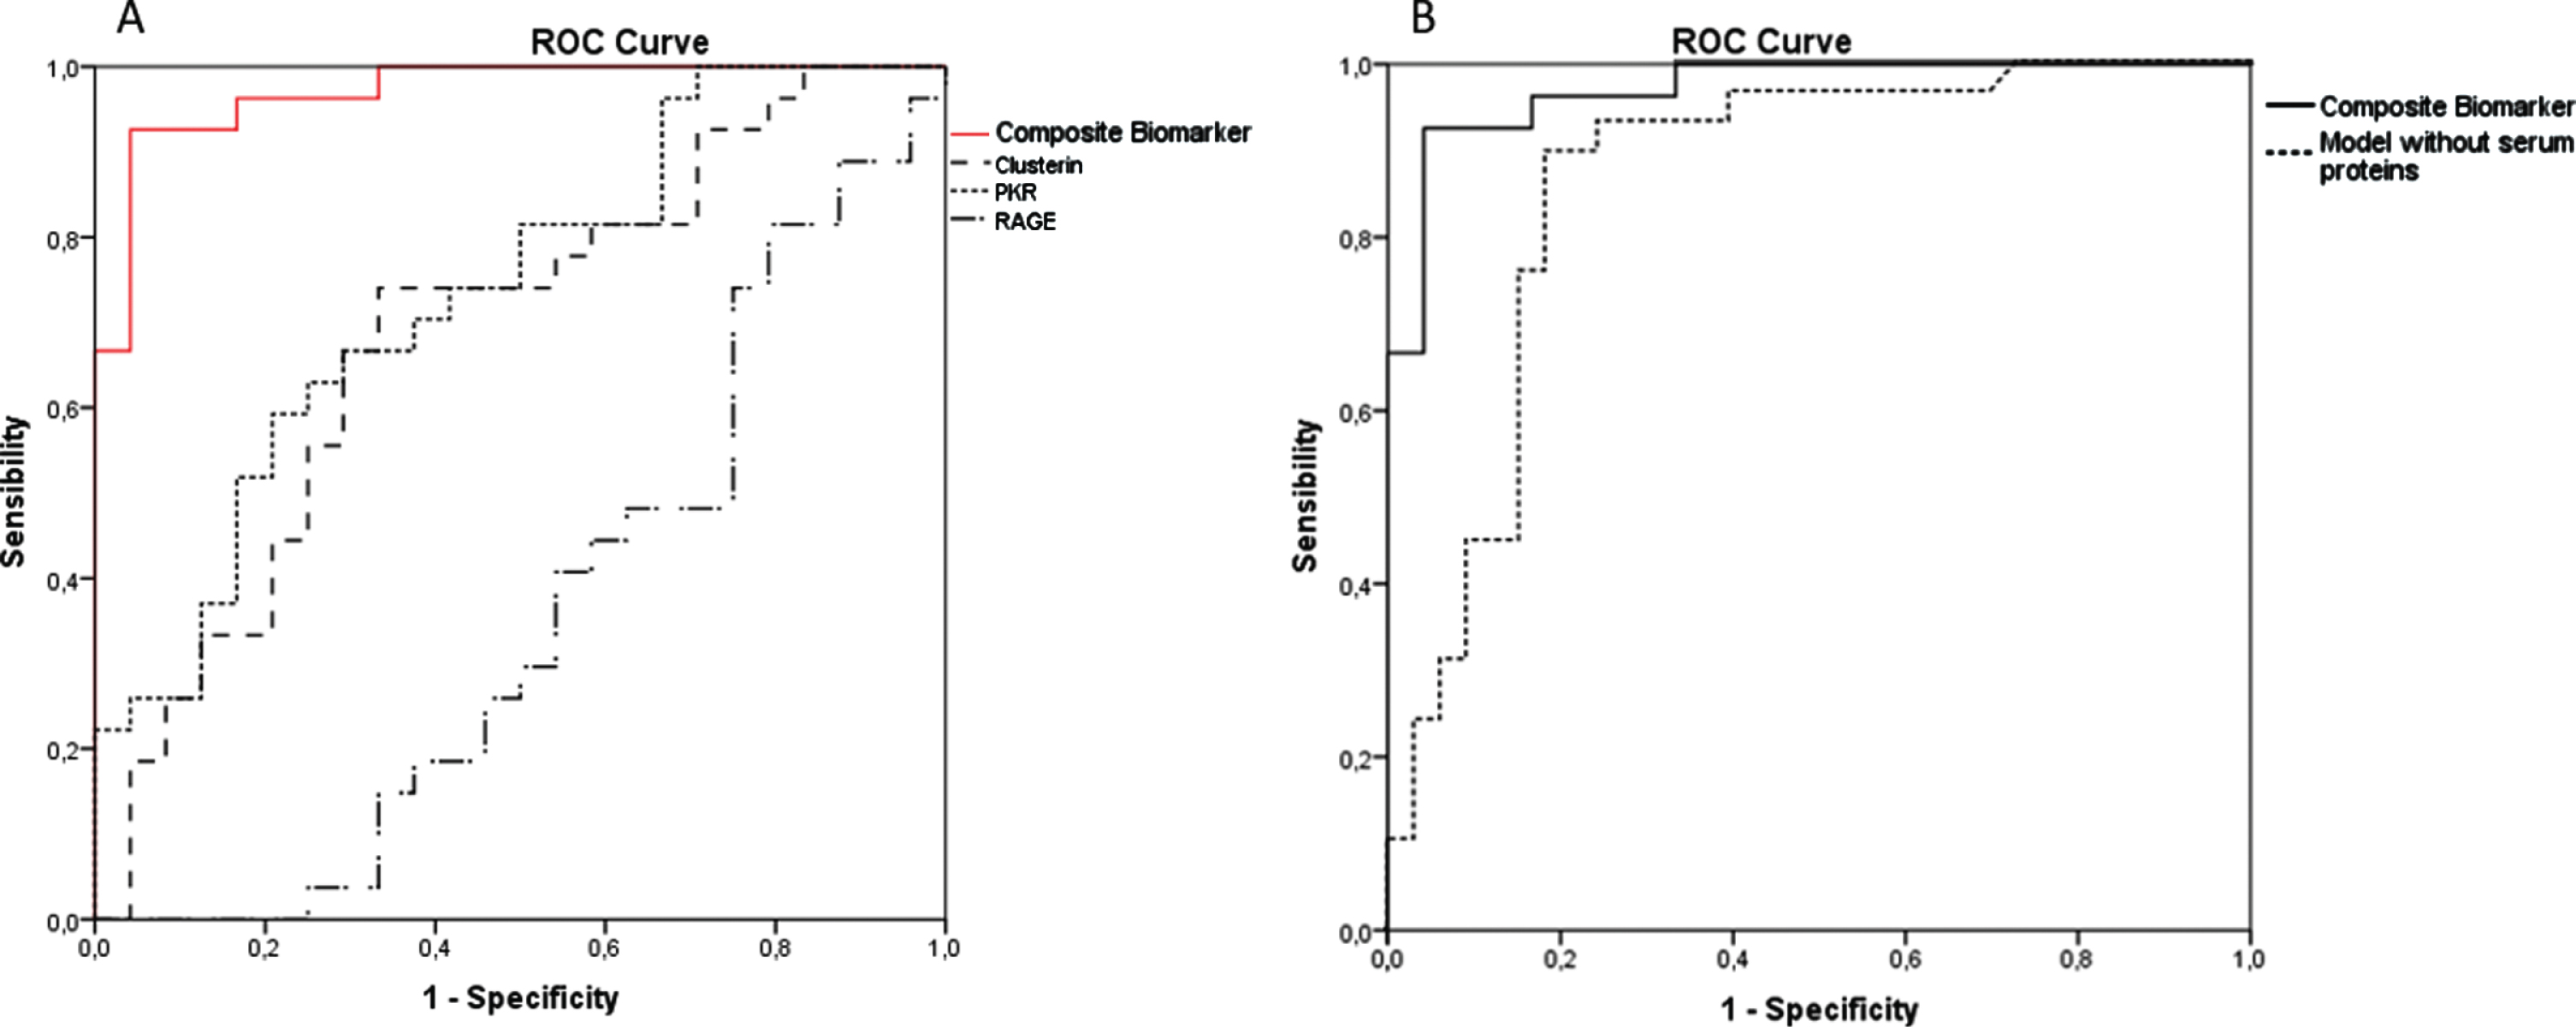
ROC curves plotted with the total study population. In graph 4A individual serum biomarkers clusterin, PKR and RAGE are plotted as well as the combined panel. The panel contains the predicted values of the combined serum clusterin, PKR, RAGE, age, sex, MMSE, and APOE4 carrier. The model detects AD or not-AD (control) with an accuracy of 0.971 (CI 95%, 0.931–0.998). In graph 4B we show the ROC curve obtained in a contrafactual analysis, where we did not include the serum biomarkers and performed the model with only the four covariates (age, sex, APOE genotype, and MMSE). The resultant model has a lower AUC (0.861 CI 95% 0.763–0.958). This suggests that our serum biomarkers are actually important in our model to improve AD detection.
We have performed a contrafactual analysis where we did not include the serum biomarkers. We repeated the model with only the four covariates (age, sex, APOE genotype, and MMSE). The principal components analysis was statistically significant, but it only extracted one factor; thus, the plotting was not possible. Moreover, the KMO test was lower than the KMO in our original model, and the resultant ROC curve showed a lower AUC (0.861 CI 95% 0.763–0.958) than the original model (including the serum biomarker). Thus, the three protein levels are important to improve AD detection. We plotted both ROC curves to further illustrate the need of introducing the blood-based biomarkers in our model (see Fig. 4B).
DISCUSSION
Clusterin, PKR, and RAGE are involved in AD pathophysiology
In this study, we show that serum clusterin, PKR, and RAGE levels change in AD patients compared with controls. Moreover, they correlate with CSF Aβ42 levels which relates them with one of the main lesions that characterize AD’s pathology: the amyloidosis path and the neuritic plaques [4]. In this sense, a biomarker should reflect the pathophysiological mechanism of the disease.
Clusterin is an apolipoprotein that regulates amyloid formation and clearance in a biphasic manner: low clusterin/Aβ42 ratio enhances plaque formation and a higher clusterin/Aβ42 ratio inhibits this process [17]. Regarding its capacity as a biomarker, some studies suggest that clusterin’s plasma concentration is associated with hippocampal atrophy and amyloid load in patients with AD [22, 50]. We find a decrease in clusterin serum levels which is in line with the results obtained in a case-control study by Vishnu et al. (2016) [51]. They report that clusterin in both plasma and CSF is decreased in subjects with AD compared to controls. However, other studies find contrary results, with increased levels of clusterin in AD patients compared to controls [52, 53]. Our results do align with the first ones.
Regarding RAGE, we show increased levels in AD patient serum compared with control subjects and they also correlate with CSF Aβ42 levels. Increased RAGE levels will promote Aβ42 entry into the brain, as already described [28, 29]. Also, an increased expression of RAGE in both hippocampus and cortex of AD patients was found, suggesting that RAGE alone would be the gateway for Aβ42 into the brain [54].
Finally, we show lower PKR levels in AD compared with controls. The role of PKR in the pathophysiology of AD has been broadly demonstrated. It can induce BACE1 activity under oxidative stress conditions [41], causing an increase in Aβ42 synthesis and this would fasten the development of AD. Furthermore, it has been suggested that Aβ42 could activate PKR, promoting a loop that produces a greater amount of Aβ42 [55]. As far as our knowledge goes this is the first report of serum PKR levels in AD. We observe a decrease in serum PKR in AD patients compared to non-demented controls.
At this point, we show that serum concentrations of all three measured proteins are related to amyloid toxicity and we have demonstrated that they correlate with amyloid burden in the population included in the study. Therefore, the serum concentration of clusterin, RAGE, and PKR are potential biomarkers of AD and they reflect the amyloid pathology in the patients.
Clusterin, PKR, and RAGE as biomarkers of AD
The distribution of subjects shown in Fig. 3 demonstrates the optimal identification of positive amyloid status provided by the model. To perform it, we introduced clinical features such as age, gender, MMSE score, and the APOE genotype of subjects in the model as covariates, in addition to the three proteins’ levels. The outcome shows a good explanation of the dependent variable, but we have gone a step forward because the relationship between the blood-based biomarkers candidate and AD was not lineal. The resultant composite biomarker shows good parameters identifying AD subjects with an accuracy of 95.1%, a sensitivity of 90%, and a specificity of 86%.
The idea of diagnosis models for AD based on potential plasma/serum biomarkers combined with other personal or clinical data has been recently extended. A very recent study shows that the combination of plasma Aβ42 with plasma glial fibrillary acidic protein (GFAP) in a panel with age and APOE has an accuracy of 88%, and a sensitivity of 82% for predicting AD positivity [56]. Besides, another study provides an integrated model where clinical features (such as age, gender, years of education, and MMSE scores), hippocampus volume, plasma Aβ42, and neurofilament light chain (NFL) are included and shows a good accuracy (74.2%) for detecting MCI patients [57].
Considering the multiple aspects of AD pathology, establishing a blood-based biomarker panel that combines several markers is needed to take a step further and increase the diagnostic accuracy. A single marker cannot reflect the complexity of AD pathology. Moreover, having a combination of markers reflecting various aspects of AD core pathology as a biomarker may be used to estimate the disease severity. It can also be useful to test the therapeutic effectiveness of putative AD treatments.
The need for blood-based biomarkers of AD
There are five biomarkers approved by the FDA [58] which are routinely used by clinicians. These biomarkers are CSF levels of Aβ42, total tau, or p-tau; retention of specific PET amyloid tracers; medial temporal lobe atrophy seen on MRI; and/or temporal/parietal hypometabolism detected by FDG-PET. Given the costs of PET or MRI and the invasiveness of CSF analysis, blood-based biomarkers that reflect the core pathological processes of AD are needed. Many researchers have focused on searching for new plasma biomarkers for many years since these biomarkers could help in monitoring the disease progression, therapeutic response, and facilitate the selection of participants for clinical trials.
In the last years, the number of studies looking for blood biomarkers has increased. For example, lipid metabolites have been proposed as peripheral biomarkers of AD because the brain is highly enriched in them. Whiley et al. [59] identified and validated several lipid molecules that were decreased in AD patients compared with age-matched control subjects. Furthermore, Proitsi et al. [60] showed that a combination of these metabolites could help to predict the disease progression. Nevertheless, another study concludes that CSF/blood phospholipid changes are not specific and sensitive enough to be a diagnostic biomarker for AD [61].
On the other hand, Nakamura and co-workers described a new method to detect Aβ levels in plasma using immunoprecipitation coupled with mass spectrometry [62]. They showed statistically significant differences among the studied groups. However, today this method is neither accessible nor easy to carry out. Plasma total tau concentrations are increased in AD subjects compared with controls, but this rise was not as evident as it is seen in CSF [63, 64]. In contrast, plasma p-tau181 levels were higher in AD patients compared with cognitively unimpaired controls. Moreover, plasma p-tau181 is associated with Aβ42 and tau PET and showed good sensitivity and specificity predicting Aβ42 brain deposition compared with total tau levels [65]. Nevertheless, these studies carried out their p-tau measurements using the single-molecule array technique (SiMoA), which is a novel ultra-sensitive technology that can detect proteins in blood at very low concentrations but is not yet available in hospitals.
Another plasma protein proposed as an AD bio-marker is NFL. NFL reflects axonal damage and its levels increase in patients with AD compared with healthy controls [66]. Moreover, elevated plasma NFL correlates with reduced cognition, brain hypo-metabolism, and neurodegeneration [67]. Nevertheless, this protein is not specific for AD since it is also increased in other neurodegenerative diseases such as Huntington’s disease or frontotemporal dementia [68, 69].
GFAP is another relevant protein that could be a promising blood-based biomarker. It reflects reactive astrocytosis and it has been shown that GFAP serum levels are increased in AD compared with controls and it correlates with MMSE [70]. Nevertheless, another study showed that CSF levels of GFAP were not significantly different between subjects with AD and Lewy bodies dementia [71], so further study of this protein is needed to test its specificity to AD.
Limitations of the study
The main limitation of this work is the reduced sample number and the fact that subjects came from the same hospital, therefore, to increase the robustness of our results, more studies are required to validate the results of these studies in other centers and with considerably larger sample size.
CONCLUSIONS
Considering all these results, we conclude that clusterin, PKR, and RAGE might have an important relationship with AD pathophysiology. Furthermore, the association of these blood-based proteins (clusterin, PKR, and RAGE) with clinical assessment (age, gender, MMSE score, APOE genotype) may help in the early diagnosis of AD.
Moreover, many research groups have been investigating plasma Aβ42 and tau species. The association of these blood-based biomarkers with serum clusterin, PKR, and RAGE might improve their diagnostic capacity, without the need to use further expensive or invasive procedures. Finally, the use of a standardized method of comparison, the A/T/N classification, provided us with a useful and easier way to compare different research methods and results.
Footnotes
ACKNOWLEDGMENTS
This work was supported by the following grants: Instituto de Salud Carlos III CB16/10/00435 (CIBERFES), (PID2019-110906RB-I00/AEI/10.13039/501100011033) from the Spanish Ministry of Inno-vation and Science, PROMETEO/2019/097 de “Consellería, de Sanitat de la Generalitat Valenciana” and EU Funded H2020- DIABFRAIL-LATAM (Ref: 825546), European Joint Programming Initiative “A Healthy Diet for a Healthy Life” (JPI HDHL) and of the ERA-NET Cofund ERA-HDHL (GA N° 696295 of the EU Horizon 2020 Research and Innovation Programme). Part of the equipment employed in this work has been funded by Generalitat Valenciana and co-financed with ERDF funds (OP ERDF of Comunitat Valenciana 2014–2020). We also thank Mrs Marilyn Noyes for her kind help in reviewing the manuscript. The authors thank Francisco Santonja for the statistical analysis support.