
Abstract
Background:
Visual impairment is associated with deficits in cognitive function and risk for cognitive decline and Alzheimer’s disease (AD).
Objective:
The purpose of this study was to characterize the degree of visual impairment and explore the association thereof with cortical atrophy in brain regions associated with visual processing in individuals with (or at risk for) AD.
Methods:
Using the Comprehensive Assessment of Neurodegeneration and Dementia (COMPASS-ND) dataset, we analyzed vision and brain imaging data from three diagnostic groups: individuals with subjective cognitive decline (SCD; N = 35), mild cognitive impairment (MCI; N = 74), and mild AD (N = 30). We used ANCOVAs to determine whether performance on reading acuity and contrast sensitivity tests differed across diagnostic groups. Hierarchical regression analyses were applied to determine whether visual performance predicted gray matter volume for vision-related regions of interest above and beyond group membership.
Results:
The AD group performed significantly worse on reading acuity (F(2,138) = 4.12, p < 0.01, ω2 = 0.04) compared to the SCD group and on contrast sensitivity (F(2,138) = 7.6, p < 0.01, ω2 = 0.09) compared to the SCD and MCI groups, which did not differ from each other. Visual performance was associated with volume in some vision-related structures beyond clinical diagnosis.
Conclusion:
Our findings demonstrate poor visual performance in AD and that both group membership and visual performance are predictors of cortical pathology, consistent with the idea that atrophy in visual areas and pathways contributes to the functional vision deficits observed in AD.
Keywords
INTRODUCTION
Alzheimer’s disease (AD) is an increasingly common age-related neurodegenerative disease that is expected to affect over 900,000 Canadians by 2030, with profound personal and economic consequences [1]. Similar to cognitive decline, poor visual function also increases in prevalence with age, with individuals 50 years or older having the highest burden of vision impairment [2]. In 2019, the World Health Organization (WHO) estimated that 2.2 billion of the world’s population are estimated to have a visual impairment [3]. Visual impairment can have a profound impact on daily functioning and independence [4, 5] and is associated with an increased risk for falls [6, 7], mortality [8], frailty, and admission to senior homes [9, 10] and long-term care where cognitive impairment is also extremely common [11, 12]. Both the burden of visual impairment and cognitive impairment will increase over the coming decades due to aging of the global population. The combination of sensory and cognitive impairment can lead to negative health outcomes and risk for disability, including difficulties with mobility and activities of daily living [13].
As the prevalence and global costs of AD rise, identification and treatment of at-risk factors has become a priority worldwide. Previous literature identifies sensory loss (specifically, hearing loss) as one modifiable factor that increases the risk for cognitive decline and developing AD [14]. Sensory loss is also associated with cortical atrophy in the aging brain [15, 16]. However, the link between sensory impairment and cognitive decline is not unique to just one sensory system (i.e., limited to hearing). There is a growing body of empirical evidence reporting longitudinal associations between visual and cognitive decline, but the underlying nature of the relationship remains unclear [17 –23]. In this paper, we aim to 1) characterize visual function and 2) explore the relationship between visual performance and cortical atrophy in clinical populations with varying cognitive functioning who are diagnosed with (or are at risk for) AD.
Review of the vision-cognition relationship
Associations between visual function and cognitive decline
In cognitively normal populations at baseline, visual deficits at baseline can predict decline in cognitive scores (e.g., the MMSE) at follow-up assessments 2–8 years later [17 , 21–23]. For example, near vision impairment at baseline has been associated with a drop in MMSE-blind performance at a 2-year follow-up assessment compared to adults with adequate near vision [21]. With other cognitive tasks, performance decline in visual acuity is associated with visual memory decline (but not with processing speed or verbal ability) over two years in the Australian Longitudinal Study of Aging [18]. Moreover, changes in visual acuity have been associated with cognitive performance on tasks measuring auditory memory, processing speed, and executive function [24]. Overall, these studies suggest that visual decline in older adults may be adversely associated with cognitive function over time.
In addition to cognitive decline, visual impairment has been associated with risk for dementia in multiple longitudinal studies [25 –31]. For example, healthy individuals aged 50–69 who self-reported moderate and severe visual impairment at baseline were 2 and 4 times as likely, respectively, to have dementia at a 10-year follow-up compared to those who reported normal vision at baseline [26]. In another longitudinal study, participants with excellent vision at baseline presented a 63%reduced risk of dementia over 8.5 years on average, whereas patients who self-reported poor vision at baseline (and also did not visit an ophthalmologist) had a nine-fold risk of developing AD and a five-fold risk for cognitive impairment without dementia [30]. In a similar study with a wider age range (individuals aged 53–102 years), poorer visual acuity at baseline was correlated with a higher risk for dementia and worse global cognitive scores over 10 years [29]. Finally, Ward et al. (2018) demonstrated that poor contrast sensitivity at baseline not only predicted reduced cognitive performance, but also development of mild cognitive impairment (MCI; individuals with clinically significant impairment in one or more cognitive domains but intact functional abilities) [32] or AD over a decade later in older women [28]. These results suggest a general directional pattern of the relationship between visual impairment and cognitive decline, in that poor visual function at baseline can predict development of cognitive decline and dementia over time.
Visual function in clinical populations with diagnosed cognitive impairment
In addition to the evidence showing that older individuals with visual impairment have a higher risk for developing AD, there is also evidence suggesting that visual deficits are prevalent in older adults with diagnosed AD. For example, visual impairment was reported in 33%of residents with a diagnosis of dementia residing in a long-term care facility [33]. In another study, the prevalence of visual impairment (measured by visual acuity worse than 6/12) was 32.5%in 708 patients with dementia aged 60–89 years [12]. These prevalence studies with dementia patients in long-term care settings provide evidence that visual impairments are common in populations already diagnosed with cognitive impairment [12, 33].
To provide additional evidence for visual deficits in AD, cross-sectional findings comparing performance on psychophysical measures of vision between AD and control groups have demonstrated that visual deficits are a feature of AD and AD-related changes. Individuals with AD demonstrate worse performance on measures of visual function compared to cognitively healthy controls, such as visual acuity [34], contrast sensitivity [35 –37], spatial orientation [38], figure copying, color vision/discrimination, and stereopsis [39 –42], general perceptual organization and visuospatial perception [43, 44], and motion and depth perception [45, 46].
Other studies have compared visual function across clinical groups with varying degrees of AD pathology. More specifically, individuals with dementia have demonstrated worse visual acuity compared to those presenting with subjective cognitive decline (SCD; individuals with subjective complaints about their cognitive capacities, but who perform within normal limits on behavioral neuropsychological tests) or MCI, after controlling for age, sex, and education [47]. In fact, patients with AD were 3.4 and 1.6 times more likely to present poorer visual acuity compared to the SCD and MCI groups, respectively [47]. Elsewhere, both MCI and AD groups demonstrated greater contrast sensitivity deficits compared to individuals with cognitive complaints or healthy controls, while the group with cognitive complaints performed intermediately between the MCI cognitively healthy controls [48]. These studies suggest that individuals with AD (and possibly MCI) are likely to perform worse on various visual tests compared to preclinical groups with less cognitive impairment, or cognitively healthy controls.
Potential mechanisms underlying the sensory-cognitive relationship
Despite growing evidence for a link between visual and cognitive impairment, the underlying mechanisms are still unclear. A number of mechanisms have been hypothesized in the observed association between sensory loss and cognitive decline; however, these hypotheses are not mutually exclusive. One hypothesis is the common-cause hypothesis, which suggests that a common factor associated with aging causes both sensory and cognitive decline through widespread neural degeneration, such as the presence of eye-related diseases [49, 50]. In support of this, individuals with AD often have concomitant diagnoses with age-related eye diseases [15] and are at a higher risk for developing age-related eye diseases (and vice versa) [28 , 63–67]. Although age is a principal risk factor for both AD and AMD, these conditions often share neuropathologic features (e.g., amyloid beta deposits and neurofibrillary tangles) [57, 58] in similar pathways and levels of the visual system, ranging from subcortical areas to cortical regions associated with visual function (e.g., primary and associative visual cortices) [15 , 60]. AD also shares similar retinal features with glaucoma, such as thinning of the retinal nerve fiber layer (RNFL), a loss of retinal ganglion cells, and optic nerve degeneration [61 –65]. Therefore, similar pathology between AD and eye-related diseases at various levels of the visual pathway and related structures may explain poor vision function in AD.
Another hypothesis is the sensory deprivation hypothesis, which posits that prolonged sensory decline gradually leads to cognitive deterioration due to neurophysiological changes in the brain [49]. In support of the sensory deprivation hypothesis, there is some evidence of structural changes in visual-processing brain regions. Previous literature shows that there is a general age-related thinning in early visual areas, including V1 [77 –80] (but see [81, 82] for evidence that does not support age-related changes in V1). Early studies have attributed poor performance on visual measures in AD patients to degeneration in visual pathways (e.g., lesions in the retina or optic nerve) or in visual cortical areas (e.g., primary and associative visual cortex) [72]. In clinical populations with profound visual impairment, multiple studies have found reduced cortical volume and thickness in regions associated with visual processing compared to healthy controls [73 –78]. Although these studies do not investigate cognitive decline, these findings may be interpreted using the sensory deprivation hypothesis, in that poor visual input can lead to long-term changes in visual pathways and related structural areas. However, there is not enough literature to establish strong conclusions on the impact of combined vision-cognitive impairment on cortical atrophy in the aging brain.
Rationale, objectives, and hypotheses
As evidenced, the interaction between sensory loss, cognitive impairment, and cortical atrophy in brain regions associated with visual processing remains largely unclear. While there is some previous research on the relationship between visual impairment and structural atrophy in vision-related brain areas, these studies do not investigate how the sensory-brain relationship differs across diagnostic groups varying in cognitive function. Therefore, the purpose of our study was two-fold: 1) to characterize visual function and 2) to investigate the role of visual performance on cortical structure in older adults with (or at risk for) AD.
Our first objective was to characterize the degree and frequency of visual impairment in a large Canadian sample of older adults with (or at risk for) AD. We analyzed data from the Comprehensive Assessment of Neurodegeneration and Dementia (COMPASS-ND) study for three diagnostic groups, who were free from age-related eye diseases: SCD (N = 35), MCI (N = 74), and mild AD (N = 30). We hypothesized that visual function (based on measures of reading acuity and contrast sensitivity) would differ across diagnostic groups (i.e., the AD group will demonstrate more deficits on both measures compared to the SCD and MCI groups). Using the same sample, our second objective was to assess the relationship between visual function, diagnostic group, and cortical volume. T1-weighted MRI images from the COMPASS-ND dataset were analyzed based on surface-based morphometry using FreeSurfer to extract cortical volume from eight vision-based regions of interest (ROIs) based on their location in the visual pathway and involvement in processing of visual information (i.e., reading acuity and contrast sensitivity) [79, 80]. We hypothesized that visual function would predict reduced cortical volume, over and above diagnostic group membership, based on previous findings demonstrating strong associations between visual deficits and cortical atrophy in vision-related brain areas. We entered variables in the following hierarchical order: demographic variables, group membership, and vision measures. We chose this order because neurodegeneration due to group membership is a strong determinant of cortical volume [81 –83]. If visual performance was able to predict cortical volume after accounting for the major variable of group member, this would be a demonstration that individual variation in visual performance is a strong predictor of cortical volume.
MATERIALS AND METHODS
Participants
From the second data release of the COMPASS-ND dataset (July 2020), we analyzed data from individuals who met the criteria for SCD (N = 55), MCI (N = 105), and AD (N = 48). Of those 208 participants, five participants were excluded due to missing MRI data or clinical data, one participant was as an outlier based on cortical volume (± 3 standard deviations (SD) compared to group average), and two participants were outliers based on performance on visual measure (± 3 SD), resulting in 53 SCD participants, 102 MCI participants, and 45 AD participants. To characterize visual function across our diagnostic groups and assess associations between visual performance and changes in vision-related cortical regions not explainable by impairment at the level of the eye, we excluded 69 participants with eye-related diseases that would potentially threaten the integrity of parts of the visual system such as the lens, retina, or optic nerve (e.g., a diagnosis of AMD, glaucoma, or untreated cataracts) across all groups. Our final sample consisted of 35 SCD participants, 74 MCI participants, and 30 AD participants for both research objectives.
COMPASS-ND is the signature clinical study of the Canadian Consortium on Neurodegeneration in Aging (CCNA), a national initiative aimed toward understanding neurodegenerative diseases, working toward prevention, and improving quality of life for individuals living with dementia [84]. Participants in the COMPASS-ND study were recruited from 31 Canadian centers (i.e., academic memory clinics, movement disorder clinics, and stroke clinics) [84]. Study participants completed an intake interview by a study physician or nurse to assess demographics, medical history, and to assess inclusion and exclusion criteria. Participants then completed comprehensive baseline evaluations, including clinical and neuropsychological assessment, biospecimen collection, and MRI neuroimaging.
General inclusion criteria were: being between 50–90 years of age, sufficient proficiency in English or French to complete self-report and neuropsychological assessment, geographical accessibility to the study site, passing safety requirements for MRI scanning, and the presence of a study partner who interacted with the participant weekly and could participate if required.
General exclusion criteria were: participants with other significant known chronic brain diseases unrelated to AD (e.g., moderate-severe chronic static leukoencephalopathy with previous traumatic injury), multiple sclerosis, a serious developmental handicap, malignant tumors, and other rarer brain illnesses; participants with on-going alcohol or drug abuse, participants without study partners, participants without sufficient proficiency in English or French, individuals unable to undergo MRI scanning, and severely impaired participants with a score of ≤13 in the Montréal Cognitive Assessment (MoCA) [85] or with a symptomatic stroke within the previous year were excluded [84]. Written informed consent was obtained from all participants. The COMPASS-ND study was approved by the Jewish General Research Ethics Board. Data from the COMPASS-ND study used in this paper are stored and curated on the Longitudinal Online Research Information System (see https://www.ccna.loris.ca for details) [86, 87].
SCD criteria
Participants who were diagnosed with SCD were selected based on the following criteria: 1) self-experienced persistent decline in cognitive capacities in comparison with a previously normal status, unrelated to an acute event [88, 89]; 2) normal age- and education- adjusted performance on standard cognitive tests including a word list recall score of > 5 on the Consortium to Establish a Registry for Alzheimer’s Disease [90], a score on the Weschler Memory Scale (WMS-III) Logical Memory II (i.e., delayed recall) [91] above ADNI education-adjusted cut-offs, and a score of≥26 on the MoCA [85]; 3) a score of 0 on the Clinical Dementia Rating (CDR) [92]. Other SCD exclusion criteria include: surgery within the last 2 months, history of intercranial surgery, regular use of benzodiazepines, a comorbid condition that is likely to result in death within three years, or age being less than 60 years.
MCI criteria
Participants who were diagnosed with MCI were selected based on the following criteria: 1) concern regarding a change in cognition from previous levels based on the participant’s or an informant’s report [32, 93]; 2) impairment in one or more cognitive domains that is greater than what would be expected for the patient’s age and education: WMS-III Logical Memory II score below education-adjusted ADNI cutoffs, CERAD word list recall score less than 6, global CDR score > 0, and MoCA score between 13–24; 3) assigned a CDR score of≤0.5 to not be given a diagnosis of dementia; and 4) have preservation of independence in functional abilities by having a score greater than 14/23 on the Lawton-Brody Instrumental Activities of Daily Living (IADL) scale. Participants must also have an absence of diffuse subcortical cerebrovascular disease to be classified as MCI.
AD criteria
Participants who were diagnosed with AD were selected based on the following criteria: 1) gradual and progressive change in memory and/or other cognitive functions over more than six months based on the participant’s and/or informant’s report; 2) objective evidence of significant decline in at least two cognitive domains by satisfying two or more of the following: WMS-III Logical Memory II score below ADNI cut-offs, a CERAD word list recall score of < 6, MoCA score between 13–24 inclusive (with at least one point lost in a non-memory task), and a “yes” response to whether the participant has had any changes in personality or behavior; 3) evidence of impairment of functional abilities by responding “yes” to whether cognitive deficits interfere with independence in everyday activities (e.g., paying bills, managing medications). There must also be no evidence for another concurrent and active neurological disease, a non-neurological medical comorbidity, or use of medication that could have a substantial effect on cognition.
Measures of visual function
Visual health information on diagnosis of age-related eye diseases (i.e., glaucoma, AMD, cataracts) and previous corrective cataract surgery were self-reported during a structured interview by the site study nurse. Vision status for each participant was determined by their performance on visual measures of reading acuity and contrast sensitivity. Both tasks were performed in controlled, well-lit clinical examination rooms across multiple testing sites.
MNRead Acuity Charts
The MNRead Acuity Charts measures reading acuity, the ability to discern sentences at a given distance, by assessing reading performance depending on various font sizes [94]. For this task, participants read sentences on a hand-held chart at a distance of 40 cm and viewed perpendicularly. Participants were encouraged to wear their habitual corrective lenses if available. Participants were instructed to read the sentences aloud, using both eyes and starting at the top of the chart until they could not read any words in a sentence.
Reading acuity was operationalized as the smallest print size at which the participant can read the entire sentence without making significant errors. Reading acuity was measured as the logarithm to the base 10 of the minimum angle of resolution (logMAR) of the last sentence a participant was able to read. The calculation was made considering both the number of sentences correctly read, words missed, and errors made: [acuity = 1.4 –(amount of all sentences read x 0.1) + (total amount of errors x 0.01)].
The MARS Contrast Sensitivity Test
The MARS Contrast Sensitivity Test was used to assess contrast sensitivity, the ability to distinguish an object from its background, by measuring the sensitivity of the eyes in processing letters across different levels of contrast [95]. MARS letters are large, defining 2 degrees of visual angle at a 50 cm test distance, corresponding to a spatial frequency of 1.25 cycles per degree [96]. For this task, participants read letters on a chart, which was held by the participant perpendicularly at a distance of 50 cm from the participant’s eyes to the chart. Again, participants were encouraged to wear their habitual corrective lenses if available. Participants were instructed to read the letters binocularly from the left to the right of each line, from the top to the bottom of the chart. Testing was discontinued when the participant made two consecutive errors.
Contrast sensitivity was operationalized as the final correct letter read by the participant. The logCS was calculated by identifying the value at the lowest contrast letter prior to two incorrectly identified letters and subtracting it by the number of errors prior to the final correct letter [97]. There was one missing case for this measure in the MCI group, which was dealt with using mean substitution for the benefit of conducting regression analyses and not group comparisons.
MRI data acquisition and analyses
MRI data acquisition
T1-weighted images were obtained using 3T scanners from different COMPASS-ND sites across Canada following the Canadian Dementia Imaging Protocol (CDIP), which is a harmonized and validated protocol for MRI data acquisition available for GE, Philips, and Siemens scanners [98]. Parameters for the acquisition of 3D T1-weighted images differed depending on the scanner type and version (see https://www.cdip-pcid.ca/ for details on all parameters).
Cortical reconstruction and segmentation of the T1-weighted images were further performed using FreeSurfer (version 6.0, documented online and freely available on http://freesurfer.net/). The FreeSurfer pipeline performs surface-based morphometry (SBM) using several processing steps described extensively in previous literature [99, 100]. The fully automated pipeline generates individual cortical surface models with high spatial precision and was performed on a web-based software called CBrain, which was designed to run intensive analyses [101]. Five participants (2 MCI, 3 AD) were excluded due to preprocessing errors by FreeSurfer. All brain scans were then manually checked for segmentation precision, with no further participants removed.
Hippocampal volume was extracted and a FreeSurfer analysis performed as described in the following. Hippocampal volumes were extracted from the T1-weighted images by submitting them to the ANIMAL (automatic non-linear image matching and anatomical labeling) segmentation method, which is an atlas-based segmentation method that uses non-linear registration to a pre-labeled template [102, 103].
Regions-of-interest analyses
Following the preprocessing procedure, the cortex was further parcellated into regions of interest (ROIs) using the Destrieux cortical atlas [104], which segments the cortex into gyral and sulcal regions on the basis of anatomical landmarks and curvature and convexity. Cortical volume was analyzed for selected ROIs (defined by the Destrieux atlas) using standard procedures for ROI extraction in FreeSurfer.
Eight ROIs were selected bilaterally based on anatomical location and involvement in visual perception and processing: primary visual regions including the cuneus gyrus, the calcarine sulcus, and the occipital pole (posterior part of the primary visual cortex that processes central vision), adjacent association areas including the middle occipital gyrus (which marks transition between visual areas V1 and V2), and secondary association areas including the inferior occipital gyrus, the superior occipital gyrus, the parieto-occipital sulcus, and the anterior occipital sulcus (connected with the parieto-occipital sulcus and calcarine fissure) [105]. First, our ROIs were based on their involvement in processing reading acuity and contrast sensitivity (e.g., V1) [79, 80] and further supported by the cortical anatomy of the visual pathway. Given the role of the primary visual cortex in processing both acuity and contrast sensitivity (i.e., our measures of visual function), we selected ROIs that include the primary visual cortex, including the calcarine region and the medial surface of the occipital lobe, which extends to both the parietal-occipital sulcus and the occipital pole [105, 106]. Moreover, as secondary visual cortices are also implicated in processing reading acuity and contrast sensitivity, we included regions that surround or are connected to the primary visual cortex (e.g., the cuneus, the superior occipital gyrus, the inferior occipital gyrus, and the anterior occipital sulcus).
Second, ROIs were based on previous publications that have used similar region-of-interest analysis methods and selected visual-based regions to assess cortical atrophy in individuals with severe visual impairments or blindness [73 –78]. Common ROIs selected by these studies and ours include the calcarine sulcus (and surrounding regions including the anterior and posterior banks), the occipital pole, the parieto-occipital sulcus, superior occipital and inferior occipital gyri, and the middle occipital regions. Similar to these studies, we selected posterior regions (e.g., occipital lobe) and anterior regions (e.g., parieto-occipital sulcus) given their approximate location and closeness to the banks of the calcarine sulcus.
Aside from visual-related regions, we also investigated cortical volume in the hippocampus and in the precentral and postcentral gyri in the motor and somatosensory cortices. Given that hippocampal atrophy is a biomarker for AD, we investigated hippocampal volume to compare effect sizes in atrophy observed in the visual cortex. Moreover, as there is consensus that both sensory and motor/somatosensory areas tend to be relatively spared in early stages of AD [107 –111], motor/somatosensory areas served as control areas to compare any significant effects we saw in the visual-based ROIs. We predicted that if there was cortical atrophy in the visual cortex but not in motor or somatosensory areas, we could conclude that atrophy in vision-related ROIs was not due simply to generalized cortical atrophy throughout the brain and that there is more atrophy in the visual cortex than conventionally expected in AD.
Statistical analyses
Data analyses were completed using R and RStudio (Version 3.6.0). Data were first assessed for missing data, data entry errors, and out of range outliers (±3 SD). Assumptions of normality (using histograms, skewness and kurtosis values, and statistical normality tests including the Kolmogorov-Smirnov and Shapiro-Wilk) and homogeneity of variance (Levene’s Test) were also checked. We conducted Chi-squared tests for independence to determine whether comorbid eye-related disease or visual deficits were significantly related to diagnostic group membership. Given that there was a significant group difference in the proportion of AMD diagnosis (see Table 1) and to achieve a cleaner picture of visual function in our participants without visual deficits, we excluded individuals with a comorbid diagnosis of AMD, glaucoma, or untreated cataracts. In this smaller sample, we used age and sex as covariates in all statistical analyses based on group differences (see Table 2). In analyses involving cortical structure, we also included education and intracranial volume (ICV) as covariates in order to control for potential differences in premorbid brain volume between groups [112].
Demographics and descriptives of vision variables, eye-related diseases, and visual deficits for SCD, MCI, and AD groups
* p≤0.05, ** p≤0.01. 1Controlling for age and sex; logMAR = logarithm of the minimum angle of resolution; lower score indicates better performance; logMAR < 0.30 (equivalent of better than 20/40) = normal acuity. logMAR 0.30 to 0.50 (20/40 to 20/60) = moderate visual impairment. 2Controlling for age and sex; higher score indicates better performance; < 1 log CS = severe impairment, 1–1.5 log CS = moderate impairment, > 1.5 log CS = normal for age 60 + .
Demographics and descriptives of vision variables for SCD, MCI, and AD groups, after exclusion of individuals with eye-related diseases
* p≤0.05, ** p≤0.01. 1Controlling for age and sex; logMAR = logarithm of the minimum angle of resolution; lower score indicates better performance; logMAR < 0.30 (equivalent of better than 20/40) = normal acuity. logMAR 0.30 to 0.50 (20/40 to 20/60) = moderate visual impairment. 2Controlling for age and sex; higher score indicates better performance; < 1 log CS = severe impairment, 1–1.5 log CS = moderate impairment, > 1.5 log CS = normal for age 60 + .
For our first objective, the diagnostic groups were first compared in their performance on the vision measures (i.e., reading acuity and contrast sensitivity) using one-way ANCOVAs. For pairwise comparisons, we conducted post-hoc tests with Bonferroni adjustment for multiple comparisons and calculated Cohen’s d to estimate effect size between groups. For our second objective, we conducted hierarchical (sequential) regression models to determine whether visual performance predicted cortical structure over and above group membership. With cortical volume as the outcome variable, a family of four hierarchical regressions were conducted for each of the eight ROIs in each hemisphere. All regressions had the same predictor variables entered at the same step for all four models. All continuous predictors (age, years of education, ICV, reading acuity scores, contrast sensitivity scores) were scaled across the overall sample for ease in interpretation. For predictors with multiple levels (sex, diagnostic group), SCD women were used as the referent group (SCD group was expected to be closest to healthy controls in terms of cognitive function and cortical atrophy). Pairwise comparisons between the MCI and AD groups were also done for each regression to assess group-specific relationships between visual performance and brain structure. In the first model, the demographic predictors age, sex, education, and total ICV were used to predict volume in each ROI. In the second model, diagnostic group was added as a predictor because previous literature has established that cortical structure differs based on diagnostic group [81 –83], and in fact, group membership was a significant predictor for overall gray matter volume in our sample (β= –0.27, t(132) = –2.97, p < 0.01). In the third model, both reading acuity and contrast sensitivity scores were added as variables of interest to determine if performance on visual tests predicted a significant amount of additional variance in cortical volume. Based on limited theoretical and logical rationale as to whether reading acuity or contrast sensitivity would explain more variance in cortical structure, both measures were entered in the third model simultaneously. In the fourth and final model, diagnostic group was set to interact with reading acuity and contrast sensitivity scores to determine whether the relationship between visual performance and cortical structure differed by group (i.e., whether an interaction between visual performance and group explained variance beyond the separate main effects of visual performance and diagnostic group in Models 2–3). Analysis of the best predictive model and influence of each predictor in explaining the variance in cortical structure was done primarily by running an ANOVA between the four models with an alpha level of 0.05; moreover, R2 change and Akaike Information Criterion (AIC) weights (i.e., the relative likelihood that a given model is the best approximating model given the data and the four models considered) were also examined to determine model selection [113]. For all regressions, we used the adaptive Benjamini-Hochberg False Discovery Rate (FDR) adjustment for multiple comparisons across brain areas and hemispheres. We also explored unstandardized beta (B) as an estimate of effect size difference between diagnostic groups when comparing atrophy across multiple regions.
RESULTS
Table 1 lists the demographics, descriptive information on visual measures, and counts of eye-related diseases and visual deficits for each diagnostic group in the overall sample. The AD group was significantly older, with fewer years of education, compared to the SCD and MCI groups. Moreover, there was a significant difference in sex over the diagnostic groups, such that the AD group was largely male (66.6%) and the SCD group was largely female (77.5%; see Table 1). There was a significant group difference for AMD between diagnostic groups, such that the AD group had a reliably higher percentage of AMD cases compared to the SCD and MCI groups (see Table 1). Table 2 lists the demographic and descriptive information on visual measures for our final sample without eye-related diseases. The AD group was still significantly older than the SCD and MCI groups and disproportionately male (66.6%) whereas the SCD group was largely female (80%; see Table 2). Age and sex were controlled for in all analyses.
Diagnostic group comparisons in visual function
Figure 1 shows a categorical distribution of performance on both vision measures across our sample without eye-related diseases. Most participants demonstrated normal reading acuity and contrast sensitivity. For each visual measure, 100%of SCD, 100%of MCI, and 93%of AD had normal reading acuity and 94%of SCD, 95%of MCI, and 73%of AD had normal contrast sensitivity.
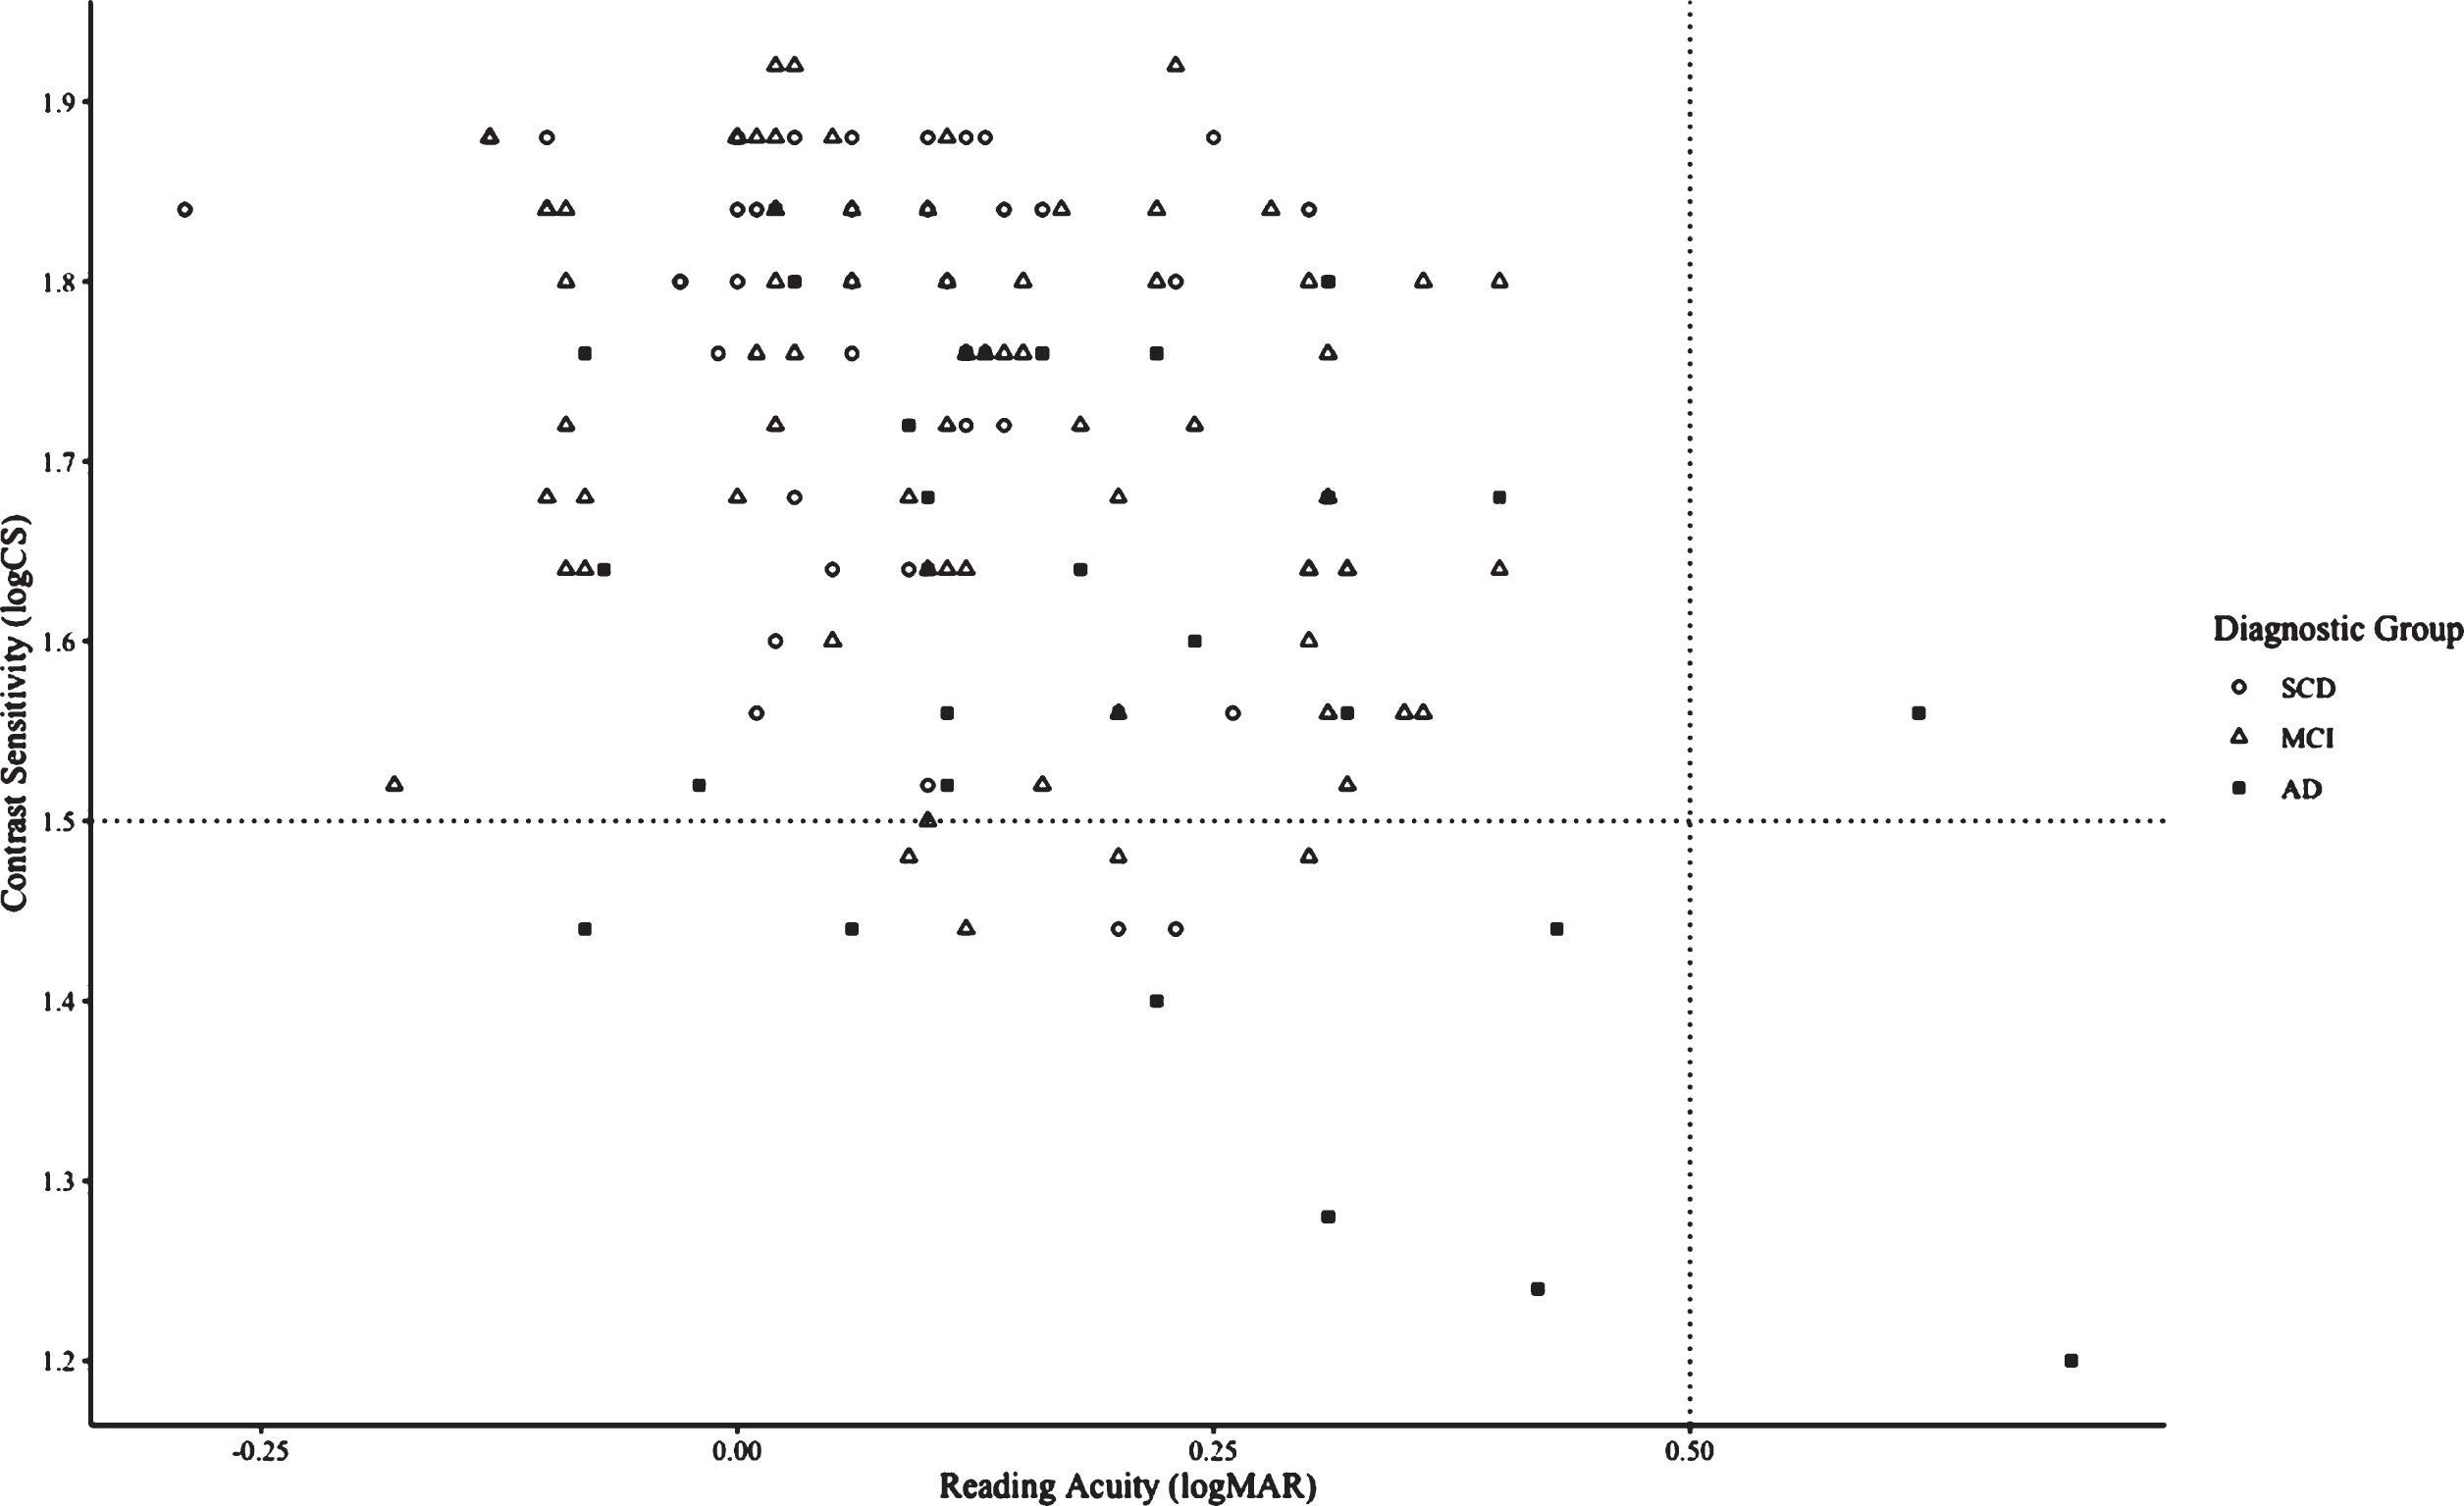
Characterizing visual function based on performance on both visual measures in groups without eye-related diseases and with subjective cognitive decline (SCD, N = 35), mild cognitive impairment (MCI, N = 74), and Alzheimer’s disease (AD, N = 30). The top-left quadrant indicates normal reading acuity and normal contrast sensitivity (94%of SCD, 95%of MCI, 73%of AD), the top-right quadrant indicates low reading acuity and normal contrast sensitivity (0%of SCD, 0%of MCI, 3%of AD), the bottom-left quadrant indicates normal reading acuity and low contrast sensitivity (6%of SCD, 5%of MCI, 20%of AD), and the bottom-right quadrant indicates low reading acuity and low contrast sensitivity (0%of SCI, 0%of MCI, 3%of AD).
There was a significant difference between diagnostic groups in reading acuity performance (F(2,138) = 4.12, p < 0.01, ω2 = 0.04; see Fig. 2) and in contrast sensitivity performance (F(2,138) = 7.6, p < 0.01, ω2 = 0.09; see Fig. 3). Post-hoc tests demonstrated that the AD group (0.19±0.03) performed significantly worse on reading acuity compared to the SCD (0.07±0.03, p = 0.02, d = 0.74), with no statistically significant difference between the AD and MCI groups (0.12±0.02, p = 0.11, d = 0.45) or the SCD and MCI groups (p = 0.28, d = 0.29). Post-hoc tests showed that the AD group (1.62±0.03) performed significantly worse on contrast sensitivity compared to the SCD (1.75±0.02, p < 0.01, d = 0.85) and MCI groups (1.73±0.02, p < 0.01, d = 0.71), with no statistically significant difference between the SCD and MCI groups (p = 0.78, d = 0.17).

Performance on reading acuity across groups with subjective cognitive decline (SCD), mild cognitive impairment (MCI), and Alzheimer’s disease (AD). Reading acuity was measured using the MNRead Acuity Charts. *indicates a significant difference between groups (p < 0.05).

Performance on contrast sensitivity across groups with subjective cognitive decline (SCD), mild cognitive impairment (MCI), and Alzheimer’s disease (AD). Contrast sensitivity was measured using the MARS Contrast Sensitivity Test. ***Indicates a significant difference between groups (p < 0.001).
Predicting cortical structure by demographics, diagnostic group, and visual performance
For all groups, Fig. 4 presents the cortical volume of vision-related ROIs across both hemispheres. For several regions, none of the entered predictors, including demographic predictors, explained a significant amount of variance in cortical structure (e.g., the left cuneus and anterior occipital sulcus and in the right superior occipital gyrus, calcarine sulcus, and right anterior occipital sulcus).
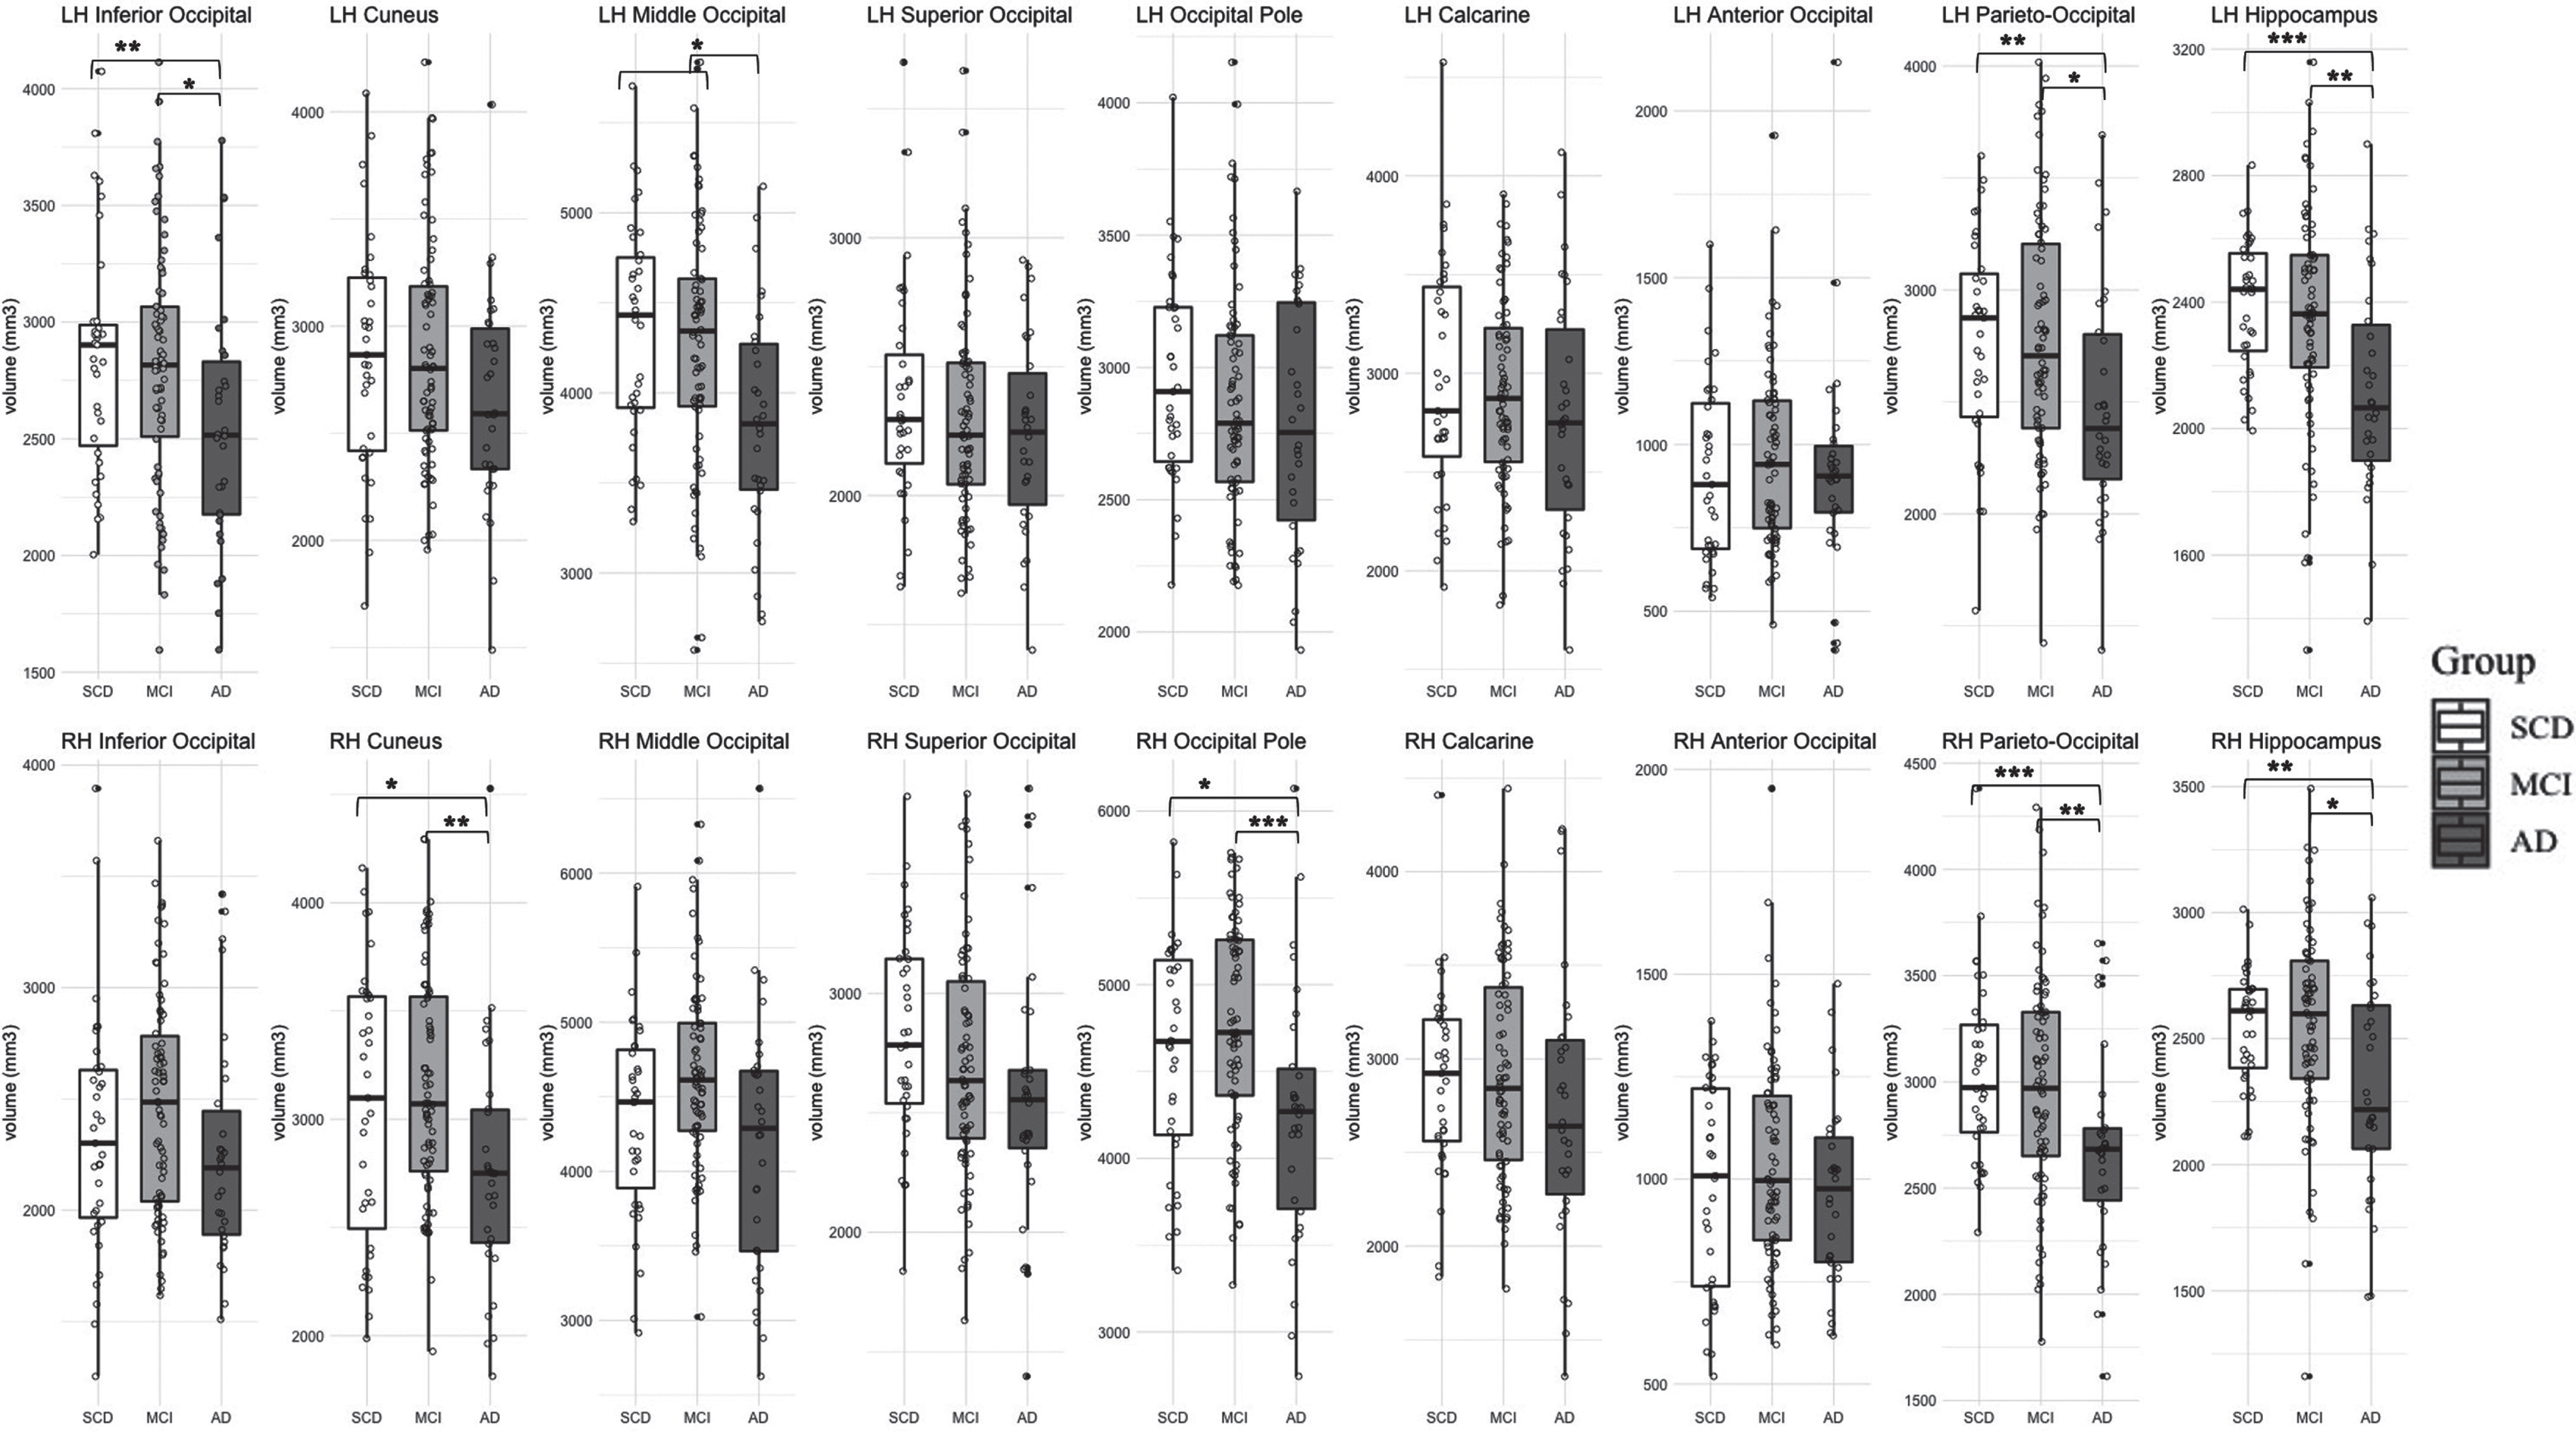
Gray matter volume in vision-related regions of interest and hippocampus across groups with subjective cognitive decline (SCD), mild cognitive impairment (MCI), and Alzheimer’s disease (AD). Note that *** p < 0.001, ** p < 0.01, * p < 0.05.
Demographic predictors (Model 1)
Model 1, consisting of only age, education, sex, and total intracranial volume, was selected as the best model for several ROIs, with group and visual performance not explaining any significant additional variance in cortical volume. These regions include the left superior occipital gyrus, left occipital pole, left calcarine, and right inferior occipital gyrus. More specifically, there is a significant relationship between age and cortical volume in the left superior occipital gyrus, between total intracranial volume and cortical volume in the left occipital pole, between years of education and cortical volume in the left superior occipital gyrus, and between sex and years of education with cortical volume in the right inferior occipital gyrus (see Table 3).
Regression models for the volume of vision-related regions-of-interest (left hemisphere)
*** p < 0.001, ** p < 0.01, * p < 0.05; aModel 2 was selected as the best model for the left inferior occipital gyrus; bModel 3 was selected as the best model for the left middle occipital gyrus and left parieto-occipital sulcus; B, unstandardized beta coefficient; SE, standard error; ICV, intracranial volume; AIC, Akaike Information Criterion. SCD women were used as the referent group for all regressions. All regressions were corrected for multiple comparisons using the Benjamini-Hochberg FDR procedure.
Group membership (Model 2)
Having controlled for age, sex, education, and total ICV, and holding SCD women as the as the reference group, we found that group membership explained a significant amount of variance in cortical structure for the left inferior occipital gyrus (an additional 5.4%of variance compared to Model 1; SCD, MCI > AD. In the right hemisphere, group membership explained a significant amount of cortical variance in the right cuneus (an additional 6%of variance compared to Model 1; SCD, MCI > AD), the right middle occipital gyrus (an additional 5.5%of variance compared to Model 1; SCD, MCI > AD), and the right parieto-occipital sulcus (an additional 9%of variance compared to Model 1; SCD, MCI > AD; see Table 4).
Regression models for the volume of vision-related regions-of-interest (right hemisphere)
***p < 0.001, ** p < 0.01, * p < 0.05; aModel 2 was selected as the best model for the right cuneus, middle occipital gyrus, and parieto-occipital sulcus bModel 3 was selected as the best model for the right occipital pole; B, unstandardized beta coefficient; SE, standard error; ICV, intracranial volume; RA, reading acuity; CS, contrast sensitivity; AIC, Akaike Information Criterion. SCD women were used as the referent group for all regressions. All regressions were corrected for multiple comparisons using the Benjamini-Hochberg FDR procedure.
Visual performance (Model 3)
In addition to group membership, visual performance explained a significant additional amount of variance in cortical structure and was selected as the best predictive model for the left middle occipital gyrus, the left parieto-occipital sulcus, and the right occipital pole. Specifically, contrast sensitivity performance predicted a significant amount of cortical volume in the left middle occipital gyrus above and beyond group membership (an additional 2.9%of variance compared to Model 2 with 70%probability of being the best model across all four models; see Table 3). Performance on reading acuity predicted a significant amount of cortical volume in the left parieto-occipital sulcus above and beyond group membership (an additional 3.6%of variance compared to Model 2 with 82%probability of being the best model across all four models; see Table 3). In the same model, group membership remained a significant predictor of cortical variance in the left parieto-occipital sulcus. Therefore, both reading acuity and group membership were significant predictors for the left parieto-occipital sulcus. In the right hemisphere, contrast sensitivity predicted a significant amount of cortical variance in the right occipital pole (an additional 5.7%of variance after Model 2 with 96%probability of being the best model across all four models; see Table 4). Specifically, performance on contrast sensitivity predicted a significant amount of cortical volume above and beyond group membership (see Table 4).
Interaction between group membership and visual performance (Model 4)
In no cases did Model 4 (which allowed for an interaction between group and visual performance) significantly account for greater than 2.9%of variance in cortical volume after Models 1–3, in any of the eight ROIs across both hemispheres.
Group differences in cortical structure in hippocampal and motor and somatosensory areas
As expected, we found significant differences between groups in left and right hippocampal volume (see Tables 5–6). In the left hemisphere, both the SCD (B = 279.96, t(65) = 3.04, p < 0.01) and MCI groups (B = 162.31, t(104) = 2.11, p < 0.05) had significantly more hippocampal volume compared to the AD group, with no significant difference between the SCD and MCI groups (see Fig. 4). Similarly, in the right hemisphere, both the SCD (B = 275.83, t(65) = 2.52, p < 0.05) and MCI groups (B = 186.7, t(104) = 2.04, p < 0.05) had significantly more hippocampal volume compared to the AD group, with no significant difference between the SCD and MCI groups (see Fig. 4). Our results demonstrated no significant differences between groups for the precentral and postcentral gyri in either hemisphere (see Tables 5–6).
Regression models for the volume of Hippocampus and the motor and somatosensory regions (left hemisphere)
*** p < 0.001, ** p < 0.01, * p < 0.05; B, unstandardized beta coefficient; SE, standard error; ICV, intracranial volume. SCD women were used as the referent group for all regressions. All regressions were corrected for multiple comparisons using the Benjamini-Hochberg FDR procedure.
Regression models for the volume of Hippocampus and the motor and somatosensory regions (right hemisphere)
*** p < 0.001, ** p < 0.01, * p < 0.05; B, unstandardized beta coefficient; SE, standard error; ICV, intracranial volume. SCD women were used as the referent group for all regressions. All regressions were corrected for multiple comparisons using the Benjamini-Hochberg FDR procedure.
DISCUSSION
The goal of the present study was to characterize visual function in individuals with or (at risk for) AD and explore the degree to which visual performance was associated with brain structure. Our findings indicate that older adults with AD had significantly worse visual functioning compared to those at risk for AD (SCD and MCI groups). We also observed that the AD group had significantly reduced cortical volume in multiple brain regions associated with visual functioning compared to the SCD and MCI groups, similar to group differences in hippocampal volume. We did not find this group difference in the motor or somatosensory cortex, suggesting that the observed atrophy in the visual cortex in our mild AD participants is not simply a result of generalized cortical atrophy throughout the brain. Finally, our results demonstrate that visual performance is correlated with cortical structure for multiple ROIs, suggesting a relationship between vision function and cortical pathology in some vision-related brain areas beyond that accounted for by group membership.
Visual performance in older adults with (or at risk for) AD
The AD group demonstrated poorer reading acuity compared to the SCD group and poorer contrast sensitivity compared to the SCD and MCI groups, after controlling for age and sex. There were no significant differences between the MCI and SCD groups; moreover, visual function in the SCD and MCI groups were mostly within the normal range. First, these results suggest that vision impairment may only be evident in later stages of AD progression, thereby replicating previous results [34–37 , 47]. Second, 91%of our AD sample had normal reading acuity and 73%of AD had normal contrast sensitivity. Thus, even though the AD group demonstrated poorer performance on measures of reading acuity and contrast sensitivity compared to the other two groups, the majority of AD individuals performed within the normal range and did not present severe visual difficulties on both measures. The poorer visual performance of the AD group compared to the SCD and MCI groups was not confounded by a higher prevalence of co-morbid age-related eye diseases or by the duration since AD diagnosis because we excluded participants with eye diseases in our sample. Thus, our results demonstrate that the poorer visual function observed in our AD group was not simply due to pathology at early levels of the visual pathway.
Our findings demonstrate a consistent pattern across visual measures and diagnostic groups, such that AD participants had worse visual performance than SCD and MCI. The visual performance deficits in our AD sample is consistent with previous research, that has shown that individuals with AD present worse performance on measures of visual acuity [34, 35] and contrast sensitivity [36, 37] compared to controls. Similar to our findings on reading acuity, Marquie et al. (2019) also found that AD patients presented poorer visual acuity compared to the SCD and MCI groups [47]. Another study identified both AD and MCI groups with poorer contrast sensitivity compared to individuals with cognitive complaints (i.e., SCD) [48]. Our findings (i.e., AD had poorer contrast sensitivity compared to both SCD and MCI groups) may slightly differ based on variability in age of diagnostic groups and the type of measure used to assess contrast sensitivity.
Relationship between group membership and cortical structure
We found that group membership predicted cortical structure for multiple secondary vision-related regions in each hemisphere beyond the baseline model predictors of age, sex, education, and ICV. The AD group showed reduced cortical volume compared to both the SCD and MCI groups in the inferior occipital gyrus and the left parieto-occipital sulcus, which are part of the secondary visual cortex surrounding primary vision regions. Similarly, in the right hemisphere, the AD group also showed reduced cortical volume compared to both the SCD and MCI groups in the right cuneus, the right middle-occipital gyrus, and the right parieto-occipital sulcus, which are all secondary regions or transition areas between the primary and secondary visual cortices. Moreover, it should be noted that there was a strong relationship between group membership and reduced cortical volume in the left cuneus (β= –0.25, t(132) = –2.3, p < 0.05) although Model 2 was not selected as the best model based on our alpha threshold of statistical significance. This demonstrates reliable group differences in cortical atrophy across both hemispheres in secondary vision regions, such as the cuneus and parieto-occipital sulcus. Moreover, the AD group specifically demonstrates more cortical atrophy in multiple secondary or association visual areas compared to the SCD and MCI groups.
Cortical atrophy in the hippocampus and medial temporal lobe has been supported as a neurological marker of increasing AD pathology [114, 115]. Nevertheless, there is evidence of cortical degeneration in visual-related regions in AD groups. AD patients show degeneration in the primary visual cortex and secondary visual association cortices [116 –120] as well as in subcortical regions comprising parts of the visual pathway (e.g., lateral geniculate nucleus) [121] and degeneration of the optic nerve and retinal ganglion cells [65 , 123]. Relevant to our findings, individuals with MCI and AD present extensive senile plaques and neurofibrillary tangles in secondary visual association areas (e.g., Brodmann areas 18 and 19) that are adjacent to the primary visual cortex (i.e., Brodmann area 17), which are associated with the many visual functions reported to be impaired in AD (e.g., visuospatial processing, visual motion) [117 , 120]. In comparison to secondary regions, primary visual areas (i.e., the primary visual cortex or Brodmann area 17) are relatively spared and present less neuropathology in these studies. This literature provides support for the cortical atrophy observed in our AD sample across multiple vision-related regions, and secondly, our findings between group membership and cortical variance in secondary association areas.
The current consensus is that medial temporal areas are affected in AD disproportionally early in the disease process (including changes in these areas in MCI, and, to a lesser degree, in SCD) [108, 124], whereas primary sensory and motor/somatosensory areas are left relatively spared or affected even at late stages of AD [107, 109–111, 125]. In our study with mild AD participants, we noted that group membership predicted changes in cortical volume in both the visual and hippocampal areas to a similar degree. More specifically, the effect size differences between groups (i.e., unstandardized beta coefficients for group membership) for some vision-related ROIs were comparable to that of the hippocampus, such as the left inferior and middle occipital gyri and parieto-occipital sulcus, and the right parieto-occipital sulcus (see Tables 3 –6). Moreover, we found no group differences in the precentral and postcentral gyri (i.e., motor and somatosensory areas). This suggests that there is more atrophy in the visual cortex of AD participants than expected based on typical brain atrophy progression in AD [83 , 111], especially as the magnitude of change in cortical volume due to group membership observed in the visual cortex was in range to that observed in the hippocampus (a region with generally more prominent AD pathology).
Relationship between visual performance and cortical structure
Visual performance significantly accounted for variance in cortical structure for some visual-based ROIs once age, sex, education, ICV, and group membership were included in the analysis. Contrast sensitivity accounted for a significant amount of unique cortical variance in the left middle occipital gyrus and the right occipital pole, above and beyond group membership. It is also worth noting that although Model 3 was not selected as the best predictive model based on our alpha threshold of statistical significance, there was a significant relationship between better contrast sensitivity performance and more cortical volume in the right middle occipital gyrus (β= 0.19, t(130) = 1.99, p < 0.05) and the left occipital pole (β= 0.24, t(130) = 2.42, p < 0.05). These findings suggest that deficits in contrast sensitivity may reflect atrophy in the primary visual areas that are responsible for processing low-level central vision (i.e., the occipital pole) [75, 105] and visual letter and word form (i.e., the middle occipital gyrus) [126], compared to measures like reading acuity which may not be as sensitive to pathological cortical-related decline in the primary visual cortex. However, we did find that reading acuity accounted for an additional unique amount of cortical variance in the left parieto-occipital sulcus after group membership. Given that the parieto-occipital sulcus is an area involved in more complex processing of visual stimuli (e.g., coordinating between ventral and dorsal streams), we suspect that reading acuity is a more complex reading task that recruits higher-order visual areas especially in the left hemisphere, where language functions are lateralized [127, 128]. Therefore, our findings support independent relationships between 1) visual performance and group membership, 2) between group membership and cortical atrophy, and 3) between visual function and cortical atrophy beyond that accounted for by group membership. Although clinical diagnosis is a strong determinant of cortical atrophy, this suggests that individual differences in visual performance (both with reading acuity and contrast sensitivity) additionally predict some of the cortical atrophy patterns we see in visual ROIs across our sample.
While we did not assess any longitudinal data, our findings can be interpreted in a framework consistent with some of the proposed sensory-cognitive hypotheses. Whereas the sensory deprivation hypothesis posits that sensory impairment leads to changes in brain structure, our results instead raise the possibility that neuropathology due to AD contributes to atrophy in vision-related brain regions that affects functional visual performance. Research from our COMPASS-ND team has provided a similar interpretation regarding the association between hearing loss and cortical atrophy: specifically, Giroud et al. (2021) concluded that cortical atrophy as the result of AD contributed to lower speech-in-noise perception observed in AD compared to SCD and MCI groups [16]. Others have hypothesized that pathological changes in peripheral structures (e.g., the retina) [39 , 130] or atrophy in the primary and associative visual cortex are responsible for the low-level psychophysical visual deficits observed in AD individuals, and that poor performance on specific vision measures may elucidate the location and extent of underlying cortical atrophy [39 , 121]. Perhaps then, adequate performance on certain tasks (e.g., contrast sensitivity) requires integrity of the underlying visual areas (e.g., occipital pole) that may be affected by AD pathology. Given that we excluded participants with eye-related diseases or peripheral visual deficits, the relationship between visual function and cortical pathology suggests that the observed visual deficits in the AD group reflect atrophy in vision-related regions and not pathology due to sensory deprivation (i.e., deficits in the retina and/or related visual pathways).
Our findings can also be explained in the context of the common-cause hypothesis, which states that one or more underlying factors contribute to the development of both sensory and cognitive impairment. In line with this hypothesis, our results suggest that cortical atrophy in vision-related brain regions is predicted by both visual performance and group membership. This suggests an interactive link between poor visual performance, diagnostic group membership, and cortical pathology, such that greater cortical atrophy in AD may drive the poor visual functional performance also being observed in AD. Moreover, there may be common underlying factors that are contributing to both poor functional visual performance and cortical atrophy in vision-specific brain regions. Factors that correlate with disease risk and severity (e.g., early- or late-onset of symptoms, health and lifestyle factors, co-morbid diagnoses of conditions such as obesity and diabetes) or dementia neuropathology (e.g., vascular changes) could be considered. For example, studies have demonstrated AD neuropathology (e.g., neurofibrillary tangles, amyloid beta deposits, inflammation) at various levels of the visual pathway (e.g., retina, optic nerve, subcortical regions, cortical regions associated with visual function) [59 , 121], which may contribute to both poor visual function and accelerated cortical atrophy in vision-related brain regions. Moreover, tau and amyloid pathology have been associated with increased neurodegeneration and rates of region-specific cortical atrophy in both cognitively normal older adults and in individuals with MCI and AD (see [137, 138] for examples). Although we excluded participants with eye-related diseases, our study did not assess measures of neuropathology across different levels of the visual system, and our conclusions remain speculative at best until further research is completed.
Limitations
First, although our MCI group had a substantial sample size, we need additional data for our SCD and AD groups so that we can obtain greater statistical power and reduce variability within the sample, especially to understand the relationship between visual performance and cortical volume across both hemispheres. Second, the distribution of sex was skewed in our SCD (80%women) and AD (33%women) groups, although we controlled for this statistically. Nevertheless, the sex distribution in the AD group may not be representative of the general population, especially as AD is more prevalent in women than men [133]. Third, we reduced our sample to those without any age-related eye diseases so that our characterization of visual function was not confounded by visual deficits along the early parts of the visual pathway (e.g., lens, retina, optic nerve). However, this means that our analytic sample does not reflect the initial clinical sample of memory clinic participants who typically have comorbid age-related eye diseases. Moreover, despite our exclusion criteria of self-reported eye diseases, some participants may have had undiagnosed ocular diseases that had not yet been detected through an ophthalmological or optometric examination.
Other shortcomings involve the scope and extent of the measures that were available in the COMPASS-ND dataset. First, it is possible that our particular visual domains of reading acuity and contrast sensitivity may not be sensitive to subtle cortical changes. Moreover, it is important to remember that we only used two visual measures to determine visual function in our participants. Although their relationship with cortical structure in visual-based ROIs remains largely understudied, domains of color vision, depth perception, basic-level visual acuity, or visuospatial processing have all been implicated clinically in AD individuals [38 , 72] and may contribute to stronger associations with atrophy in vision-related areas compared to our visual measures. To obtain a more comprehensive characterization of visual function in our participants, future studies could measure peripheral vision, visual field loss, retinal thickness, or amyloid deposits in the retina. Finally, it would be ideal to access brain imaging data for subcortical regions like the superior colliculus and pulvinar, which have been implicated as pathological structures underlying visual deficits in AD individuals [121, 134]. This will be helpful in assessing the mechanisms and extent to which both cortical and retinal (e.g., degeneration of visual pathways, the optic nerve) pathology contribute to behavioral visual deficits in AD.
There are other caveats in our study that may have contributed to our failure to detect associations between vision and cortical changes. First, we limited our assessment of brain structure to gray matter volume (a combined product of both cortical thickness and surface area) as it is strongly associated with age-related changes in the brain and is a biomarker for neurodegenerative processes [114]. However, there may still be associations between vision and cortical structure of vision-related brain regions that were not detectable in gray matter volume. Also, most of the participants had normal visual function across both measures; therefore, we would not necessarily expect to see a strong association with cortical atrophy (and perhaps only or mostly in individuals who have moderate or greater visual impairment) [73 –76]. Moreover, we could investigate neural responses using functional imaging techniques for a comprehensive assessment of cortical mechanisms that contribute to visual dysfunction in AD [135]. Finally, our study only assessed cross-sectional data. In order to evaluate possible sensory-cognitive mechanisms and understand the nature of the relationship between visual performance, diagnostic group membership, and cortical atrophy, longitudinal data are needed (and are currently being collected in the COMPASS-ND study).
Implications
In our study, we found that visual performance differed between older adults with (or at risk for) AD and correlated with cortical volume above and beyond group membership. Although our data extend previous sensory-cognitive findings on poor visual performance in individuals with AD, we are the first to characterize visual function for all three diagnostic groups with varying clinical pathology in a large sample of older adults with (or at risk for) AD. Given that we found deficits in visual performance in the AD group compared to the SCD and MCI groups, our research supports efforts of targeting and optimizing visual function (e.g., through regular ophthalmological assessments) in groups with (or at risk for) AD. Future studies will be helpful in clarifying if specific visual measures (e.g., contrast sensitivity) are useful as potential early functional markers for early MCI or AD.
To our knowledge, our study is also the first to explore and find associations between visual impairment and cortical atrophy in clinical groups with (or at risk for) AD. We found that visual performance predicted cortical atrophy in some ROIs beyond that accounted for by group membership. Moreover, despite a consensus that sensory areas are traditionally spared in AD, we found reduced cortical volume in the AD group in multiple vision-related ROIs. Future research should determine if psychophysical visual deficits are attributable to structural atrophy in visual processing areas as a consequence of AD pathogenesis, independent of visual changes at the level of the eye. Moreover, with additional longitudinal data from the COMPASS-ND dataset, we can evaluate the proposed mechanisms underlying sensory-cognitive associations (e.g., the common-cause and sensory deprivation hypotheses). These data will facilitate exploration and understanding of the temporal nature and potential causal mechanisms of the vision-brain relationship in populations with varying degrees of cognitive function, allowing us to delineate stronger conclusions about the associations between visual impairment, cognitive decline, and cortical atrophy.
Footnotes
ACKNOWLEDGMENTS
This research was supported by an infrastructure and operating grant to the CCNA from the Canadian Institutes of Health Research (CIHR) (Grant no. CNA-137794). This grant supports the COMPASS- ND study and the work of CCNA Team 17 principal investigators and trainees. SR was supported by a Frederick Banting and Charles Best Canada Graduate Scholarship –Master’s (CGS-M) award from CIHR and a graduate-level stipend from the Centre for Research on Brain, Language, and Music (CRBLM). WW is supported by an FRQS Chercheur Boursier Junior 2 Career Award (#281454). We gratefully acknowledge the important contributions of the COMPASS-ND PIT team, especially Victor Whitehead, in facilitating access to the COMPASS-ND data. Feedback and constructive advice were provided for this project by Dr. Aaron Johnson and Dr. Chris Steele. We are grateful to Samantha Bishundayal, Tristin Best, and the Phillips CAP Lab for their contributions.