
Abstract
Background:
Reduced kidney function has been associated with cognitive decline. Most studies have examined a single marker of kidney function and have limited duration of follow-up.
Objective:
This study evaluated associations between markers of kidney function (urine albumin, estimated glomerular filtration rate [eGFR], and hyperuricemia) with cognitive performance over time.
Methods:
This is a longitudinal study of 1,634 community-dwelling adults (mean age = 71.7 years), with kidney function markers and cognitive ability measured at baseline (1992–1996) and at up to five additional time points with a maximum of 23.4 years (mean = 8.1 years) of follow-up. Associations between kidney function and cognitive performance were assessed using linear mixed effects models. Testing for interaction by sex was conducted.
Results:
Albuminuria (urine albumin-to-creatinine ratio [ACR]≥30 mg/g) was associated with steeper annual declines in global cognitive function (MMSE, β= –0.12, p = 0.003), executive function (Trails B, β= 4.50, p < 0.0001) and episodic memory (Buschke total recall, β= –0.62, p = 0.02) scores in men. Results were similar when cognitive test scores were regressed on latent trajectory classes of ACR. In men, hyperuricemia (serum uric acid [SUA]≥6.8 mg/dl for men and SUA≥6.0 mg/dl for women) was associated with lower baseline MMSE (β= –0.70, p = 0.009) scores but not with MMSE change over time. No such associations were detected in women. There were no significant associations between eGFR and cognitive performance for either sex.
Conclusion:
In older men, albuminuria is an independent predictor of subsequent cognitive decline. More investigations are needed to explain the observed sex differences and the potential relationship between hyperuricemia and poorer global cognition.
INTRODUCTION
In the face of an aging global population, the prevalence of dementia continues to increase and is projected to affect over 135 million people worldwide by 2050 [1]. Given the lack of effective interventions and or therapies, it remains a public health imperative to identify and control potential risk factors for the development of Alzheimer’s disease and other dementias. One such factor is chronic kidney disease (CKD). CKD, or reduced kidney function defined as an estimated glomerular filtration rate (eGFR) < 60 ml/min/1.73 m2 and/or kidney damage defined as a urine albumin-to-creatinine (ACR)≥30 mg/g currently affects an estimated 15%of US adults [2], and this prevalence is expected to rise as the population ages [3]. This is particularly alarming, as CKD is associated with cardiovascular disease, stroke, and increased risk of mortality [4]. Moreover, individuals with CKD are at increased risk of cognitive impairment with the prevalence rate ranging from 30–70%in those with stage 5 CKD [5]. Evidence from population-based studies suggest that mild-to-moderate loss of kidney function may also be associated with worse cognitive function [6, 7].
eGFR, a widely used measure of kidney function, has been associated with cognitive impairment and dementia [6, 7]. Similar associations have also been observed between albuminuria, a marker of kidney damage, and cognitive decline [9]. In a previous analysis of participants of the Rancho Bernardo Study of Healthy Aging, we found an association between albuminuria measured at a single time point and change in cognitive function over a 7-year period [8]. However, our prior study and some past studies did not detect a significant association between kidney function as measured by eGFR and subsequent changes in cognition [10, 11]. It should also be noted that the majority of these studies only examined a single measurement of kidney function. Repeated measures may be necessary to fully characterize this association as the rate of renal decline may provide a better indicator of risk than one static measure. Furthermore, the majority of these studies have a limited duration of follow-up or lack information on multiple domains of cognitive function [9, 12]. Serum uric acid (SUA) levels are influenced by multiple factors including genetics, diet, medication use, as well as kidney dysfunction [13]. SUA is commonly elevated in those with CKD and is associated with an increased risk of CKD progression [14]. Counterintuitively, SUA has been positively associated with cognitive function in prior case-control and cross-sectional studies [15, 16]. However, the degree to which this association is influenced by unmeasured confounding or the problem of reverse causation remains unknown.
The objective of this study was to investigate the association between three markers of kidney function and longitudinal trajectories of cognitive performance using data from the Rancho Bernardo Study of Healthy Aging [17]. In contrast to prior studies, we were able to examine kidney function markers at multiple time points in participants with repeated cognitive assessments over an extended follow-up of up to 24 years.
MATERIALS AND METHODS
Study participants
The Rancho Bernardo Study (RBS) of Healthy Aging is a longitudinal cohort study established in 1972–1974 when 82%(n = 6, 339) of residents aged 30 and older, from the San Diego, CA suburb of Rancho Bernardo, were enrolled in a study of heart disease risk factors [17]. Participants were predominantly white (99.4%), well educated, and middle to upper-middle class adults. In 1992–1996, 1,781 RBS men and women participated in a follow-up clinic visit in which kidney function markers were measured and cognitive function was assessed. Participants were excluded if they were less than 50 years of age at the 1992–1996 visit (n = 49), had missing kidney function marker measures (n = 30), no available cognitive function scores (n = 50) or lacked information about educational attainment (n = 18), yielding a final sample size of 1,634 participants. This study was conducted in compliance with the Declaration of Helsinki and approved by the University of California San Diego Institutional Review Board. All participants provided written informed consent prior to participation at each visit.
Exposure measures
Measurements of serum creatinine, urine albumin, and urine creatinine were collected at the baseline 1992–96 visit and at three subsequent visits until 2003–2006. SUA was measured in 98%of the participants at baseline and, in a subset of participants (n = 515), at the 1997–1999 clinic visit. A timeline of the data collection for the kidney function markers and cognitive tests used in this study is shown in Fig. 1. At each clinic visit, blood samples were collected after a requested overnight fast, and a single, clean-catch, untimed morning urine sample was collected. Urine albumin and creatinine were measured at the National Institutes of Health laboratory of Dr. Peter Bennett (Phoenix, AZ). Urine albumin was measured using the Behring Nephelometer BNA (Dade Behring GmbH, Marburg, Germany). The lower limit of detection of the assay was 6.8 mg/L; values < 6.8 mg/L were assigned a value of 6.7 mg/L. The interassay coefficient of variation was 4.5%. Urine creatinine was measured by the kinetic alkaline picrate method using the Ciba-Corning Express (Corning, Medfield, MA). SUA and serum creatinine were measured by SmithKline Beecham Clinical Laboratories (King of Prussia, PA). Serum creatinine was determined by the Jaffe reaction method, and SUA was measured using the phosphotungstate method. Serum creatinine was indirectly calibrated to the Cleveland Clinic Laboratory by using RBS and NHANES III data [18] and performing a linear regression of data combining the two studies adjusting for age and sex. The visit specific parameter estimates for the RBS versus NHANES III study were then subtracted from the raw serum creatinine values. eGFR was calculated using the CKD-EPI method using calibrated serum creatinine, age, race, and sex [19]. Urine albumin to creatinine ratio (ACR) was calculated as follows: ACR (mg/g) = Urine albumin (mg/dL)/Urine creatinine (g/dL). Albuminuria was defined as ACR≥30 mg/g in line with Kidney Disease: Improving Global Outcomes (KDIGO) guidelines [20]. Hyperuricemia was defined as SUA≥6.8 mg/dl for men and SUA≥6.0 mg/dl for women as done in previous studies [21, 22].

Timeline of kidney function marker and cognitive performance measurements used in baseline measure only and group-based marker trajectory analyses. The sample size reflects the number of remaining study participants at the corresponding visit. ACR, albumin-creatinine ratio; eGFR, estimated glomerular filtration rate; SUA, serum uric acid.
Cognitive function
Cognitive function was assessed at the 1992–1996 research clinic visit and at five subsequent visits at approximate four-year intervals thereafter, with the most recent cognitive assessment occurring between 2014–2016. A battery of standardized neuropsychological tests assessing global cognitive function (the Mini-Mental State Exam (MMSE) [23]), executive function and psychomotor processing speed (the Trail-Making Test Part B (“Trails B”) of the Halsted Reitan Battery [24]), and verbal semantic fluency [25] (category fluency, assessed by number of unique animals named in one minute) were administered at each of these visits. A measure of verbal episodic memory, the total recall score from the Buschke Selective Reminding Task (“Buschke total recall”) [26] was administered at 4 visits; it was not given at the 1992–1996 baseline visit or the 2007–2009 research visits due to time constraints. We created a retest effect variable defined as zero on the participant’s first cognitive assessment and one on all following assessments.
Covariate assessment
Lifestyle information including smoking, alcohol consumption, and exercise (≥3 times/week) were acquired through standard questionnaires at the 1992–1996 baseline visit. Height and weight were measured using a regularly calibrated stadiometer and balance-beam scale with participants in light clothing and no shoes. Body mass index (BMI) was calculated as: weight (kg)/(height (m)2). Blood pressure was recorded by a trained nurse according to the Hypertension Detection and Follow-up Program protocol [27] as the mean of two readings obtained 5 min apart while the participant was in a rested, seated position. Current use of antihypertensive, antihyperuricemic, and antidiabetic medications was obtained by questionnaire. Hypertension was defined as systolic blood pressure≥140 mmHg or diastolic blood pressure≥90 mmHg or use of antihypertensive medications. Diabetes status was based on the following criteria: Fasting plasma glucose > 126 mg/dL, 2 h post-challenge plasma glucose > 200 mg/dL, use of diabetes medications, or self-reported physician diagnosis. Total lean body mass (kg) was obtained using dual-energy x-ray absorptiometry (DEXA) of the total body.
Statistical analysis
Descriptive statistics were calculated for baseline variables including the frequency and percent for categorical variables and the mean and standard deviation (SD) or median and interquartile range (IQR) for normally or non-normally distributed continuous variables, respectively. Differences in covariates by measures of kidney function were assessed by chi-square analysis and ANOVAs as appropriate. To account for correlation between kidney function and aging, reported p-values have been adjusted for baseline age.
Group-based trajectory analyses using latent class mixture models are utilized to identify distinct groups within the population representing different patterns of change of a measurement over time [28]. Individuals are classified to a group using the estimated posterior probabilities of membership. This method allows for missing data, irregular spacing of measurements and can incorporate both time-stable and time-dependent predictors. In addition, different functional forms of the trajectories (linear, quadratic, etc.) can be modeled. eGFR and log transformed ACR trajectories over 10 years were modeled as a function of time using the Proc Traj procedure in SAS. eGFR and ACR were adjusted for age by performing a linear regression of each kidney function marker on age at the time of measurement and adding the residuals to the marker mean prior to trajectory estimation. We followed a two-step procedure of model selection as previously suggested [29]. With all groups set to a second order polynomial (quadratic), we tested the fit of one to five groups using the CNORM distribution. The model with the lowest Bayesian Information Criterion (BIC), while also maintaining a minimum trajectory group size of at least 5%, was used to determine the number of distinct groups. Quadratic and linear forms were then tested and retained in the model when significant at the α= 0.05 level. Model adequacy was also evaluated by ensuring an average posterior probability value > 0.7 for each group. This analysis was limited to individuals with at least two serum creatinine or ACR measurements (n = 1,227, mean = 3.2 measurements and n = 1,246, mean = 3.1 measurements; respectively). As SUA was measured only twice in a limited number of individuals, SUA trajectories were not estimated.
Linear mixed effects models were used to assess the associations of baseline eGFR, ACR and SUA and marker trajectories on longitudinal changes in test scores for the various cognitive domains. This statistical approach accommodates missing data, inconsistent measurement intervals and accounts for within-subject correlation between repeated measures. Models include random intercept and time (years since baseline) effects, which allows individual subject baseline levels and slopes to vary randomly about the mean trajectory defined by the fixed effects. To account for potential retest effects, we regressed each cognitive test on the respective retest effect variable and added the residuals to the test mean before subsequent analyses.
Beta estimates and 95%confidence intervals were estimated adjusting for factors that have been previously related to both the kidney function markers and cognitive function [30–32] in 1) a minimally adjusted model including time, time squared, baseline age (years), sex, and education (< 12 years, 12 years, 13–15 years, 16 years, or≥17 years); 2) a fully adjusted model adding adjustment for potentially confounding lifestyle behaviors including smoking (never/current/former), exercise (≥3 times/week; yes/no), and alcohol consumption (daily alcohol intake; yes/no), and health-related factors including BMI, hypertension (yes/no), diabetes (yes/no), history of stroke (yes/no), history of heart attack (yes/no), antihyperuricemic medication use (yes/no), and lipid-lowering medication use (yes/no). A time by kidney function marker interaction term was included in all models to assess the influence of each marker on changes in cognitive function over time. Sex interactions were assessed by introducing two-way sex by marker terms and three-way sex by marker by time terms in the models. Interactions with a likelihood-ratio-test p-value < 0.05 were considered significant. Due to the presence of significant sex by marker interactions analyses were carried out and reported stratified by sex.
To account for multiple testing, we used the PROC MULTTEST procedure in SAS to calculate q-values, which are adjusted p-values controlling for the false discovery rate [33]. A q-value < 0.05 was considered statistically significant. All analyses were carried out using SAS 9.4 (SAS Institute Inc., Cary, NC, USA).
Sensitivity analyses
Individuals with decreased renal function may be at higher risk of death or dropout due to poor health (e.g., end-stage renal disease or cardiovascular disease) precluding the event of interest. Assuming these individuals were at increased risk of cognitive impairment, death and dropout would be competing events, which could lead to biased risk estimates. Sensitivity analyses were performed via a joint model framework that incorporates informative dropout and death into a mixed model using the %SPM SAS macro [34]. The influence of diabetes and stroke on our results was examined by repeating analysis after excluding individuals with diabetes or a history of stroke at baseline. To address the potential confounding effects of muscle mass on serum creatinine, the full models were also repeated with additional adjustment for total lean body mass in the subset of individuals with this measure (n = 1515). Associations between SUA and cognitive function were additionally adjusted for diuretic use and high-purine food intake to account for the influence of these factors on SUA concentrations. High-purine food intake was defined as the average number of daily servings of meat (beef, poultry, beef liver, chicken liver, bacon, hotdogs and other processed meats) and seafood (fish and shrimp) according to the 153-item Willet Food Frequency Questionnaire (FFQ) [35] administered during the 1992–1996 research clinic visit. Analyses were also conducted using ACR≥25 mg/g for men and ACR≥30 mg/g for women (to reflect a higher urine creatinine excretion in men than in women) [36].
RESULTS
Participant characteristics
Study participants had a mean age of 71.7 years (SD = 10.6) at the baseline (1992–1996) visit and an average follow-up of 8.1 (SD = 6.6) years (maximum 23.4 years). Participant characteristics are presented by sex (Supplementary Table 1), by albuminuria (Table 1), by hyperuricemia (Supplementary Table 2), and by eGFR < 60 (Supplementary Table 3). Albuminuria was evident in 12%(n = 201) of participants. Almost 20%of the study population had an eGFR < 60 ml/min; however, only 4.8%of participants had an eGFR < 45 ml/min (n = 79). There were no participants with eGFR < 15 ml/min. Mean serum uric acid levels were higher in men compared to women (mean±SD = 5.45±1.32 mg/dl and 4.36±1.37 mg/dl, respectively; p < 0.001); wher-eas eGFR levels were similar between women and men (mean±SD = 73.83±16.94 mg/dl and 74.35±15.86 mg/dl, respectively; p = 0.59) (Supplementary Table 1). Women had a higher median ACR compared to men (median, interquartile range (IQR) = 13.40, 13.55 mg/g versus 8.93, 12.14 mg/g; p = 0.001), however the frequency of albuminuria (ACR≥30 mg/g) was similar in men and women (13.1%and 11.8%; p = 0.40) (Supplementary Table 1). Participants with albuminuria, hyperuricemia and eGFR < 60 ml/min tended to be older and more likely to have hypertension (p-values≤0.001) with the exception that there was little difference in age in men with or without hyperuricemia (p = 0.12). Albuminuria was associated with a higher likelihood of being diabetic (p < 0.01) as was hyperuricemia, but only in women (p = 0.003).
Baseline (1992–1996) characteristics of participants according to urine albumin-creatinine ratio; the Rancho Bernardo Study (n = 1,634)
ACR, albumin-creatinine ratio; BMI, Body Mass Index; DBP, diastolic blood pressure; eGFR, estimated glomerular filtration rate; HDL-C, HDL-cholesterol; LDL-C, LDL-cholesterol; SBP, systolic blood pressure; SUA, serum uric acid. Albuminuria defined as ACR < 30mg/g. Values are shown as n (%) for categorical variables and mean (SD) for continuous variables. aMedian and interquartile range.
Albuminuria and cognitive function
Sex-specific beta-estimates and standard deviations (SD) for the main and slope effects from the longitudinal mixed-effects analyses of baseline albuminuria and cognitive function are shown in Table 2; no albuminuria is the reference level for all analyses. The main effects indicate baseline differences according to albuminuria status, and the albuminuria by time interaction estimates the slope of cognitive change over time by albuminuria status. We detected a significant interaction between albuminuria and sex for cognitive trajectories in Trails B (p = 0.01), such that associations with albuminuria were evident in men, but not women. In sex-specific analyses, there were no significant main or interaction effects of albuminuria on cognitive test performance in women (p-values≥0.13). The modeled trajectories of each cognitive test over time as a function of albuminuria status in men are shown in Fig. 2. As demonstrated by beta estimates of the time by albuminuria interaction terms in minimally adjusted models, albuminuria was significantly associated with more rapid declines in performance on the MMSE, Trails B, and Buschke total recall tests in men only (p = 0.003; p < 0.0001; p = 0.02, respectively). The magnitude and significance of these declines were similar after additional adjustment for lifestyle and health related variables. After controlling for the false discovery rate the association between albuminuria and decline in Buschke total recall score in men was significant in fully adjusted models only (p = 0.01; q = 0.04; p for sex interaction = 0.045). Men with albuminuria had larger estimated declines in the category fluency test, but these associations were not statistically significant (p = 0.06, q = 0.08) in fully adjusted models. Results were similar when a sex-specific cutoff for ACR was used to define albuminuria (Supplementary Table 4).
Results of the longitudinal mixed-effects analyses of baseline albuminuria with cognitive function; the Rancho Bernardo Study (n = 1,634)
MMSE, Mini-Mental State Examination; Trails B, Trail-Making Test B. “Albuminuria” term represents the association between albuminuria and cognitive test performance at baseline. “Time x albuminuria” term represents the association between albuminuria on the rate of change in cognitive test performance. Albuminuria was defined as ACR≥30 mg/g. Minimal models (Min): Adjusted for baseline age, time2, and education. Full models (Full): Added adjustment for BMI, smoking, daily alcohol intake, exercise 3 or more times per week, hypertension, diabetes, stroke, antihyperuricemic medication use, and lipid-lowering medication use. bq-value < 0.05.
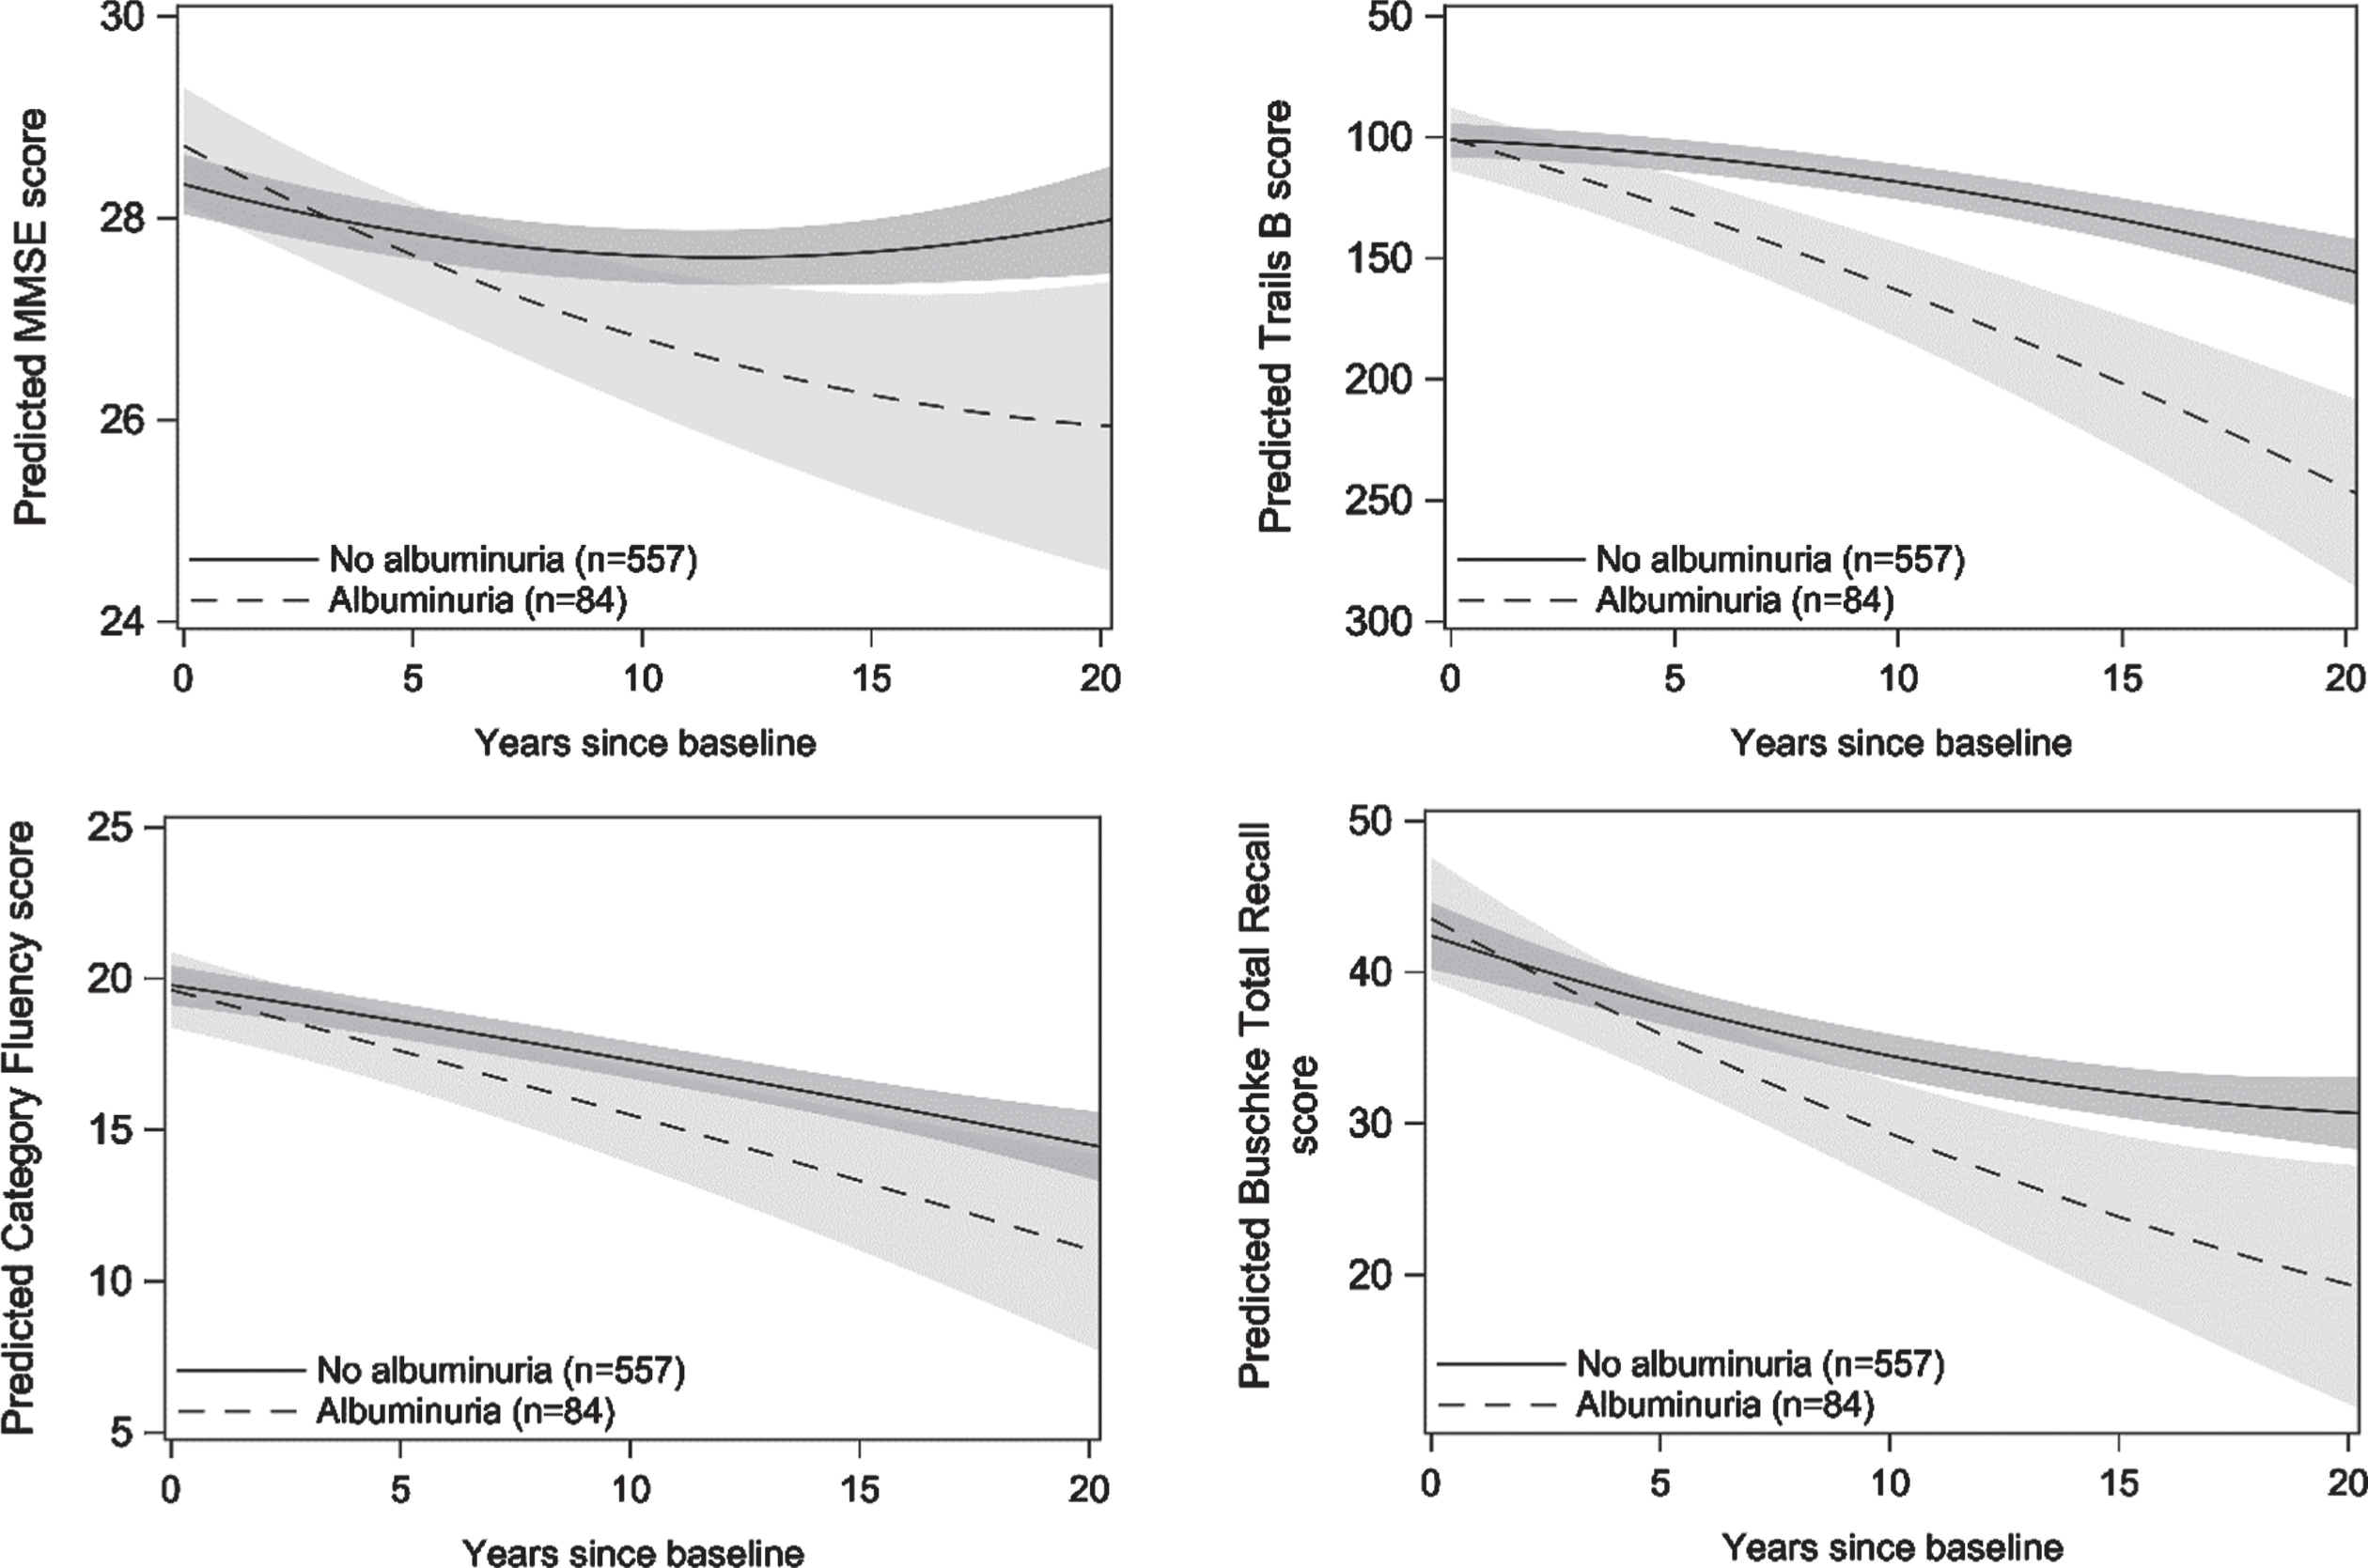
Modeled trajectories of cognitive test performance over time as a function of albuminuria status in men. Plots are based on model coefficients using group-specific mean values for covariates: age and education. The axis for Trails B is reversed so that downward sloping lines indicate decreasing performance. Trajectories are plotted to 20 years follow-up time, the 95th percentile of follow-up time for the study population.
In our latent class mixture model analysis of repeated log ACR measurements, the best fit to the data was obtained with two latent classes in both men and women (Supplementary Figures 1 and 2). Class 1 was considered the low ACR group (median, IQR = 5.08, 5.55 in women; 4.69, 5.56 in men), and class 2 was considered the high ACR group (median, IQR = 30.60, 63.65 in women; 66.58, 129.74 in men). Results of the mixed model analyses with log ACR latent classes were consistent with those using predefined cut points for albuminuria showing larger declines in cognitive performance for men in the high versus low ACR class and no significant differences among women (Supplementary Table 5).
Hyperuricemia and cognitive function
There were no significant associations between hyperuricemia and longitudinal performance on any cognitive tests (p-values≥0.11; Table 3) in either sex. We detected a significant interaction between the main effect of hyperuricemia and sex (p = 0.001 in fully adjusted models). In men only, hyperuricemia was associated with lower baseline MMSE scores in minimally and fully adjusted models (β= –0.70, p = 0.009 and β= –0.84, p = 0.002, respectively). The magnitude of this association was slightly larger with additional adjustment for diuretic use and high-purine food intake (–0.95, p = 0.002). Associations between Modeled trajectories of MMSE score according to hyperuricemia status in men are shown in Fig. 2. Hyperuricemia was not associated with baseline scores of Trails B, category fluency, or Buschke total recall (p-values≥0.11) in either sex.
Results of the longitudinal mixed-effects analyses of baseline hyperuricemia status with cognitive function; the Rancho Bernardo Study (n = 1,634)
MMSE, Mini-Mental State Examination; Trails B, Trail-Making Test B. “Hyperuricemia” term represents the association between hyperuricemia and cognitive test performance at baseline. “Time × hyperuricemia” term represents the association between hyperuricemia on the rate of change in cognitive test performance. Hyperuricemia was defined as SUA≥6.8 mg/dl for men and SUA≥6.0 mg/dl for women. Minimal models (Min): Adjusted for baseline age, time2, and education. Full models (Full): Added adjustment for BMI, smoking, daily alcohol intake, exercise 3 or more times per week, hypertension, diabetes, stroke, antihyperuricemic medication use, and lipid-lowering medication use. bq-value < 0.05.
eGFR and cognitive function
We found no significant main or time interac-tive effects of eGFR < 60 status and cognitive performance on any tests (p-values ≥ 0.10; Supplementary Table 6) for either sex. Analysis using latent class mixture models in the subsets of men and women with two or more eGFR measurements, revealed three latent classes within the data (Supplementary Figures 3 and 4). Class 1 was considered the low eGFR group (mean, SD = 57.43, 13.35 in women; 61.12, 13.60 in men), class 2 the intermediate eGFR group (mean, SD = 71.55, 11.91 in women; 75.68, 11.58 in men), and class 3 the high eGFR group (mean, SD = 86.86, 11.22 in women; 87.82, 11.22 in men). We found no significant differences in cognitive performance on any tests according to eGFR trajectory patterns (Supplementary Table 6).
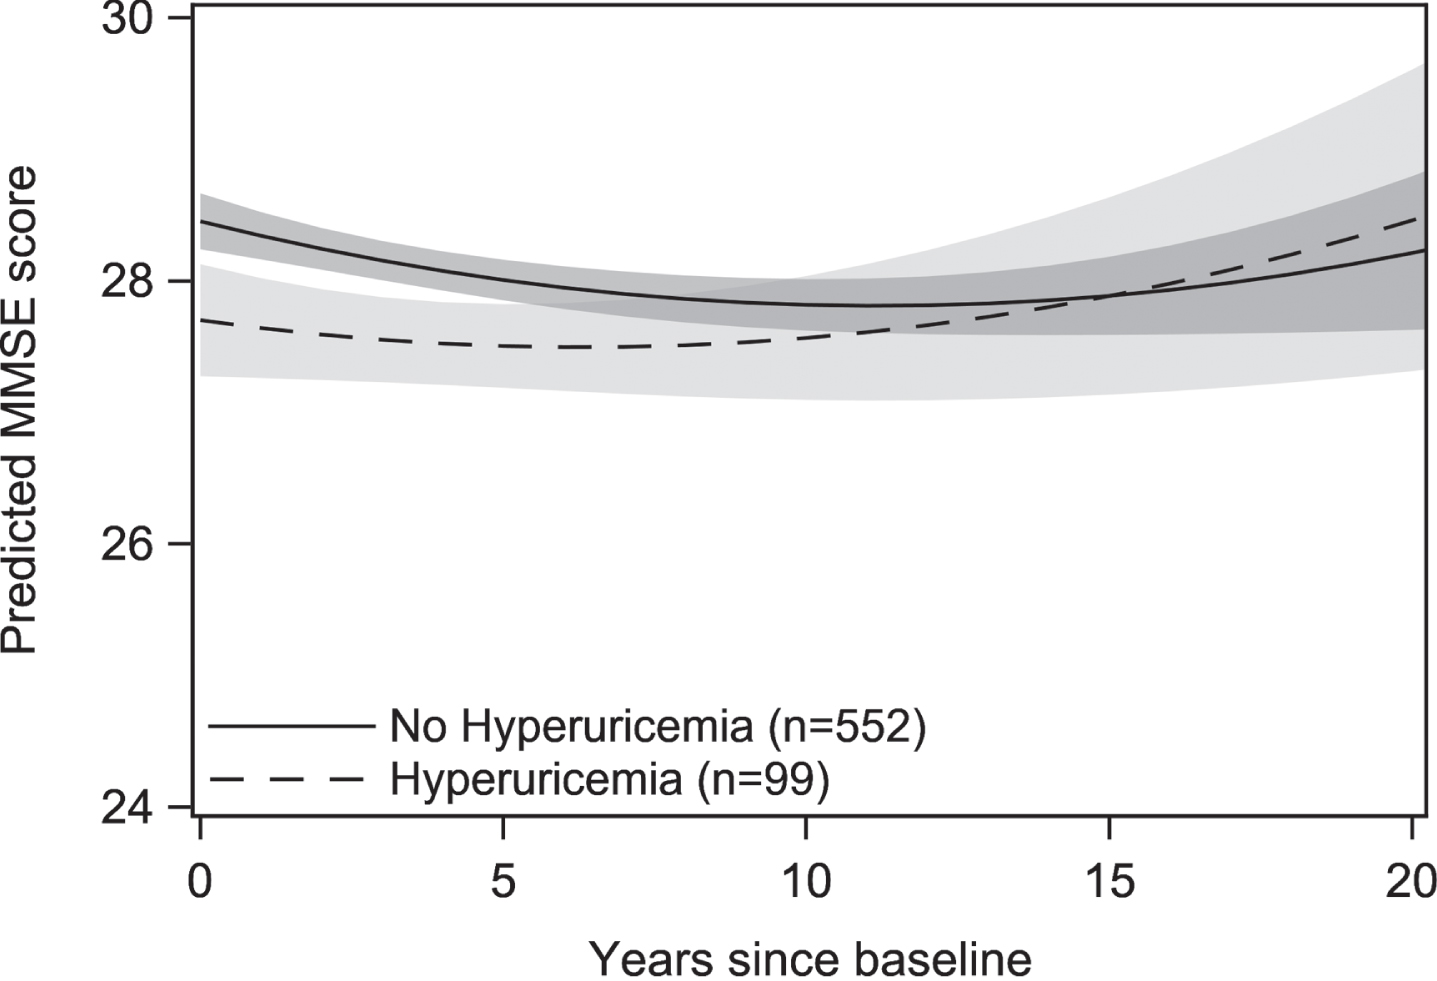
Modeled trajectories of MMSE performance over time as a function of hyperuricemia status in men. Plots are based on model coefficients using group-specific mean values for covariates: age and education. Trajectories are plotted to 20 years follow-up time, the 95th percentile of follow-up time for the study population.
Sensitivity analyses
The results were consistent in joint models that accounted for informative death or dropout (Supplementary Tables 8–10). Parameter estimates were essentially unchanged when individuals with diabetes were not included in the analyses (data not shown). However, when those with a history of stroke were excluded the association between hyperuricemia and overall MMSE score in men was attenuated but remained significant (β= –0.56, p = 0.03). The addition of lean muscle mass to the models did not substantially change results. Among women, results were similar after controlling for the current use of estrogen replacement therapy (data not shown).
DISCUSSION
In this study, albuminuria, an early predictor of kidney disease, was associated with faster cognitive decline across multiple domains among men in a community-dwelling cohort followed for up to 24 years. Similar results were found in men when a latent class trajectory approach was used to characterize change in albumin-creatinine ratios over time. In men only, hyperuricemia was related to poor overall performance in global cognitive function but was not significantly associated with longitudinal decline in cognitive performance on any test. These associations persisted after accounting for health and lifestyle factors. We found no significant associations between eGFR level and cognitive performance over time. No significant associations between kidney function markers and cognitive performance were observed in women.
Our results build upon an earlier analysis of this cohort (n = 759) that related albuminuria to a greater change in global cognitive function and executive function over a mean 6.6 year period in men only [8]. Through linear mixed modeling, which allows accommodation of missing data and measures at uneven time points, we were able to employ a substantially larger sample size and describe this association over an expanded follow-up period. In addition, we found associations between albuminuria and a measure of episodic memory which was not previously examined. These results are in agreement with prior prospective studies suggesting increased albuminuria is associated with poor cognitive performance [37–39]. Previous studies were limited to one or two cognitive assessments. To our knowledge, this study has the longest continued cognitive follow-up to date with up to 6 assessments. In addition, our work benefits from inclusion of multiple cognitive tests which allowed us to examine differences across several cognitive domains.
Albuminuria has been linked with cerebral small vessel disease, which is a major contributor to both vascular and mixed-type dementia and may also be a risk factor for Alzheimer’s disease [40]. Imaging studies suggest patients with albuminuria have higher frequency of lacunar infarcts, white matter hyperintensities, microbleeds, and enlarged perivascular spaces, independent of a history of hypertension, diabetes, or known stroke [41]. Although stroke and heart attack history and cardiovascular risk factors at baseline were accounted for in our analysis, unmeasured subclinical microvascular dysfunction may have also played a role. It remains unclear whether albuminuria directly impacts brain function or if this association solely reflects a shared risk factor model through which vascular dysfunction affects the kidney and the brain independently. Further study is necessary to evaluate the potential causal relationship of albuminuria and cognitive decline.
eGFR level was not related to any measure of cognitive function in this study. The association between reduced eGFR and cognitive ability in prospective studies is mixed with the majority of studies reporting a negative [6, 42] or null association [37, 43]. In the present study, the prevalence of CKD disease (stages 3b or higher) at baseline was somewhat modest at less than 4.8%. This may have precluded our ability to detect cognitive declines associated with more severe loss of kidney function. Furthermore, given both the strong correlation between eGFR and age and the steep acceleration of cognitive decline at advanced ages, mild or moderate kidney impairment may be a less informative predictor of cognitive ability in older individuals.
Our study is one of few that have examined the association of repeated measures of kidney function markers and cognitive performance [42, 44]. While we did not find any significant differences in cognitive ability by eGFR trajectory, we did observe steeper declines in cognitive function in men with higher baseline log ACR values over time. However, the ACR trajectories did not explain more variation in longitudinal cognitive performance than the baseline measure of albuminuria alone. Nonetheless, it should be noted that we were able to identify individuals at increased risk of cognitive decline independently of a priori cut points suggesting that latent trajectory modelling is an effective method of identifying groups of individuals with different risk profiles. We did not detect groups with a dynamic increase in ACR in the present analysis which may be a consequence of the relatively older mean age of the study sample. A recent study employed similar methodology to explore 20-year trajectories of ACR from young adulthood and myocardial structure using data from the CARDIA cohort study [45]. The CARDIA study results suggest that ACR trajectories may diverge earlier in the life course, within an age range that was not captured in the current sample.
The biological basis of the observed sex differences is unknown but may be related to variation in the specific etiologies of cognitive impairment unique to men and women. Indeed, men have been shown to have higher rates of vascular dementia compared to women [46, 47]. It may be possible that in the presence of albuminuria, men have a higher underlying susceptibility to accelerated microvascular dysfunction than women. In support of this, a study of patients with type II diabetes revealed that men with albuminuria were more likely than women to have evidence of ischemic heart disease [48]. In addition, progression of micro to macroalbuminuria is more likely to occur in men than women [49], suggesting that microalbuminuria may impose a greater sustained risk of downstream microvascular damage in men. It is unlikely that differences in exercise habits and muscle mass account for the apparent sex differences, since controlling for both did not change our results.
The literature describing the association between serum uric acid and cognitive function has likewise been inconsistent. Our finding that men with hyperuricemia have worse baseline global cognitive function than men with normal serum uric acid levels is consistent with previous studies that linked higher serum uric acid levels to decreased cognitive ability [50–52]. In a longitudinal study of older community-dwelling adults, Latourte et al. found a significant association between increased SUA level and the risk of incident dementia [51]. Interestingly, after adjustment for stroke the association with vascular or mixed-type dementia was no longer significant. In our study, the association between hyperuricemia and MMSE was substantially attenuated after participants with a history of stoke were excluded. Taken together these results suggest a possible mediating association of cerebrovascular disease in the causal pathway. This is further supported by studies that reported a higher risk of cerebrovascular disease with increased levels of SUA [52, 53]. It is unclear why this association was observed only in men. However, these results are consistent with a small study carried out by Lin et al. that detected lower cognitive test performance and spontaneous brain activity with pre-hyperuricemia and hyperuricemia in men only [54]. In contrast to our results, some observational studies have reported an inverse association between SUA levels and cognitive impairment or Alzheimer’s disease [16, 55]. A mendelian randomization study found no clinically relevant evidence for a causal association between serum uric acid levels and Alzheimer’s disease [56] suggesting that the observed associations may be a result of residual confounding or reverse causation.
There are some limitations to this work. The characteristics of the RBS cohort, which is predominantly white, middle class and well educated, may restrict generalizability to other populations. However, the relative homogeneity of participants may help preserve the internal validity of our results by avoiding potential confounding effects of socioeconomic status, education, and health care access. Furthermore, the baseline age of the study sample (mean = 71.7 years) limited our ability to detect changes in markers of kidney function occurring at an earlier age. It should also be noted that although the MMSE is effective in detecting dementia, we lacked a highly sensitive measure of mild cognitive impairment. This may lead to difficulty in interpreting the clinical significance of these results, however the magnitudes of the differences appear to be relevant. For example, in men, the yearly effect of albuminuria on the rate of decline in MMSE, Trails B, and Buschke total recall test scores was roughly equivalent to an additional 1.2 years of age. There are also several strengths to our study. The comprehensive data collected on the RBS cohort allowed for the adjustment of several potential lifestyle and health-related confounders including DEXA-based lean body mass. In addition, we investigated repeated measures of both kidney function exposures and cognitive performance over time. Finally, this study leverages one of the longest cognitive follow-up periods (24 years) to date and includes assessments of multiple cognitive domains.
In conclusion, we found significant associations between albuminuria and decline in multiple cognitive domains in men but not women. Men with high serum uric acid also performed more poorly on a test of global cognitive function. Kidney function as measured by eGFR was not associated with cognitive ability in this study. The results of the current study, along with prior findings on the association of albuminuria with cerebral small vessel disease, suggest that albuminuria may serve as a clinically relevant, noninvasive marker of microvascular dysfunction in both the kidney and the brain, particularly among men.
Footnotes
ACKNOWLEDGMENTS
This work was supported by grants from the National Institutes of Health (NIH). Data collection for the Rancho Bernardo Study of Healthy Aging was provided primarily by the NIH (grant numbers HV012160, AA021187, AG028507, AG007181, DK31801, HL034591, HS06726, and HL089622). Archiving and sharing of RBS data was supported by the NIH (grant number AG054067). Some study data were collected and managed using REDCap (Research Electronic Data Capture) electronic data capture tools hosted at University of California San Diego and supported by a grant from the NIH (grant number UL1TR001442). RBS data is available at ![]() .
.