
Abstract
Background:
Individuals at 80 years of age or above with exceptional memory are considered SuperAgers (SA), an operationalized definition of successful cognitive aging. SA showed increased thickness and altered functional connectivity in the anterior cingulate cortex as a neurobiological signature. However, their metabolic alterations are yet to be uncovered.
Objective:
Herein, a metabolic (FDG-PET), amyloid (PIB-PET), and functional (fMRI) analysis of SA were conducted.
Methods:
Ten SA, ten age-matched older adults (C80), and ten cognitively normal middle-aged (C50) adults underwent cognitive testing and multimodal neuroimaging examinations. Anterior and posterior regions of the cingulate cortex and hippocampal areas were primarily examined, then subregions of anterior cingulate were segregated.
Results:
The SA group showed increased metabolic activity in the left and right subgenual anterior cingulate cortex (sACC, p < 0.005 corrected, bilateral) and bilateral hippocampi (right: p < 0.0005 and left: p < 0.005, both corrected) as compared to that in the C80 group. Amyloid deposition was above threshold in 30% of SA and C80 (p > 0.05). The SA group also presented decreased connectivity between right sACC and posterior cingulate (p < 0.005, corrected) as compared to that of the C80 group.
Conclusion:
These results support the key role of sACC and hippocampus in SA, even in the presence of amyloid deposition. It also suggests that sACC may be used as a potential biomarker in older adults for exceptional memory ability. Further longitudinal studies measuring metabolic biomarkers may help elucidate the interaction between these areas in the cognitive aging process.
INTRODUCTION
SuperAgers (SA) is a definition to describe individuals who have preservation of memory abilities in older age [1]. SA are individuals aged 80 years or more exhibiting exceptionally high memory scores, which are similar to those of middle-aged individuals [2]. Studies of such exceptional elderly have indicated a myriad of brain alterations when compared with normal agers [3, 4]. Importantly, the preservation of cingulate cortex subregions is consistently described in this group, both structural and functionally. Specifically, the anterior mid-cingulate cortex (aMCC) thickness has been described as equivalent to that of middle-aged adults [2, 6]. SA presented mixed findings of brain amyloid load as compared to that of the other normal individuals for that age [6–8]. Furthermore, high-performing older adults revealed abnormal connectivity, as measured by functional magnetic resonance imaging (fMRI), in central regions of the default mode network [9].
SA presented altered brain connectivity patterns related to their exceptional memory capacity in many regions. Specifically, cingulate regions exhibit abnormally high interactions with other brain areas associated with memory in SA. Functional connectivity between the posterior cingulate cortex (PCC) and MCC was associated with increased memory scores in SA [10], and different cingulate areas were associated with other key nodes of the memory system, such as the hippocampus [11]. Furthermore, previous studies have highlighted the pivotal role of cingulate regions in successful memory encoding [12, 13] and retrieval [14]. However, many functional studies describe subgenual areas of cingulate as a homogeneous region, but it comprises several areas with distinct structural and functional neurobiological basis [15].
Therefore, this study aimed to analyze the molecular and functional changes in the cingulate cortex of SA. We hypothesized that SA have increased metabolic activity and altered (increase or decrease) functional connectivity in subregions of the anterior cingulate than normal agers, but similar amyloid deposition as of middle-aged adults.
METHODS
Participants
Community-dwelling individuals between 50 to 65 years and at or above 80 years of age were evaluated at the Brain Institute of Rio Grande do Sul (BraIns) from January 2016 to March 2018. Individuals were invited via social media, television advertisements, and also through courses in the university that are focused toward the elderly. The participants included in the study were right-handed with no history of substance abuse, moderate or severe head trauma, or serious neurological or psychiatric diseases. All the participants included in the study demonstrated preserved activities of daily life, measured subjectively by an experienced neuropsychologist, and negative scores for the Geriatric Depression Scale –15 item version (raw score < 5) [16]. They also denied any family history of dementia or cognitive impairment. Prior to their enrolment into the study, all the participants signed an informed consent form, previously approved by the university’s ethical committee. These participants were then divided into three groups: SuperAgers (SA), age-matched controls (C80), and middle-aged controls (C50).
The SA group was defined based on previously described criteria [2]. This group comprised older adults aged 80 years or above, who showed the ability to a) perform at or above the normative values determined for individuals between 50 to 65 years of age on the delayed-recall score of the Rey Auditory-Verbal Learning Test, and b) perform at or above normative values determined for their age and education in non-memory domains. Non-memory measures included the Trail-Making Test –Part B, the Category Fluency Test–Animals, and the Boston Naming Test. The Mini-Mental State Examination (MMSE) was also applied. Two healthy control groups, comprising age-matched individuals who were running in their 80 s (C80) and cognition-matched individuals running in their 50 s (C50), were also included in the study. The participants included in both the control groups were required to perform within a normal range in both, memory and non-memory fields, with 1.5 as standard deviation from the mean, using normative values for age and education. All the study individuals underwent three imaging sessions, FDG-PET, PIB-PET, and MRI within 3 months after clinical and cognitive evaluation (Fig. 1).

Schematic diagram of the study protocol. Community-dwelling individuals were invited to participate in this study. [18F]-FDG, Fluorodeoxyglucose; [11C]-PIB, Pittsburgh Compound B; fMRI, functional magnetic resonance imaging.
Image acquisition and processing
PET imaging: glucose metabolism and amyloid deposition
Both FDG and PIB measurements were performed using a GE Discovery 600 scanner. First, a regular CT scan was obtained for attenuation and scatter correction. Subsequently, PET data were acquired using 3D list-mode. The data were reconstructed using VUE Point HD (2 iterations, 32 subsets, filter cutoff 4.8 mm, matrix size 192×192×47, voxel size 1.56×1.56×3.27 mm) and corrected for attenuation, scatter, dead time, and decay. Before performing PET scans, an intravenous catheter was placed in the left arm of all the patients and their heads were immobilized in order to minimize motion during the scan.
Participants were instructed to follow a low glucose diet 24 h prior to the FDG scan, in which the last 4 h consisted of fasting. Before injection, the participants were made to rest for 30 min and capillary glucose was measured 10 min prior to the PET scan, with acceptable levels ranging between 70 and 120 mg/dL, before imaging acquisition. The FDG was injected in bolus (32.65 MBq) and a list-mode dynamic emission scan was performed in 60 min. For the PIB scan also, the participants were made to follow a 4 h fast. PIB was injected intravenously (45.97 MBq) in bolus, while the participants were positioned inside the scanner and a dynamic list-mode acquisition was performed in 90 min.
Static PET images were acquired using raw dynamic frames (6×5 min frames) at 30–60 min post-injection for FDG and 40–60 min post-injection for PIB, which were averaged to create one single averaged image. Rigid co-registration of individual data (PET and MRI) was performed using a normalized mutual information algorithm, and the maximum probability atlas (Hammers N30R83) was used for the generation of standard brain regions of interest (ROI) in PNEURO tool (version 3.8, PMOD Technologies Ltd., Zürich, Switzerland). Partial volume correction was not performed because of its minimal impact in PIB analysis [17].
For FDG and PIB images, anatomical ROIs were generated using the Hammers N30R83 brain atlas [18]. The standardized uptake value (SUV) was obtained by normalizing tissue concentration to the injected dose and body weight. The SUV ratio (SUVr) was calculated using the cerebellum grey matter as reference [19]. A meta-ROI (Alzheimer’s disease signature ROI) was designed using the average of previously described regions [20] that show typical PIB uptake in Alzheimer’s disease: prefrontal, orbitofrontal, parietal, temporal, anterior and posterior cingulate, and precuneus. Individuals were classified as amyloid positive when meta-ROI > 1.42 [20].
MR imaging: functional connectivity
MR structural and functional images were collected on a GE HDxt 3.0T MRI scanner with an 8-channel head coil. A T1-weighted volumetric sequence designed for GE was acquired using 3D FSPGR BRAVO (TR = 6.27 ms; TE = 2.25 ms; TI =550 ms; Flip Angle = 11°; matrix size 512×512×196, voxel size 0.5×0.5×1.0 mm). These images were used for co-registration with other imaging modalities, tissue segmentation, and definition of ROIs. The echo-planar sequence (EPI) was acquired during a 7 min resting-state protocol (TR/TE =2000/30 ms, matrix size 64×64, FOV 64×64, total volumes 210). During the functional scan, the participants were requested to stare at a crosshair and not to think of anything in particular. An in-house real-time system was used to monitor the head motion of the study participants. The participants who moved their heads excessively were reminded to maintain their heads still and the sequence was restarted.
All functional images were pre-processed using the software AFNI (afni.nimh.nih.gov) [21]. Preprocessing steps included slice-time and motion correction and a non-linear spatial normalization to 3.5×3.5×3.5 mm3 voxel template (MNI152 template). Time repetitions (TR) tracked with excessive motion [framewise displacement (FD) > 0.6 mm], were censored from the dataset. The exclusion criterion for the excessive motion was defined to be the motion wherein a participant had 20% of the TRs above the FD threshold. A nuisance regression with six motion estimated parameters (x, y, z, roll, pitch, yaw) and time-series of the average signal of the white matter and cerebrospinal fluid was performed. Signal detrending using a bandpass temporal filter (0.01 and 0.1 Hz) [22] and smoothing with a 6 mm FWHM Gaussian kernel were also employed as preprocessing steps on the functional data. To correct for multiple comparisons, the 3dClustSim command was used to calculate a corrected p-score of < 0.05; following the calculation, the analyses carried out for a cluster of p < 0.005 with a minimum cluster size of 35 voxels (1498μL).
Seed-based analysis
A seed-based fMRI (functional MRI) analysis of connectivity was performed based on previously described regions that distinguished SA from other normal individuals of that age [2, 7]. ROIs were extracted by using regional boundaries of the Hammers brain atlas for the following regions: anterior cingulate, posterior cingulate, presubgenual and subgenual areas (Supplementary Figure 1). For each participant, the average time course of the voxels within the seed was collected, and Pearson’s correlation was implemented between the time series of each ROI and all other voxels in the brain. Correlation results were then remodeled using Fisher’s r-to-z method, prior to the statistical analysis.
Independent component analysis
The data-driven model analysis was also carried out for the rsfMRI data with independent component analysis (ICA) using MELODIC (FSL, v6.0.0). Fourteen components were estimated for this analysis, which successfully distinguished resting-state networks; dual regression was applied to obtain the independent component (IC) maps in each individual. IC-6 was selected because of significant activation of hippocampal and cingulate areas (Fig. 3).
Statistical analysis
The normality of cognitive scores were calculated using the Shapiro-Wilk test. Clinical variables showed normal distribution, except for the MMSE. Sample size was calculated based on previous data [2], with an F effect size of 0.56. Demographic variables were compared between groups with ANOVA, followed by Tukey’s post-hoc or Chi-squared test (for Sex). ANCOVA and ANOVA calculations followed by Tukey’s post-hoc test were performed to compare SA with other groups for the statistical analysis of FDG-PET and PIB-PET (R Studio –v1.0.136). Grey matter volume and amyloid deposition were used as covariates in metabolic activity analysis. The seed-based and IC analysis were performed using AFNI’s scripts for group comparison, general linear model fitting (3dMVM), and regression analysis (3dRegAna) [21]. The results were considered to be statistically significant for a minimum cluster size of 1498μL and a threshold of p < 0.005 after correction for all imaging analysis.
Pearson’s correlation tests were employed to measure the relationship between cognitive scores and neuroimaging metrics. Each of these tests used bias-corrected accelerated (BCa) 95% confidence intervals (CI) and 1000 Bootstrapped samples to create a re-sampled range of correlated coefficients. The effect size of all associations was also calculated using Cohen’s d (for linear regressions) and partial eta squared tests (for ANOVA and ANCOVA). Multiple linear regressions were performed to calculate the associations between cognitive scores and neuroimaging metrics. All ROI-wise and regression analysis were performed using the R Studio (v3.3.2).
RESULTS
Demographic factors
A total of 270 individuals were contacted, 121 were evaluated, and 30 were included in the study. No significant differences were found between SA and C80 groups in terms of age, years of education, or distribution of sex (Table 1). The C50 group differed from the SA group in terms of age, as expected by the inclusion criteria (p < 0.001, corrected); however, education, sex, and cognitive measures did not differ statistically between these groups (p > 0.05, corrected for all measures).
Demographic characteristics of the participants
SA, SuperAgers; C80, Age-matched controls; C50, Middle-aged controls; MMSE, Mini-Mental State Examination; BNT, Boston Naming Test; CFT, Category Fluency Test; TMT-B, Trail-Making Test –Part B.
Brain glucose metabolism
A primary analysis showed statistically similar glucose metabolism between SA from C80 in the whole anterior cingulate cortex (ACC, 0.87±0.13 versus 0.88±0.1) and PCC (1.18±0.21 versus 1.15±0.11, p > 0.05, corrected for both). Because several different functions were described for different sub-regions of ACC [15], we conducted a subsequent analysis using the following sub-regions of ACC: subgenual (sACC), presubgenual (pACC), and midCingulate (MCC) (Supplementary Figure 1). Importantly, total volumes of all subregions of ACC and hippocampi were observed to be statistically similar between SA and C80 groups (p > 0.05, Supplementary Table 1).
In the regional analysis, the SA group showed increased metabolic activity in the right and left sACC subareas as compared to that in the C80 group (p < 0.005, corrected, Table 2). Also, effect sizes for right and left sACC were moderate between groups (eta-squared = 0.12 and 0.035 respectively) Importantly, the levels of metabolic activity in the right and left sACC of the SA group were statistically similar to that of the C50 group (p > 0.05), suggesting the preservation of these areas in SA. Furthermore, right pACC presented a significant correlation with delayed-recall memory scores for the whole sample (r = 0.58, p < 0.001; BCa 95% CI: r = 0.29 : 0.75). Both sACC and pACC were negatively correlated with age in the whole sample (r = –0.60 and r = –0.67 respectively, p < 0.005), but this finding was not significant for groups individually (p > 0.05, Supplementary Table 5). Despite right and left pACC glucose metabolism was different between groups (Table 2), these relations did not survive a correction for multiple comparison analysis (p > 0.05). Both right and left MCC glucose metabolism did not show statistical differences between groups.
Regional metabolic activities across the groups
†p-values after adjustment for grey matter volumes and amyloid deposition. ††p-values after adjustment for amyloid deposition. *p < 0.05 uncorrected; **p < 0.05 after corrected for multiple comparisons. ACC, anterior cingulate cortex; sACC, subgenual ACC; pACC, presubgenual ACC.
The SA group showed higher levels of glucose metabolism in both right (p < 0.001, corrected) and left hippocampus (p < 0.005, corrected) when compared with the C80 group (Table 2). Effect sizes for right and left hippocampus were small between groups (eta-squared = 0.051 and 0.009 respectively). Besides, SA and C50 groups showed similar glucose metabolism in both sides of the hippocampus (p > 0.05), also suggesting preserved metabolic activity in these areas in SA. A moderate correlation was found between both, right and left hippocampal glucose metabolism and the delayed-recall memory scores in the entire sample (r = 0.46, p = 0.01 and r = 0.47, p = 0.009, respectively). As expected, a negative correlation between right hippocampal metabolic activity and age in the whole sample was detected (r = –0.57, p = 0.001; BCa 95% CI: r = –0.75: –0.31). However, the SA group alone showed a significantly positive relationship between right hippocampal glucose metabolism with age (r = 0.66, p = 0.03; BCa 95% CI: r = –0.24 : 0.9). The effect size of the association between the right hippocampus and age was found to be large for the whole sample (Cohen’s d = 8.35) and very large for the SA group alone (Cohen’s d = 45.65). Importantly, brain glucose metabolism analyses were performed also using regional grey matter volume and amyloid deposition and covariates. All group comparisons of brain glucose metabolism remained statistically similar in this covariation analysis (Table 2).
Amyloid deposition
Amyloid deposition was compared between groups using PIB SUVr in the meta-ROI, anterior Cingulate sub-regions and both hippocampi. No significant differences were observed in the meta-ROI for PIB SUVr between SA and C80 (1.25±0.24 versus 1.32±0.25, p = 0.56) and in proportions of PIB positivity (30% SA versus 30% C80 were PIB positive). Both SA and C80 groups showed significantly increased meta-ROI PIB SUVr compared with the C50 group (1.06±0.06, p < 0.05 corrected for both comparisons) and they also exhibited increased proportion of PIB positive individuals (no C50 individual was PIB positive, p < 0.05, Supplementary Figure 2). The subregion analysis revealed no statistically significant difference in amyloid deposition between groups in any part of the subareas of ACC (p > 0.05, Supplementary Table 2).
Functional connectivity
To investigate the connectivity of the sACC, a seed-based analysis was conducted using it as a seed. The SA group showed decreased connectivity between right sACC and right PCC as compared to that in the C80 group (cluster size = 1286 mm3, p < 0.005 corrected; Fig. 2). The cluster in the posterior Cingulate cortex had a volume of 1286 mm3 and its peak coordinates were x = 14.0, y = 63.5, and z = 4.0. There were no significant differences in the functional connectivity of other subregions of the cingulate cortex between SA and C80 groups (left sACC, right and left pACC, MCC and PCC, p > 0.005, Supplementary Table 6). Other age-related alterations were identified in pACC, sACC, MCC, and PCC (Supplementary Table 6). Group comparisons of each cingulate subregion remained statistically similar when covariated for grey matter volume and for amyloid deposition (Supplementary Table 7).

Seed-based functional connectivity. Decreased functional connectivity between right subgenual ACC region [in red–a] and right posterior Cingulate cortex [in blue–b; 42 voxels, center mass coordinates (20, 65, 8)] in the SA group as compared to that in the C80 group. c) Z-scores for the correlation between the right subgenual ACC seed and the cluster in the right posterior cingulate cortex in each group. SA, SuperAgers; C50, Middle-aged controls; C80, Age-matched controls.
ICA showed one component that significantly distinguished SA from the C80 group (IC–6), which involved abnormal functional connectivity of both medial, superior temporal, posterior cingulate, and anterior cingulate areas (Fig. 3a). Increased functional connectivity of the right superior frontal gyrus with the IC–6 (cluster size = 1414 mm3, p < 0.005) was found for the SA group in comparison to the C80 group (Fig. 3b). A significant relationship (F = 9.464, p < 0.005 uncorrected) was also observed between left medial frontal gyrus in the IC–6 and the delayed-recall memory scores in the study sample, validated by a significant Pearson’s coefficient (r = 0.7, p < 0.001; BCa 95% CI: r = 0.46 : 0.83) (Fig. 3c).
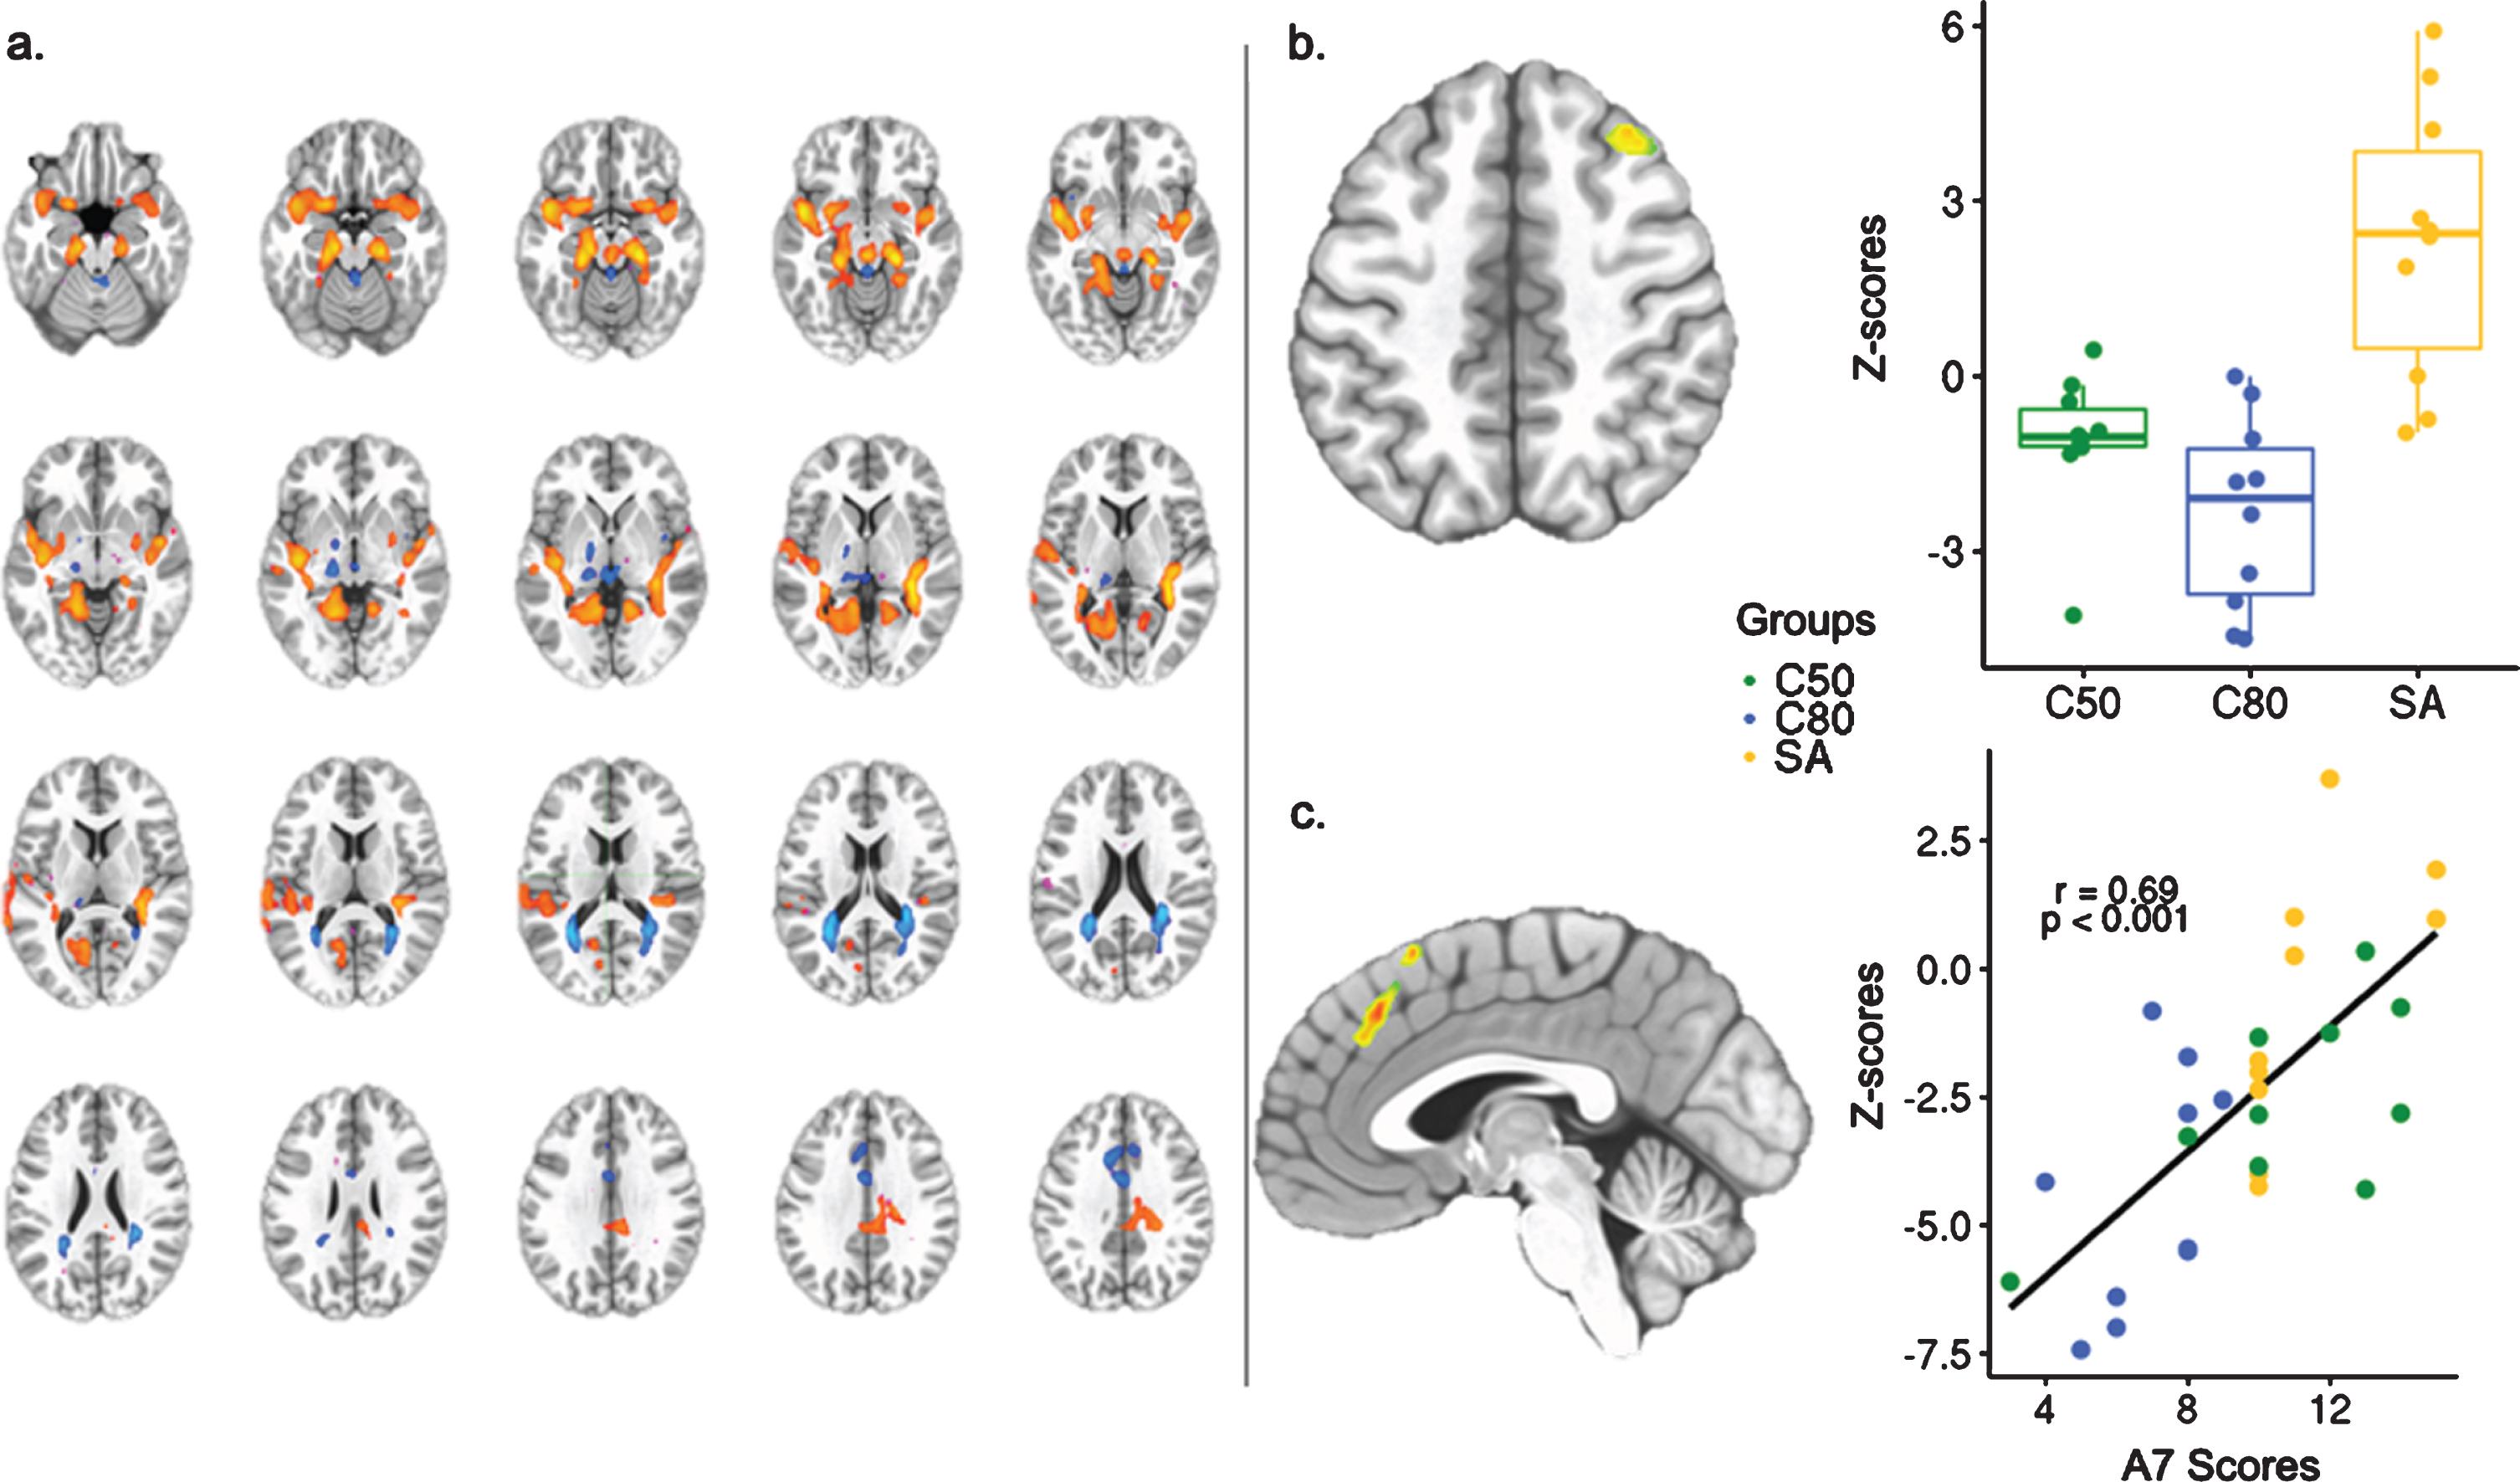
Independent component analysis of whole-group resting-state fMRI. a) Identification of the Independent Component –6 (Z-score threshold = 4.033). b) Independent component analysis showing the right superior frontal gyrus, region within the IC–6 that distinguished SA from C80 (35 voxels, center mass coordinates (–31, –22, 54). c) Regression analysis between delayed-recall memory scores and loading factors of IC–6 showing the right medial frontal gyrus and Pearson’s coefficient calculated between right medial frontal gyrus connectivity and the delayed-recall memory scores (36 voxels, center mass coordinates (–4, –31, 41). SA, SuperAgers; C50, Middle-aged controls; C80, Age-matched controls; A7 Scores, delayed-recall memory scores.
DISCUSSION
A group of older adults with exceptional memory was identified and multiple features of their brain areas supporting excellent memory function were examined. Selecting individuals with exceptionally high memory performance at an advanced stage of life may provide important biomarkers for memory maintenance through the aging process. The main findings of this study were as follows: Firstly, SA showed unusually high brain activity for their age in sACC and hippocampus, which is similar to that of the middle-aged participants. Secondly, SA exhibited similar amyloid burden as their age-matched counterparts.
In this study, SA exhibited increased metabolic activity in the sACC and hippocampus, and also abnormal functional connectivity in the sACC when compared with normal agers. Subregions of the ACC have been associated with other functionally and anatomically distinct areas of the brain [15, 23]. Abnormal metabolic activity and functional connectivity of sACC were extensively described in individuals with major depression disorder [24]. However, the sACC has been increasingly associated with regions within the memory system, such as the hippocampus and the PCC previously [15, 23]. The PCC is a major hub in the default mode network involving the hippocampal-cortical memory system [25], while the ACC is associated with encoding and retrieval aspects of memory involving other cortical regions [15, 26]. The abnormal neuronal activation exhibited by SA in the sACC in this study may be moderated by the increased metabolic activity of the hippocampus when sustaining exceptional memory capacity in a circuit that involved different parts of the cingulate cortex [27]. This ultimately described a circuit with increased activity, from the hippocampus to the sACC, but without progressing to the PCC as expected in normal agers. Age-related compensatory mechanisms of older adults [28, 29] may possibly be absent in functional connectivity of SA. The memory role of medial prefrontal regions, which includes the sACC, was previously described in a complex circuit to other cortical areas [26]. Hence, both sACC and hippocampus were showed in this study to be potential biomarkers of exceptional memory in older adults. However, the role of the sACC in the memory system is not completely understood, and further studies on its dynamic connectivity may clarify this point.
Amyloid deposition in SA was similar to that of the normal agers in this study. The minority of SA exhibited amyloid positivity, which is a hallmark of the biological definition of Alzheimer’s disease [30]. Although biomarkers for tau were not available in this study, one-third of SA matched criteria for Alzheimer’s disease pathological continuum. Recent studies on high-performing older adults presented inconsistent findings regarding amyloid burden [6, 31], possibly due to high heterogeneity in the selection of the sample. Findings of this study are similar to those of previous studies that presented similar amyloid deposition between high-performing older adults and normal agers [6, 8] and increased metabolic activity in the anterior cingulate [32]. However, the cohort included in this study is composed of individuals of a higher age range only. Age threshold is important in the context of Alzheimer’s disease because of the increased amyloid deposition rate seen in the non-demented older adults as they age [33]. Despite showing similar regional amyloid burden as their counterparts, SA exhibited youthful neuronal activity and abnormal connectivity in their brains. Together, these results indicate a possible mechanism of better coping with brain pathology, specifically in the brains of SA as compared to that of cognitively normal older adults [34]. An investigation suggested that an important dose-response effect reflects the association between amyloid burden and cognitive decline [35], although this association is not present in SA. APOE status is associated with amyloid deposition and it could provide more information about the risk of pathological changes in SA. Moreover, studies with longitudinal approaches presenting tau biomarkers will identify the coexistence of Alzheimer’s disease in SA and may further clarify the process of successful cognitive aging. Whole-brain voxel wise analysis may also provide important insights on other brain areas not included in this study.
Even though this study included a small sample size, it is important to mention that the participants were selected through a very strict inclusion criterion of advanced age and exceptionally high cognitive scores. The sample size has been accounted as an important limitation as some outcomes did not survive the correction for multiple comparisons; thus, interpretation of the results should be carefully addressed. Cognitive evaluation performed in this study was the same described by Harrison et al. [2]; however, normative data may vary because of the sociocultural setting of individuals [36]. Even though the APOE status was unavailable for this sample, individuals without any type of family history of dementia or cognitive impairment were selected. Besides, a population-based study [37] corroborated that PIB positivity is associated with cognitive decline, independent of APOE status. Also, APOE status was not included in a recent biological definition of Alzheimer’s disease because of its association with increased risk, but not with pathological alterations [30]. A longitudinal approach to this population is decisive to confirm whether all the described brain features are persistent or temporary. Further work is warranted to clarify the mechanisms of memory maintenance in a longitudinal and multimodal brain analysis.
Overall, these results suggest that SA may present with increased brain metabolic alterations compared with their age-matched peers. Together, they authenticate the key role of the sACC and hippocampus in the exceptional memory ability of SA, even in the presence of amyloid deposition. In particular, sACC is a potential biomarker of memory function in older adults.
Footnotes
ACKNOWLEDGMENTS
WVB, ELC, and GR received a CAPES scholarship (PBE-DPM II, Programa de Excelência Acadêmica and PDES, respectively). JCC is funded by CNPq (Bolsa de produtividade de pesquisa). We would like to thank Luciana Borges Ferreira for support in the data acquisition of this study.
This work was supported by CNPq [grant number 403029/2016-3] and FAPERGS [grant number 17/2551-0001107-4] and also in part by CAPES [Finance Code 001].