
Abstract
Background:
Socioeconomic factors are important contributors to brain health. However, data from developing countries (where social inequalities are the most prominent) are still scarce, particularly about hypertensive individuals.
Objective:
To evaluate the relationship between socioeconomic index, cognitive function, and cortical brain volume, as well as determine whether white matter hyperintensities are mediators of the association of the socioeconomic index with cognitive function in hypertensive individuals.
Methods:
We assessed 92 hypertensive participants (mean age = 58±8.6 years, 65.2%female). Cognitive evaluation and neuroimaging were performed and clinical and sociodemographic data were collected using questionnaires. A socioeconomic index was created using education, income, occupation (manual or non-manual work), and race. The associations of the socioeconomic index with cognitive performance and brain volume were investigated using linear regression models adjusted for age, sex, time of hypertension since diagnosis, and comorbidities. A causal mediation analysis was also conducted.
Results:
Better socioeconomic status was associated with better visuospatial ability, executive function, and global cognition. We found associations between a better socioeconomic index and a higher parietal lobe volume. White matter hyperintensities were also not mediators in the relationship between the socioeconomic index and cognitive performance.
Conclusion:
Socioeconomic disadvantages are associated with worse cognitive performance and brain volume in individuals with hypertension.
Keywords
INTRODUCTION
Clinical conditions such as hypertension, diabetes, and stroke have been extensively associated with cognitive impairment and brain changes [1–4]. However, evidence has shown that socioeconomic conditions may play a significant role in the deterioration of brain health [5, 6]. Social determinants are a group of factors apart from clinical variables that have a powerful role in health outcomes [7]. They are the sociodemographic conditions in which a person is born and lives [8]. These factors include poverty, sanitation, clean water, safe food, income, education, ethnicity, and working and housing conditions [8–10].
Some social determinants, mainly education, have been extensively associated with cognitive function and brain structure [11, 12]. High levels of education and occupation, as well as higher income, are associated with better cognitive performance [13–15]. Likewise, fewer years of formal education, lower incomes, and lower occupational status are associated with a higher incidence of Alzheimer’s disease [16] and cognitive impairment [17]. Discrimination associated with race/ethnicity has often been associated with adverse mental health outcomes [6, 19]. However, the effect of these socioeconomic variables on the brain function and structure of patients with hypertension has not yet been considered.
Another great concern regarding the relationship between social determinants and health is the large amount of evidence available from developed countries, whereas evidence from developing countries is scarce [9, 20]. In addition, the isolated way in which socioeconomic variables have usually been considered in previous analyses is an important issue [11, 12]. Considering a multi-risk socioeconomic score could better reflect the common effect of these variables on brain health. Therefore, the aim of this study was to evaluate the association of a socioeconomic index with cognitive performance and brain volume in hypertensive individuals, and whether this association between the socioeconomic index and cognitive performance can be mediated by white matter hyperintensities, a common condition associated with cognitive impairment [21] and hypertension [22].
METHODS
Study design, participants, and ethical approval
This cross-sectional study included patients from the hypertension unit of the São Paulo University Heart Institute. Participants were contacted and recruited via telephone calls between 2016 and 2019. A total of 394 patients were contacted by phone, and a brief explanation of the study protocol was provided. From this first contact, 102 patients agreed to participate in a face-to-face screening that comprised cognitive assessments, clinical examinations, and a sociodemographic questionnaire. Thereafter, magnetic resonance imaging (MRI) was conducted on a subsample of 37 individuals.
Our inclusion criteria included those aged between 40 and 70 years and who had a previous diagnosis of hypertension (according to a medical diagnosis recorded in the hospital’s database or a report of antihypertensive drug use), while the exclusion criteria included those with less than 4 years of education, severe cognitive or communication impairments, and contraindications for performing MRI. The protocol was approved by the local ethics committee (number 4266/15/093), and all participants provided written informed consent.
Cognitive evaluation
Cognition was evaluated using the following neuropsychological tests: the Mini-Mental State Examination (MMSE), Rey Complex Figure Test (RCF), immediate and delayed recall of Stories A and B from the Wechsler Memory Scale-Revised (WMS-R), Digit Span Forward and Backward Subtests from the WMS-R, Letter-Number Sequencing from the Wechsler Adult Intelligence Scale-Third Edition (WAIS-III), FAS letter fluency from the Controlled Oral Word Association Test, and Frontal Assessment Battery (FAB).
The MMSE is a screening test commonly used to assess global cognition. It is a 30-point scale, with higher scores indicating better performance [23].
For the RCF, the participants were asked to copy the figure that was presented to them. Approximately 20 to 30 min later, they were asked to recall and draw the figure again without looking at the figure presented earlier. The maximum score for this test was 35. The total score was based on the number of correctly recalled pieces. This test measures visuospatial abilities [24].
The immediate and delayed recall of Stories A and B from the WMS-R consisted of two short stories that the participant needed to listen to carefully and then recall. After 20 to 30 min, a delayed recall was requested. The score was based on the number of terms that the participant recalled. The maximum score was 25. This subtest was used to assess the subjects’ memory [25].
The digit span forward and backward subtests from the WMS-R consisted of two lists of numeric strings. For the forward subtest, the participants were asked to listen to a numeric string and repeat it in the same order. For the backward subtest, the participants were asked to listen to a numeric string and repeat it in the opposite order. The score on each subtest consisted of the number of correctly remembered sequences. The maximum score for each test was 14. These subtests were used to assess executive functions, such as working memory and attention [25].
The Letter-Number Sequencing subtest from the WAIS-III consisted of sequences of numbers and letters. The participants were asked to listen to the sequence carefully and then repeat it in an organized manner. Numbers should have come first in an ascending order, and letters should have come last in an alphabetical order. The maximum score was 21. This test was used to assess the executive function [25].
The FAS letters fluency test consisted of asking participants to say as many words as possible, starting with the letter ‘F,’ ‘A,’ and ‘S’ for one minute for each letter. The final score was the sum of the number of correct words for each letter. This test was used to measure verbal fluency, language, and attention [25].
The FAB is a questionnaire composed of six subtests about similarities, verbal fluency (letter ‘S’ score from FAS letters fluency test), go/no-go tasks, and gripping behavior. These subtests were summed to obtain a total score of 18. The final score was the sum of correct answers. This test was used to measure executive function [26, 27].
To make more standardized comparisons of the cognitive tests, a Z-score was calculated for each test by subtracting the participant’s test score from the mean sample score and dividing the difference by the sample standard deviation (SD). Thus, a Z-score of -1 represents a cognitive performance that is 1 SD below the mean sample score for each test [28, 29]. A composite memory Z-score was calculated by averaging the Z-scores of the two parts of the stories’ subtests from the WMS-R and then standardizing this mean [28]. The same was made for the two parts of the RCF to obtain a composite Z-score for visuospatial ability. The forward and backward digit span tests, Letter-Number Sequencing, FAS letters fluency test, and the FAB were taken together in a composite executive function Z-score.
Socioeconomic index
Sociodemographic and clinical variables were self-reported. Socioeconomic variables included education, monthly household income in minimum wages, race, and occupation. The occupation was reported by the participant and later classified as manual (mainly requiring physical effort) or non-manual work (mainly requiring mental effort) by the researchers. These variables have been reported as important social determinants of health [9]. We assigned a score of 1 or 0 to each socioeconomic variable according to their positive or negative association with cognitive performance respectively [13–17]. For the quantitative variables, which were education and income, the cut-off was the median value, with 1 attributed to those equal or above the median and 0 to those below the median. We also attributed a score of 1 to patients classified as white or other and 0 to those classified as black or brown. We assigned a score of 1 for non-manual work and 0 for manual work. The social index variable was equal to the sum of the scores attributed to each of the four socioeconomic variables (Fig. 1), with higher values indicating better socioeconomic status.
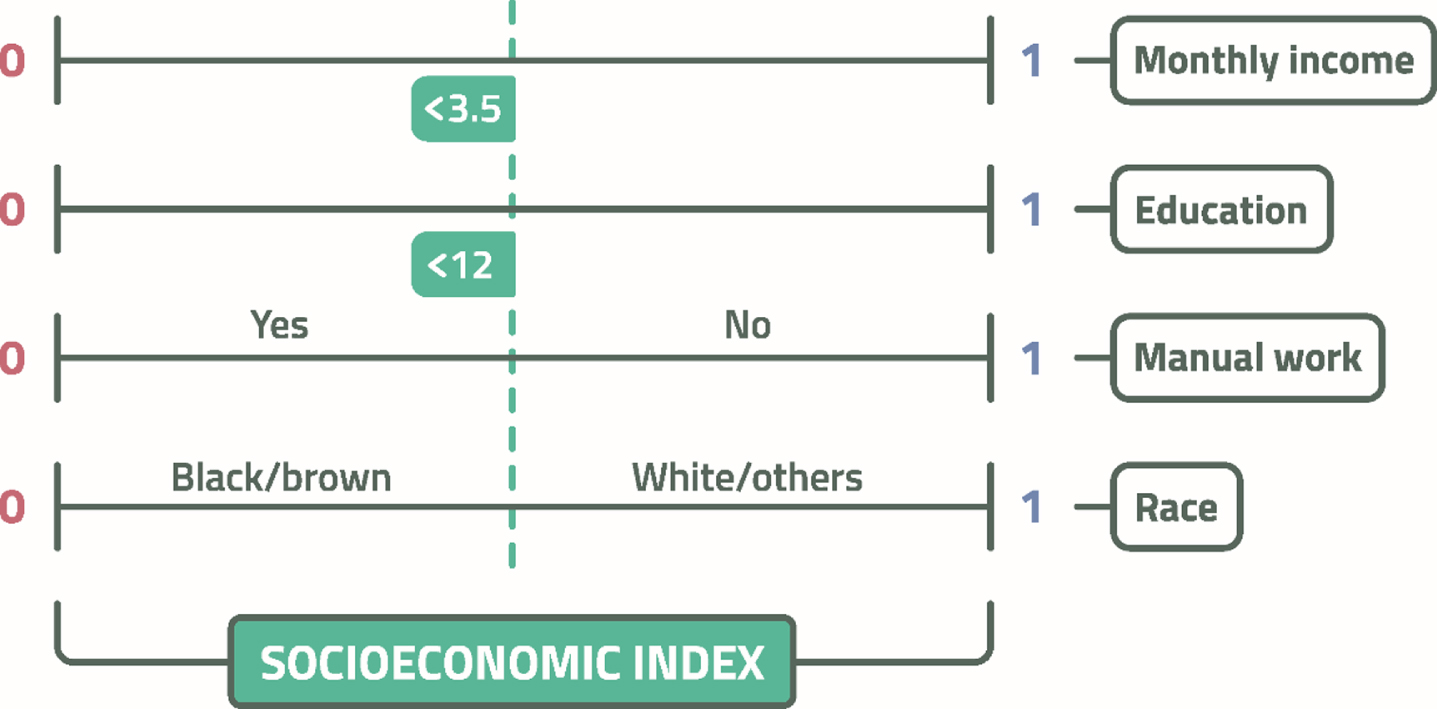
Variables and score system used to build the socioeconomic index.
MRI
A subsample of 37 participants was scanned using a 3.0 T MR system (Philips Achieva, Eindhoven, the Netherlands) that was equipped with 80 mT/m gradients and a 32-channel head coil. T1-weighted SENSE 3D images (repetition time/echo time of 7.0 / 3.2 ms, flip angle 8°, Sense 1.5, a field of view of 240×240, matrix 240×240, 180 slices of 1 mm each with no gap, voxel size of 1 mm3, and acquisition time 6.01 min) were acquired for morphometric brain analysis. Axial fluid-attenuated inversion recovery images were collected (TR/TE, 11000/130 ms; inversion time, 2800 ms; FOV, 230×183; matrix, 356×210; and 28 slices, 4.5 mm each with a 0.5 gap) to identify incidental findings, such as lacunar infarcts and white matter hyperintensities. All images were visually inspected by a board-certified neuroradiologist.
T1-weighted MRI data were analyzed using FreeSurfer version 6.0 (https://surfer.nmr.mgh.harvard.edu/). The software provides a standard full processing pipeline for structural MRI data, including skull stripping, B1 bias field correction, gray-white matter and cerebrospinal fluid (CSF) segmentation, reconstruction of cortical surface models, and labeling of regions on the cortical surface and subcortical brain structures. Cortical parcellation was performed using the Destrieux atlas. Cortical thickness and volume were calculated, and their structures were measured bilaterally in all segments. For total brain volume, we considered the volume of all voxels of the brain segmentation without the ventricles, CSF, choroid plexus, and brain stem. For the hippocampus, frontal lobe, parietal lobe, temporal lobe, and occipital lobe volumes, we considered the sum of the regional volumes to produce global measures. All volumes were corrected for estimated total intracranial volume [30].
White matter hyperintensities (WMH) were defined according to the Fazekas scale [31, 32]. Periventricular and deep WMHs were rated separately. Periventricular hyperintensities were scored as follows: 0 = absence, 1 = ‘caps’ or pencil-thin lining, 2 = smooth ‘halo,’ and 3 = irregular periventricular hyperintensities extending into the deep white matter. Deep WMH were scored as follows: 0 = absence, 1 = punctate foci, 2 = beginning confluence of foci, and 3 = large confluent areas. The total Fazekas score used in the analysis, ranging from 0 to 6, was obtained by summing the periventricular and deep white matter scores [33].
Other variables
Possible confounding variables of the relationship between the socioeconomic index and cognitive performance included age, sex, the clinical variables that were grouped in the comorbidity index, and the duration of hypertension in years since the initial diagnosis.
The clinical variables grouped in the comorbidity index were body mass index (BMI), previous diagnosis of stroke or myocardial infarction, presence of diabetes or dyslipidemia defined by hypoglycemic and lipid-lowering drug use, and smoking status (never, current, or previous smoker). These variables were previously associated with cognitive impairment [2, 34–36]. Thus, for the numeric BMI variable, the cut-off was the median value, with 0 attributed to those below the median and 1 to those equal or above the median. For dichotomous categorical variables (stroke, myocardial infarction, diabetes, and dyslipidemia), we assigned a score of 0 if the variable was absent and 1 if it was present. For smoking, we attributed a 0 to those defined as never smokers or those who had quit smoking for more than one year, and 1 to those who were current smokers or who had quit smoking for less than one year. The comorbidity index variable was equal to the sum of each index attributed to these six clinical variables (Fig. 2), with higher values indicating higher cardiovascular comorbidity.
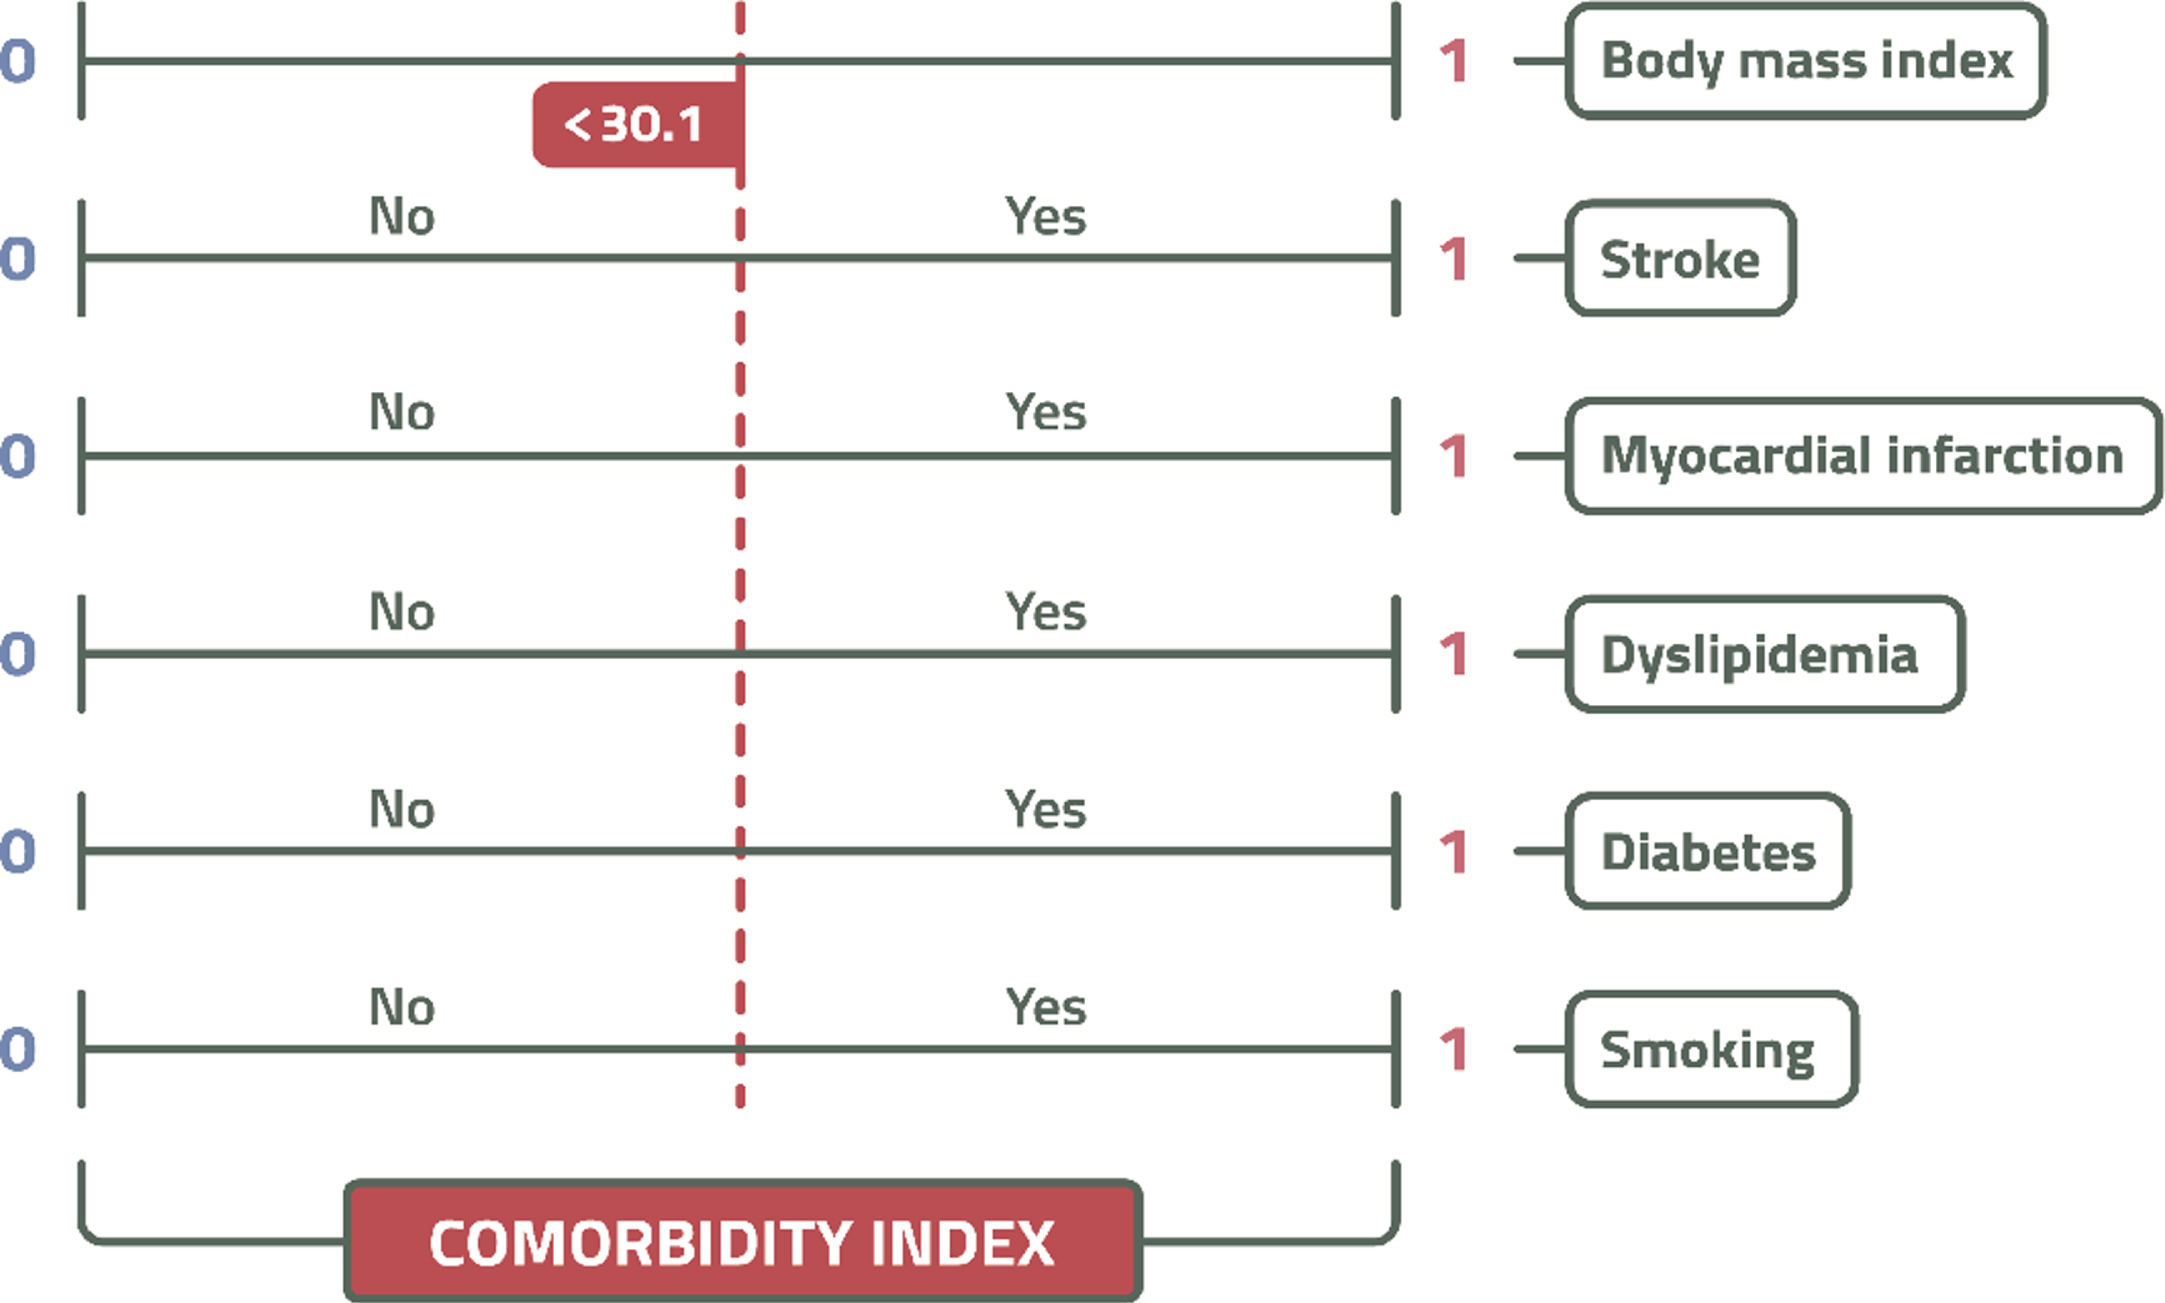
Variables and score system used to build the clinical comorbidity index.
Statistical analysis
To describe the quantitative variables, we used the mean and SD. Categorical variables are described as relative frequencies. Data distribution was determined using the Shapiro–Wilk test. The independent samples t-test, Mann–Whitney U test, and chi-square test were used to compare groups. To investigate the association of the socioeconomic index or their individual variables with cognitive performance and brain volume, we used linear regression models adjusted for age, sex, comorbidity index, and time since hypertension diagnosis. Normal quantile-quantile (Q-Q) plots of the residuals and plots of the residuals versus the predicted values, as well as histograms of the residuals, were used to assess the assumptions of linear regression. The absence of multicollinearity was verified using variance inflation factor. The dependent variables were the composite Z-scores of the cognitive tests or cortical structure volumes (in mm3). We investigated whether WMH are mediators of the association between socioeconomic index and cognitive performance. The total Fazekas score for WMHs was used as a mediating factor. The mediation model comprised the direct effect of the socioeconomic index in the composite Z-scores of the cognitive tests and the indirect effect of the total Fazekas score in the composite Z-scores of the cognitive tests. Causal mediation analysis was performed with the “mediation” R package for causal mediation analysis [37, 38]. Statistical analyses were performed using R software (version 4.0.0). The statistical significance was set at 5%.
RESULTS
Sociodemographic and clinical characteristics of the sample
Of the 102 participants screened, five participants who did not meet the educational level criteria, four that had incomplete cognitive test data, and one that did not have a hypertension diagnosis were excluded. Ninety-two participants met the eligibility criteria and were included in the analysis of this cross-sectional study (Fig. 3). The sociodemographic and clinical characteristics of the patients are presented in Table 1. The mean age of the sample was 58.0±8.6 years, and 65.2%were women. The mean duration devoted to education was 11.3±3.8 years. All participants had hypertension, with a mean time of diagnosis of 19.9±11.9 years, and diuretics were the most frequently prescribed drugs. The comparison of cognitive performance and sociodemographic and clinical characteristics between participants with and without MRI data is shown in Table 2. Most characteristics were similar, except for the participants’ monthly household income, which was higher among participants who underwent MRI. Previous diagnosis of stroke was more common among participants who were not evaluated with MRI. In this subsample with MRI data, 72.9%(n = 27) of the participants ranged from 0 to 2 on the Fazekas scale, and no evidence of brain lesions as lacunes in their cortical or cortico/subcortical regions, nor WMH lesions in their subcortical regions that resembled CSF signal intensity were observed.
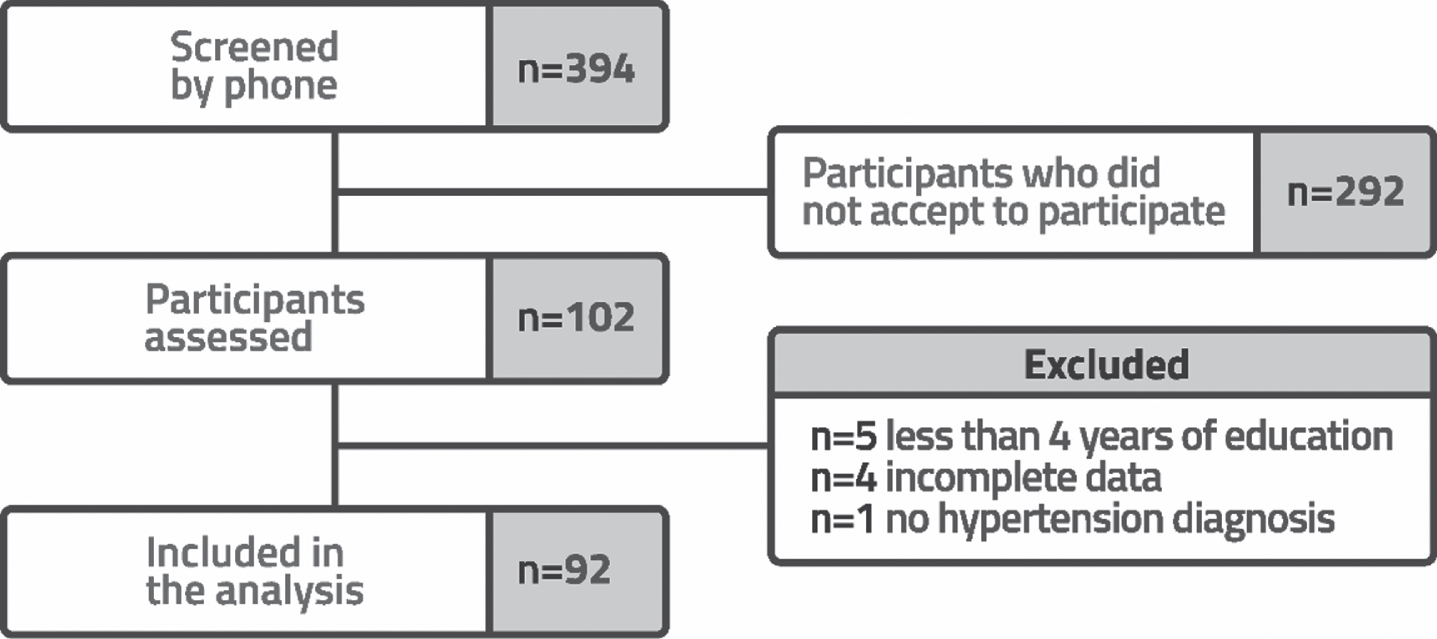
Flowchart of the study participants.
Sociodemographic and clinical characteristics of the sample (n = 92)
*1 USD, 5.59 Real; BMI, body mass index; ARB, angiotensin II receptor blockers; ACEI, angiotensin-converting enzyme inhibitors; CCB, calcium-channel blockers; BB, beta-blockers.
Comparison between samples with and without MRI
*1 USD, 5.59 Real; IQR, Interquartile range; BMI, body mass index; ARB, angiotensin II receptor blockers; ACEI, angiotensin-converting enzyme inhibitors; CCB, calcium-channel blockers; BB, beta-blockers; MMSE, Mini-Mental State Examination.
Socioeconomic index and cognitive performance
Higher scores in the socioeconomic index were associated with better visuospatial ability (β= 0.29, 95%CI = 0.13 to 0.46, p < 0.001), higher executive function (β= 0.35, 95%CI = 0.20 to 0.51, p < 0.001), and higher global cognition z-scores (β= 0.33, 95%CI = 0.18 to 0.49, p < 0.001) in the adjusted analyses for age, sex, time since hypertension diagnosis, and clinical comorbidities. In contrast, the socioeconomic index was not associated with memory performance (β= 0.15, 95%CI = –0.02 to 0.32, p = 0.09) (Table 3).
Association between socioeconomic index and cognitive performance (n = 92)
Model 1: Unadjusted linear regression model. Model 2: Linear regression model adjusted for age and sex. Model 3: Linear regression model adjusted for age, sex, time since hypertension diagnosis, and clinical comorbidity index.
Individual socioeconomic variables were considered in a multivariate model adjusted for age, sex, time since hypertension diagnosis, and clinical comorbidity index (Table 4). Higher education was an independent predictor for higher visuospatial ability (β= 0.11, 95%CI = 0.04 to 0.18, p < 0.01), executive function (β= 0.09, 95%CI = 0.04 to 0.16, p < 0.001), and global cognition z-scores (β= 0.10, 95%CI = 0.04 to 0.17, p < 0.01). Higher income was an independent predictor of better executive function z-scores (β= 0.06, 95%CI = 0.01 to 0.11, p = 0.02). Occupation status and race were not independently associated with any cognitive tests (Table 4). Furthermore, the associations between each isolated socioeconomic variable and cognitive functions were analyzed in separate models adjusted for age, sex, time since hypertension diagnosis, and the clinical comorbidity index, and are presented in Supplementary Table 1. Higher education was associated with better performance in all cognitive functions. The higher the income, the better the performance in terms of visuospatial ability, executive function, and global cognition. The non-manual work category of occupation was associated with better memory performance, visuospatial ability, and executive function. Finally, non-black participants had higher global cognitive performance than black participants (p = 0.04) (Supplementary Table 1). The interaction between the socioeconomic index and race was also analyzed, but there was no significant interaction of this term with any cognitive test (Supplementary Table 2).
Association between socioeconomic index variables and cognitive performance (n = 92)
All socioeconomic variables in the table were considered predictors in a multivariate linear regression model adjusted for age, sex, time since hypertension diagnosis, and clinical comorbidity index. Reference category for occupation: manual work; reference category for race: black.
Socioeconomic index and brain volumes
In the linear regression analysis adjusted for age, sex, time since hypertension diagnosis, and the clinical comorbidity index, we found that better socioeconomic index was associated with higher parietal lobe volume (β= 5557, 95%CI = 679 to 10434, p =0.03). However, we did not find an association between socioeconomic index and total brain (β=38777, 95%CI = –10743 to 88297, p = 0.12), temporal lobe (β= 3010, 95%CI = –769 to 6791, p = 0.11), occipital lobe (β= 1749, 95%CI = –1256 to 4755, p = 0.24), hippocampus (β= 253, 95%CI = –63 to 569, p = 0.11), and gray (β= 21063, 95%CI = –6872 to 48999, p = 0.13), and white matter volumes (β= 17456, 95%CI = –5394 to 40308, p = 0.13) (Table 5).
Association between socioeconomic index and brain volumes (n = 37)
Linear regression model adjusted for age, sex, time since hypertension diagnosis, and clinical comorbidity index.
Mediation effects
In a mediation model that comprises the socioeconomic index, WMH evaluated by the Fazekas score, and cognitive performance adjusted for age, sex, time since hypertension diagnosis, and clinical comorbidity index, we found that WMH was not a mediator in the association of the socioeconomic index with visuospatial ability (β= –0.04, 95%CI = –0.14 to 0.00, p = 0.16), executive function performance (β= –0.002, 95%CI = –0.04 to 0.03, p = 0.96), or global cognition (β= 0.02, 95%CI = –0.03 to 0.11, p = 0.44). We observed a direct effect of the socioeconomic index on visuospatial ability and executive function (Supplementary Table 3).
DISCUSSION
In this cross-sectional study with hypertensive participants, we found that higher scores in the socioeconomic index (composed of education, income, occupation, and race) were independently associated with better performance in visuospatial ability, executive function, and global cognition. A higher socioeconomic index was independently associated with a higher parietal lobe volume. However, WMH was not a mediator of the association between socioeconomic index and cognition.
Several studies have shown that hypertension is an important risk factor for cognitive impairment and is associated with lower processing speed and executive function [1, 39]. However, the impact of social factors on cognition in this population has not yet been considered. The idea that social determinants play an important role in health has been gaining traction in recent decades. In 2005, the World Health Organization launched a Commission on Social Determinants of Health to provide evidence and encourage public policies to decrease the impact of social inequalities on people’s health worldwide [9]. In addition, the identification of social determinants in developing countries was particularly encouraged [9], since social inequalities are great in these settings, with rampant poverty affecting millions of people [9, 20]. Thus, understanding the relationship between socioeconomic factors and cognition, especially in large developing countries like Brazil, which have the worst social inequalities in Latin America [40], is of paramount importance.
Socioeconomic status, usually measured by income, education or occupation, is among the most important determinants of health in almost every society worldwide (WHO Health Commission 2008) [41], and they are also the most common social factors associated with cognitive performance [13–15, 42–44]. Both better education and occupation were associated with better global cognitive performance (composed of memory, executive function, visuospatial ability, and language) in participants without dementia [13]. In a large sample of Chinese middle-aged individuals, individuals with higher self-reported financial status and whose parents had a higher education and engaged in non-agricultural work showed better baseline cognitive performance [45]. Other studies have also demonstrated the relationship between better socioeconomic status in childhood and better performance of executive functions later [46]. Similarly, we found an association between the socioeconomic index and visuospatial ability, executive function, and global cognition, but not memory. Memory impairments are commonly associated with neurodegenerative dementia, such as Alzheimer’s disease [47], which can explain the lack of association in the adjusted analysis. Our multivariate analyses also showed an independent relationship between education and visuospatial ability, executive function, and global cognition, and an independent relationship between income and executive function. These results have already been demonstrated in previous studies [14, 15], with education being the individual socioeconomic factor that is most associated with cognitive impairment and dementia [14, 16]. In contrast, we need to highlight that no single socioeconomic variable reflects the complexity of social disadvantages. In addition, the effect of a single socioeconomic variable can often be overestimated when considered alone [48]. Therefore, combining socioeconomic factors may better reflect the cumulative effects of risk on health [49].
Racial and ethnic disparities are associated with higher rates of morbidity and mortality in the United States and globally [18, 50]. According to data from the Brazilian Institute of Geography and Statistics (IBGE), the illiteracy rate and frequency of extreme poverty were higher among black and brown adults. This condition represents a barrier in accessing good education, better jobs, and sufficient income. Thus, understanding the complex ways in which race and socioeconomic status uniquely and in combination contribute to health outcomes is critical [41]. In this context, our results contribute to showing the association of these factors combined in an index and cognitive performance in individuals with hypertension, a disease that affects 32 million Brazilians [51] and is one of the main risk factors for dementia [52]. Poor access to healthcare and low quality of life likely contribute to the association between lower socioeconomic index and worse cognitive performance in our findings, increasing the burden for this vulnerable population. It is important to note that race has no causal effect on brain function. Racism and discrimination greatly contribute to social disadvantages. Another important issue is the non-equivalence of socioeconomic indicators that were combined in the socioeconomic index (e.g., income and education) across racial groups [19, 53]. Considering the above, race can interact with other socioeconomic factors and lead to different effects on health [44, 54].
Many studies have shown associations between socioeconomic status and brain structure [55–57]. However, due to the diversity of these populations and the methodologies used, it is not possible to establish a specific relationship between socioeconomic status and certain brain regions [44]. In our study, we found an association between a higher socioeconomic index and a greater volume of the parietal lobe, a cortical region involved in visuospatial ability and attention [58, 59], as well as some executive functions [60]. However, we did not find an association between the socioeconomic index and the volumes of the other brain lobes. In contrast, Waldstein et al. found that non-Hispanic whites with higher socioeconomic status had greater total brain, white matter, and gray matter volumes compared to white individuals with low socioeconomic status, and African Americans with low and high socioeconomic status [49]. Brain atrophy is usually associated with more severe deterioration, such as neuronal loss and dementia [61], but educational, occupational, and socioeconomic factors have contributed to minimizing cognitive decline, preclinical neurodegeneration, and slowing down the reduction in brain volume due to aging [62]. In particular, neuronal loss in the hippocampus has been linked to Alzheimer’s disease [63, 64], but functional changes in this structure precede structural changes (atrophy) [65], which may possibly explain the lack of association between the socioeconomic index and hippocampal volumes in our sample of individuals without dementia.
The pattern of cognitive changes associated with hypertension involves impairments in processing speed and executive function, a pattern that is more frequently found in cerebrovascular diseases [66]. The pathophysiological mechanisms of hypertension behind this pattern are not fully understood, but they are commonly associated with white matter lesions [67], small vessel diseases [68, 69], and vascular lesions that are responsible for the detrimental effects on brain structure and function [70, 71]. Many studies have shown that WMH are associated with impaired cognitive function [72], especially in individuals with hypertension [73]. Thus, we investigated whether WMH could mediate the relationship between socioeconomic index and cognitive performance. However, we did not find a mediation effect in our sample. Social risk factors seem to be independently associated with brain dysfunction, or vascular lesions other than WMH could indirectly affect this relationship. Another explanation may be that most participants in this subsample had mild effects on the Fazekas scale (72.9%ranged from 0 to 2 on the Fazekas scale), and we did not find evidence of lacunar infarcts in their cortical or cortico/subcortical regions. Although the Fazekas score is widely used to classify WMH [33, 74–76], we did not compare this score with the WHM volume measurements using a computational quantitative program; this needs to be explored in future analyses.
Finally, we must highlight the limitations of the study. First, this was an observational study based on a cross-sectional analysis and it did not establish causation between the socioeconomic index and brain function. In addition, the small size of the sample is an important issue that will be improved with larger future samples. Although we adjusted our analyses for demographic and clinical variables, it is possible that unmeasured confounders were present. The clinical variables needed to be grouped in an index because of the limited sample size compared to the number of adjustments required in the statistical analysis. Thus, we were unable to include each clinical variable in the model. In addition, it was not possible to describe how controlled hypertension was because we did not measure the subjects’ current blood pressures. However, the use of antihypertensive drugs was described, and diuretics were the most frequently prescribed drugs. Finally, only a small subset of the sample underwent MRI evaluation. However, the characteristics of participants who underwent MRI were similar to those who did not undergo MRI, except for household income, which was higher among participants who received MRI, and previous diagnosis of stroke, which was more common among participants who were not evaluated with MRI. Although the Fazekas score is widely used to classify WMH, we did not compare this score with the WHM volume measurements using a computational quantitative program.
In conclusion, we found that higher socioeconomic index scores were associated with better visuospatial ability, executive function, and global cognition. WMH were not mediators of this association. Higher socioeconomic index scores were also associated with a greater parietal lobe volume. These findings suggest that social disadvantages are associated with brain dysfunction in individuals with hypertension or are associated with hypertensive vascular lesions other than WMH.
Footnotes
ACKNOWLEDGMENTS
This work was supported by the Coordenação de Aperfeiçoamento de Pessoal de Nível Superior –Brasil (CAPES) –88882.179915/2018-01, São Paulo Research Foundation (FAPESP) grant 2018/19006-2, and Conselho Nacional de Desenvolvimento Científico e Tecnologico (CNPq) grant 307138/2015-1.