
Abstract
Background:
This is the first longitudinal study to assess regional cerebral blood flow (rCBF) changes during the progression from normal control (NC) through mild cognitive impairment (MCI) and Alzheimer’s disease (AD).
Objective:
We aim to determine if perfusion MRI biomarkers, derived from our prior cross-sectional study, can predict the onset and cognitive decline of AD.
Methods:
Perfusion MRIs using arterial spin labeling (ASL) were acquired in 15 stable-NC, 14 NC-to-MCI, 16 stable-MCI, and 18 MCI/AD-to-AD participants from the Cardiovascular Health Study (CHS) cognition study. Group comparisons, predictions of AD conversion and time to conversion, and Modified Mini-Mental State Examination (3MSE) from rCBF were performed.
Results:
Compared to the stable-NC group: 1) the stable-MCI group exhibited rCBF decreases in the right temporoparietal (p = 0.00010) and right inferior frontal and insula (p = 0.0094) regions; and 2) the MCI/AD-to-AD group exhibited rCBF decreases in the bilateral temporoparietal regions (p = 0.00062 and 0.0035). Compared to the NC-to-MCI group, the stable-MCI group exhibited a rCBF decrease in the right hippocampus region (p = 0.0053). The baseline rCBF values in the posterior cingulate cortex (PCC) (p = 0.0043), bilateral superior medial frontal regions (BSMF) (p = 0.012), and left inferior frontal (p = 0.010) regions predicted the 3MSE scores for all the participants at follow-up. The baseline rCBF in the PCC and BSMF regions predicted the conversion and time to conversion from MCI to AD (p < 0.05; not significant after multiple corrections).
Conclusion:
We demonstrated the feasibility of ASL in detecting rCBF changes in the typical AD-affected regions and the predictive value of baseline rCBF on AD conversion and cognitive decline.
Keywords
INTRODUCTION
The pathological changes of Alzheimer’s disease (AD) develop gradually over a period of decades [1, 2]. The incipient pathological process in AD is critical for determining the risk factors and the selection of primary and secondary prevention therapies. The ideal study would be performed with participants that were followed for many years so that the transition from normal cognition (NC) to mild cognitive impairment (MCI) and AD can be properly examined [3, 4].
Biomarkers for AD including amyloid-β (Aβ42 and Aβ40) and tau (total tau and phosphorylated tau181) proteins are considered the hallmarks for the pathological diagnosis of AD. Serum and lumbar puncture tests for Aβ and tau are available or under development [5, 6].
For decades, neuroimaging biomarkers have been a primary tool in characterizing AD progression. Changes in brain morphometry associated with AD progression (e.g., hippocampal atrophy) were identified using magnetic resonance imaging (MRI) [7–10]. Longitudinal fluorodeoxyglucose (FDG) positron emission tomography (PET) showed that progressive glucose metabolism changes can be observed years before clinical symptoms of MCI or AD [11–22].
PET studies measured the distribution of Aβ and tau in the brain a decade or more before clinical symptoms occurred in patients carrying the familial forms of AD [2]. However, measurements of Aβ and tau may not be sensitive to disease progression in the sporadic forms of AD [23–29], possibly because the concentration of these biomarkers reach a plateau before the appearance of brain atrophy, brain metabolic deficit, and cognitive symptoms. Combinations of AD biomarkers were useful in predicting incident dementia [29–32].
Arterial spin labeling (ASL) MRI [33, 34] offers a noninvasive quantitative measure of cerebral blood flow (CBF) using arterial blood water as an endogenous tracer. The main advantage of the ASL technique is that it does not involve any intravenous contrast agents, ionizing radiation, or radioactive isotopes. ASL has proven to be sensitive to regional CBF (rCBF) deficits in early-stage AD in cross-sectional studies [3, 35–46] and normal aging in longitudinal studies [47]. When compared with FDG-PET, ASL MRI can identify regional deficits in similar regions with comparable diagnosis accuracy and discriminative power without the high cost and ionizing radiation associated with PET [42–44, 48–50]. Abnormal rCBF was associated with incident AD in MCI patients [37]. A preliminary ASL longitudinal study in the MCI and AD stages has been noted [51]. In the longitudinal study herein, we explore the ASL CBF progression trajectory from NC to MCI to AD.
METHODS
Study population
The Cardiovascular Health Study (CHS) Cognition Study (CHS-CS) is an ancillary study of the CHS that followed 532 participants from 2002 to 2013 who were non-demented in 1998-99 [52]. Between 2002 and 2009, 195 of the CHS-CS participants received structural and perfusion MRIs at baseline. They had yearly neuropsychological assessments and Modified Mini-Mental State Examinations (3MSE). The 3MSE scores [53] were used to assess the general cognitive ability for the population. The 3MSE has been shown to have increased sensitivity in detecting dementia in comparison to the Mini-Mental State Examination (MMSE) [54, 55].
The subjects were classified as NC, MCI, or AD based on cognitive status adjudications [56] without verification of amyloid deposition. The CHS-CS diagnostic criteria for MCI included both MCI-amnestic and MCI-multiple cognitive domain types [56]. The baseline characteristics of the CHS-CS cohort at the Pittsburgh site and abnormal rCBF patterns in MCI and AD patients were previously reported [38, 58]. Exclusion and adjudication criteria for the CHS-CS subjects were previously published [38]. The exclusion details for the ASL perfusion MRI analysis were listed in the cross-sectional study [59]. Based on the exclusion criteria, 148 participants (58 NC subjects, 50 MCI patients, and 40 AD patients) had ASL perfusion MRIs at baseline. Sixty-three of the 148 participants had at least two perfusion MRIs. Two participants had four perfusion MRIs, 13 participants had three perfusion MRIs, and 48 participants had two MRIs. Covariance estimation in the statistical analysis was unreliable when including the third and fourth MRIs due to their small number. Therefore, the longitudinal analysis included only the first two MRIs for each participant with classifications: 15 stable-NC, 14 NC-to-MCI, 16 stable-MCI, and 18 MCI/AD-to-AD (9 MCI-to-AD, 9 stable-AD) participants. Initial longitudinal groups (e.g., NC-to-MCI group) were divided according to the first two MRIs except as noted. To maintain relatively balanced numbers across the classification groups, the first two MRIs were replaced by the second and third MRIs for four participants and by the third and fourth MRIs for one participant. To maximize the number of MCI participants in the predictive and discriminative analysis from MCI to AD, we used 30 MCI participants (including 16 stable-MCI and 9 MCI-to-AD participants) by adding five participants with a subsequent MCI diagnosis (participants from the 15 stable-NC and 14 NC-to-MCI group but having multiple perfusion MRI scans).
The diagnostic class at the date for perfusion MRI was interpolated using the nearest neighbor between yearly adjudications. 3MSE scores were calculated by using linear interpolation of the 3MSE scores before and after the target date (the date for the perfusion MRI scan), and by using the same 3MSE score if a 3MSE score was available only before the target time and the participant had the same diagnostic class at the next adjudication date.
Image acquisition
All MRI scans were conducted at the University of Pittsburgh MR Research Center using a dedicated GE Signa 1.5 T MRI (LX Version). All subjects or their caregiver signed written informed consent approved by the institutional review board (IRB). A quadrature transceiver head coil was used for image acquisition. High-resolution sagittal structural images were acquired using 3D T1-weighted spoiled gradient recalled echo (SPGR) images. Perfusion MRI was performed using multi-slice continuous arterial spin labeling (CASL) with double adiabatic inversion [38, 61] and axial echo planar image (EPI) acquisition. The detailed pulse sequence parameters can be found in Dai et al. [61].
CBF map extraction
The CBF maps were generated from the CASL difference images using the kinetic model [38, 62] with a gray matter (GM) T1 of 1.2 s [63] and an inversion efficiency calculated using the arterial velocities and B1 measured at the label plane [38, 61]. Example CBF maps from each group of NC, MCI, and AD subjects are shown in Supplementary Figure 1. CBF maps can differ between groups either because brain tissue volumes or the CBF per volume of tissue vary. Brain tissue loss (atrophy) was reported in AD using structural neuroimaging (see a review [64]). We calculated the CBF maps with partial volume (atrophy) correction (PVC) to isolate the CBF values independent of brain tissue atrophy. The CBF map with PVC was calculated by dividing the CBF mask by the voxel-wise gray matter fraction map in the ASL data space, which was derived by registering the segmented gray matter map in the T1 data space to the mean of the perfusion-weighted images (ASL difference images between control and label conditions) for each subject. The PVC assumes that the white matter does not contribute to the CBF signal of the voxel at 1.5 T. Both the CBF maps without and with PVC were analyzed separately in the following statistical analysis. The subject CBF maps were normalized to a standard space using SPM8 (Wellcome Trust Centre for Neuroimaging) with the GM images segmented from the high-resolution structural MRIs as an intermediate [65]. To improve the segmentation and ensuing spatial normalization quality, the “New Segment” method in SPM8 was used to generate GM images from the structural MRIs. The CBF maps were smoothed using a Gaussian kernel with full width at half maximum (FWHM) of 6 mm.
Longitudinal analysis
The longitudinal analysis was performed on ten regions of interest (ROIs), which were defined from our baseline cross-sectional study [59]. Ten ROIs (see the Supplementary Material for the method defining the ROIs and Supplementary Figure 2 for their precise locations) were: right hippocampus (RH), left hippocampus (LH), bilateral superior medial frontal (BSMF), right temporoparietal (RTP), left temporoparietal (LTP), right inferior frontal and insular (RIFI), left inferior frontal and insular (LIFI), right inferior parietal (RIP), bilateral posterior and middle cingulate and parietal regions (BPMP), and bilateral posterior cingulate extending to precuneus (BPCP). The rCBF values at baseline and the follow-up were calculated for each subject in the longitudinal analysis (63 participants) as the average rCBF within each target ROI. The longitudinal change in rCBF was calculated as the difference of the normalized rCBF between baseline and follow-up. The normalized rCBF at baseline and follow-up was calculated as the ratio of rCBF value to the corresponding global CBF value. The global CBF was calculated as the average CBF over the GM mask. The normalized rCBF was used in the longitudinal analysis because it was shown more sensitive than the absolute rCBF to the group comparisons and association with 3MSE in our cross-sectional results [59].
The longitudinal CBF changes between the baseline and follow-up for the stable-NC, NC-to-MCI, stable-MCI and MCI/AD-to-AD groups, and the difference between the longitudinal CBF changes among the four groups were performed using a multiple linear regression model adjusting for the effects of age, gender, and time of follow-up. To assess whether the regional baseline CBF can differentiate the NC conversion to MCI and the MCI conversion to AD, multiple linear regression models were used by accounting for the effects of age and gender. To evaluate whether the baseline rCBF can predict cognitive decline, post-hoc partial correlation coefficients between the 3MSE scores at follow-up and the baseline CBF were calculated with age, gender and time of follow-up as covariates. To explore whether the longitudinal changes of rCBF are associated with longitudinal cognitive changes, post-hoc partial correlation coefficients between the longitudinal changes in 3MSE scores and the longitudinal CBF changes were calculated with age, gender, and time of follow-up as covariates.
Logistic regression was used to examine whether the event of conversion can be predicted by the baseline rCBF values after controlling for age and gender. Stepwise forward logistic regressions were used to examine the combined and incremental accuracy of the baseline rCBF values as predictors of conversion. The reliability of the prediction models was assessed by the leave-one-out cross-validation method. Cox survival regression models [66] were used to estimate the hazard ratio (HR) and examine whether the probability of time to conversion can be predicted by the baseline rCBF values after controlling for age and gender. The HR of each rCBF was evaluated separately with age and gender as covariates. Stepwise variable selection method was used to examine the combined likelihood of the baseline rCBF values as predictors of conversion time. The likelihood-ratio tests were used to decide the forward inclusion (p = 0.2) and backward exclusion (p = 0.1).
Family-wise error (FWE) corrections were performed to guard against false positives from the multiple comparisons [67] by following the procedures: (a) order the p values from the lowest to highest p1, p2, . . . , p m ,where m is the total number of hypotheses tested (m = 12 regions); (b) for a given α= 0.05, seek the largest k such as p k ≤/(m - k + 1); and (c) p1, . . . , p k were the significant p values after FWE correction.
RESULTS
Table 1 summarizes the subjects’ demographics and scores at the time of the baseline and follow-up MRIs. We found no differences between baseline age, gender, education, hypertension, diabetes, the presence of heart disease, and the time of follow-up among the four groups. Subjects in the MCI/AD-to-AD group had lower 3MSE scores at baseline and larger decreases in 3MSE scores at the follow-up than the other groups.
Demographic and cognitive scores at baseline and follow-up. The difference between two time points was calculated by subtracting baseline values from follow-up values
*3MSE scores were not completed for all the subjects at the follow-up. The actual number of subjects with the 3MSE scores measured is indicated inside the brackets.
Longitudinal changes of rCBF between baseline and follow-up scans
Compared to the corresponding baseline, a significant rCBF decrease was detected in the BPCP in the stable-NC follow-up (p = 0.040 and 0.023, without and with PVC, respectively), NC-to-MCI follow-up (p = 0.029 and 0.015, without and with PVC, respectively), stable-MCI follow-up (p = 0.031 and 0.018, without and with PVC, respectively), and MCI/AD-to-AD follow-up (p = 0.032 and 0.019, without and with PVC, respectively). However, the rCBF decreases in the BPCP region were not significant after FWE correction.
Comparison of longitudinal rCBF change among four groups
Compared to the stable-NC group: the NC-to-MCI group exhibited significantly stronger rCBF decreases in the BPMP region (p = 0.011 and 0.020, without and with PVC, respectively); the stable-MCI group exhibited stronger rCBF decreases in the RTP, RIFI, and RIP regions (p = 0.0001, 0.0094, 0.044; and 0.0001, 0.011, 0.11, without and with PVC, respectively); and the MCI/AD-to-AD group exhibited significantly stronger rCBF decreases in the RTP, LTP and BPMP regions (p = 0.0035, 0.00062, 0.028; and 0.0058, 0.0018, 0.030, without and with PVC, respectively) (Fig. 1). Compared to the NC-to-MCI group: the stable-MCI group exhibited stronger rCBF decreases in the RTP, RIFI, and RH regions (p = 0.012, 0.049, 0.0053; 0.011, 0.054, 0.010, without and with PVC, respectively); and the MCI/AD-to-AD group exhibited significantly stronger rCBF decreases in the LTP region (p = 0.015 and 0.041 without and with PVC, respectively) (Fig. 1A without PVC and Fig. 1B with PVC). After FWE correction, only the rCBF decreases in the RTP, LTP, RH, and RIFI (RTP and LTP with PVC) were significant. Compared to the stable-NC group: the stable-MCI group exhibited stronger rCBF decreases in the RTP and RIFI (RTP with PVC) regions; and the MCI/AD-to-AD group exhibited significantly stronger CBF decreases in the RTP and LTP (RTP and LTP with PVC) regions. Compared to the NC-to-MCI group, the stable-MCI group exhibited stronger CBF decreases in the RH region.

Z scores of normalized longitudinal rCBF changes in the NC-to-MCI, stable-MCI, and MCI/AD-to-AD subjects relative to stable-NC subjects: A) without PVE correction and B) with PVE correction. The significance level is represented by *(0.01 ≤ p ≤ 0.05) and **(p ≤ 0.01). Red stars (*) represent the significant differences after FWE correction. RIFI, right inferior frontal and insular; RIP, right inferior parietal; LTP, left temporoparietal; RTP, right temporoparietal; BPMP, bilateral posterior and middle cingulate and parietal; RH, right hippocampus.
Discriminative value of baseline rCBF and rCBF changes
MCI subjects who converted to AD showed significantly lower baseline rCBF in the BPCP region (p = 0.0069 and 0.018, without and with PVC, respectively) compared to nonconverters at the two-year follow-up. MCI subjects who converted to AD showed significantly lower baseline rCBF in the BSMF region (p = 0.041 and 0.051, without and with PVC, respectively) compared to nonconverters at the four-year follow-up. Normalized baseline rCBF in the BPCP region revealed very good discrimination between the MCI subjects who converted to AD and nonconverters at the two-year follow-up (accuracy = 87%) (Fig. 2) although it was not significant after FWE correction. Only two subjects in each group were misclassified based on rCBF. However, we did not find any significant differences for either the rCBF changes in the other regions between MCI nonconverters and MCI converters (to AD), or the baseline rCBF and rCBF changes in all the regions between NC nonconverters and NC converters (to MCI).
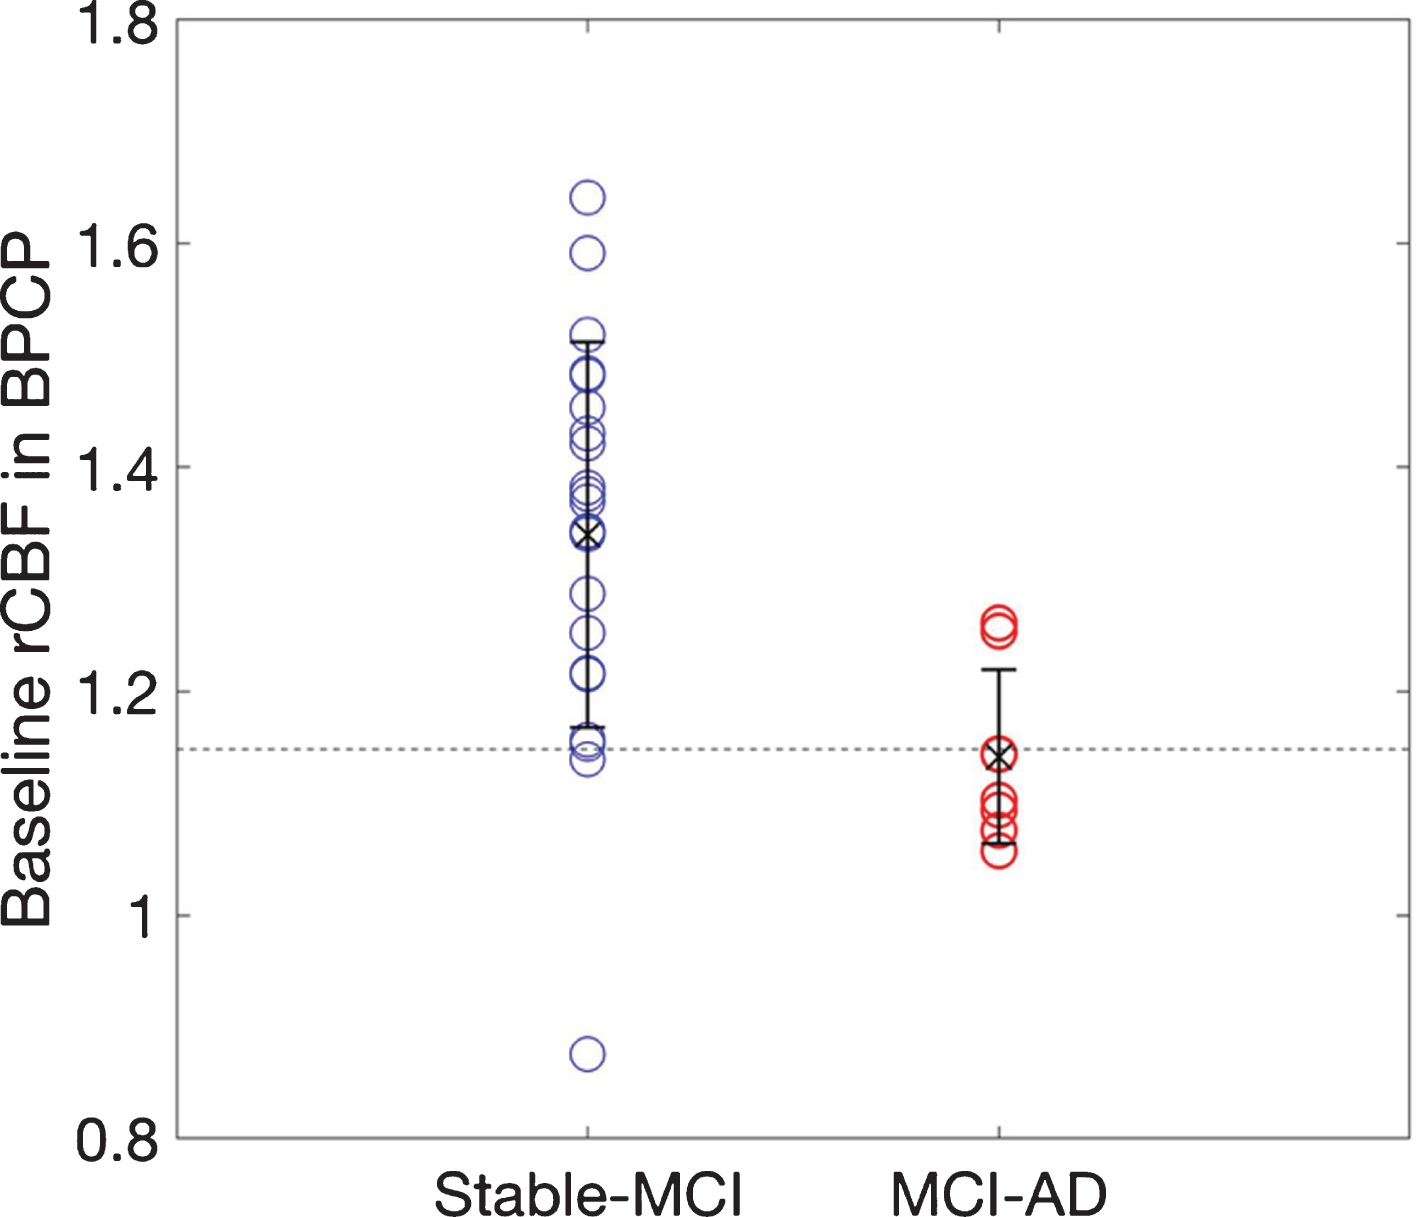
A comparison of the baseline rCBF in the BPCP for the MCI-to-AD and stable-MCI groups, which were defined at the two-year follow-up. The MCI-to-AD group had smaller rCBF values at the baseline compared to the stable-MCI group. Regional CBF values were normalized relative to global CBF values and adjusted for age and gender.
Predictive value of baseline rCBF for conversion of MCI to AD
The baseline normalized rCBF in the BPCP region was a significant predictor for the two-year (p = 0.020 and 0.031, without and with PVC, respectively) and three-year (p = 0.015 and 0.028, without and with PVC, respectively) follow-ups. The baseline normalized rCBF in the BSMF region was a significant predictor for the six-year (p = 0.023 and 0.030, without and with PVC, respectively) and seven-year (p = 0.039 and 0.049, without and with PVC, respectively) follow-ups, respectively. However, the rCBF values in the BPCP and BSMF regions were not significant after FWE correction. When using the stepwise logistic regression model, the baseline rCBF values in the BPCP, BSMF, and RH regions predicted the conversion of MCI to AD with 93%and 93%(86%and 96%with PVC, respectively) accuracy at the two-year and three-year follow-ups, respectively. The baseline rCBF values in the BPCP and BSMF regions predicted the conversion of MCI to AD with 83%and 81%(81%and 81%with PVC, respectively) accuracy at the four-year and five-year follow-up, respectively. The baseline rCBF values in the BSMF region predicted the conversion of MCI to AD with 92%and 88%(88%and 92%with PVC, respectively) accuracy at the six-year and seven-year follow-ups, respectively.
Predictive value of baseline rCBF for time to conversion
The baseline normalized rCBF values in the BPCP (HR = 0.89, p = 0.049 without PVC; HR = 0.90, p = 0.092 with PVC) and BSMF (HR = 0.81, p = 0.020 without PVC; HR = 0.81, p = 0.020 with PVC) were statistically significant predictors for time to conversion. However, the rCBF values in the BPCP and BSMF regions were not significant after FWE correction. When using the Cox variable selection model, a final model with the baseline normalized rCBF values in the BPCP (p = 0.012) and BSMF (p = 0.0077) significantly predicted the time to conversion from MCI to AD. The prediction model (Fig. 3) showed that a baseline normalized BPCP rCBF of 1.28 and BSMF rCBF of 1.18 (corresponding to the baseline average of the entire MCI group with follow-up) predicted the median time to conversion to be 5.9 years. The predicted time to decline was 7.6 years for a baseline normalized BPCP rCBF of 1.33 and BSMF rCBF of 1.20 (corresponding to the baseline average of the stable-MCI group at the two-year follow-up). The predicted time to decline was 2.9 years for a baseline normalized BPCP rCBF of 1.14 and BSMF rCBF of 1.12 (corresponding to the baseline average of MCI-to-AD group at the two-year follow-up).
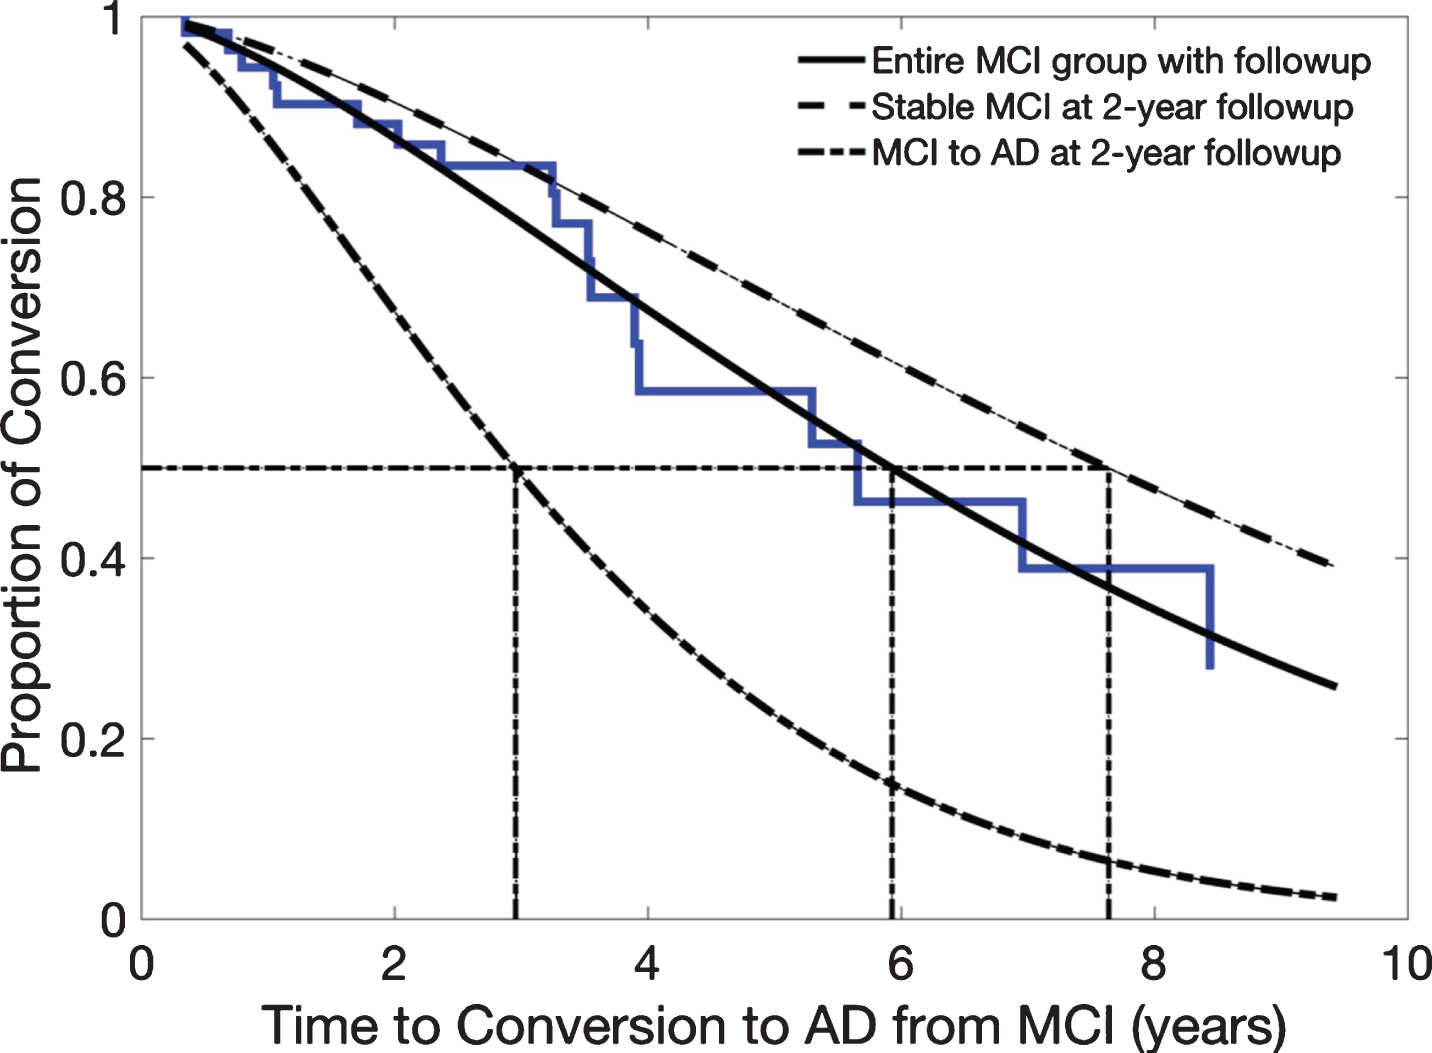
Baseline rCBF values and the risk for conversion from MCI to AD. The baseline rCBF values at BPCP and BSMF were statistically significant predictors for time to conversion from MCI to AD. The prediction model shows that the mean baseline rCBF values from the entire MCI group with follow-up (plain line fitted with Weibull function) predicted the time to conversion to AD was 5.9 years. The mean baseline rCBF values from the stable-MCI group at the two-year follow-up (dashed line) predicted the time to conversion to AD was 7.6 years, and the mean baseline rCBF values from the MCI-to-AD group at the two-year follow-up (dotted and dashed line) predicted the time to conversion to AD was 2.9 years. The mean estimated time to conversion to AD for each group is indicated with dotted lines.
Correlation of baseline rCBF with 3MSE at follow-up
For all of the subjects, the 3MSE score at follow-up was correlated with the baseline normalized rCBF in the BPCP (r = 0.38, p = 0.0043 without PVC; r = 0.36, p = 0.0070 with PVC) (Fig. 4a), BPMP (r = 0.36, p = 0.0075 without PVC; r = 0.35, p = 0.0083 with PVC), LIFI (r = 0.34, p = 0.010 without PVC; r = 0.33, p = 0.015 with PVC), BSMF (r = 0.33, p = 0.012 without PVC; r = 0.32, p = 0.019 with PVC) (Fig. 4b), and LH (r = 0.30, p = 0.026 without PVC; r = 0.31, p = 0.021 with PVC) regions. After FWE correction, the 3MSE correlations were still significant in all of the above regions except LH without PVC, but not significant in any of these regions with PVC. For the subjects with AD progression (all of the subjects excluding those in the stable-NC group), the 3MSE score at follow-up was correlated with the baseline normalized rCBF in the BPCP (r = 0.39, p = 0.011 without PVC; r = 0.37, p = 0.016 with PVC) (Fig. 4c), BPMP (r = 0.48, p = 0.0014 without PVC; r = 0.47, p = 0.0017 with PVC), LIFI (r = 0.45, p = 0.0032 without PVC; r = 0.43, p = 0.0050 with PVC), BSMF (r = 0.44, p = 0.0043 without PVC; r = 0.42, p = 0.0057 with PVC) (Fig. 4d), and LH (r = 0.31, p = 0.050 without PVC; r = 0.31, p = 0.049 with PVC) regions. After FWE correction, the 3MSE correlations were still significant in all of the above regions except LH without and with PVC.
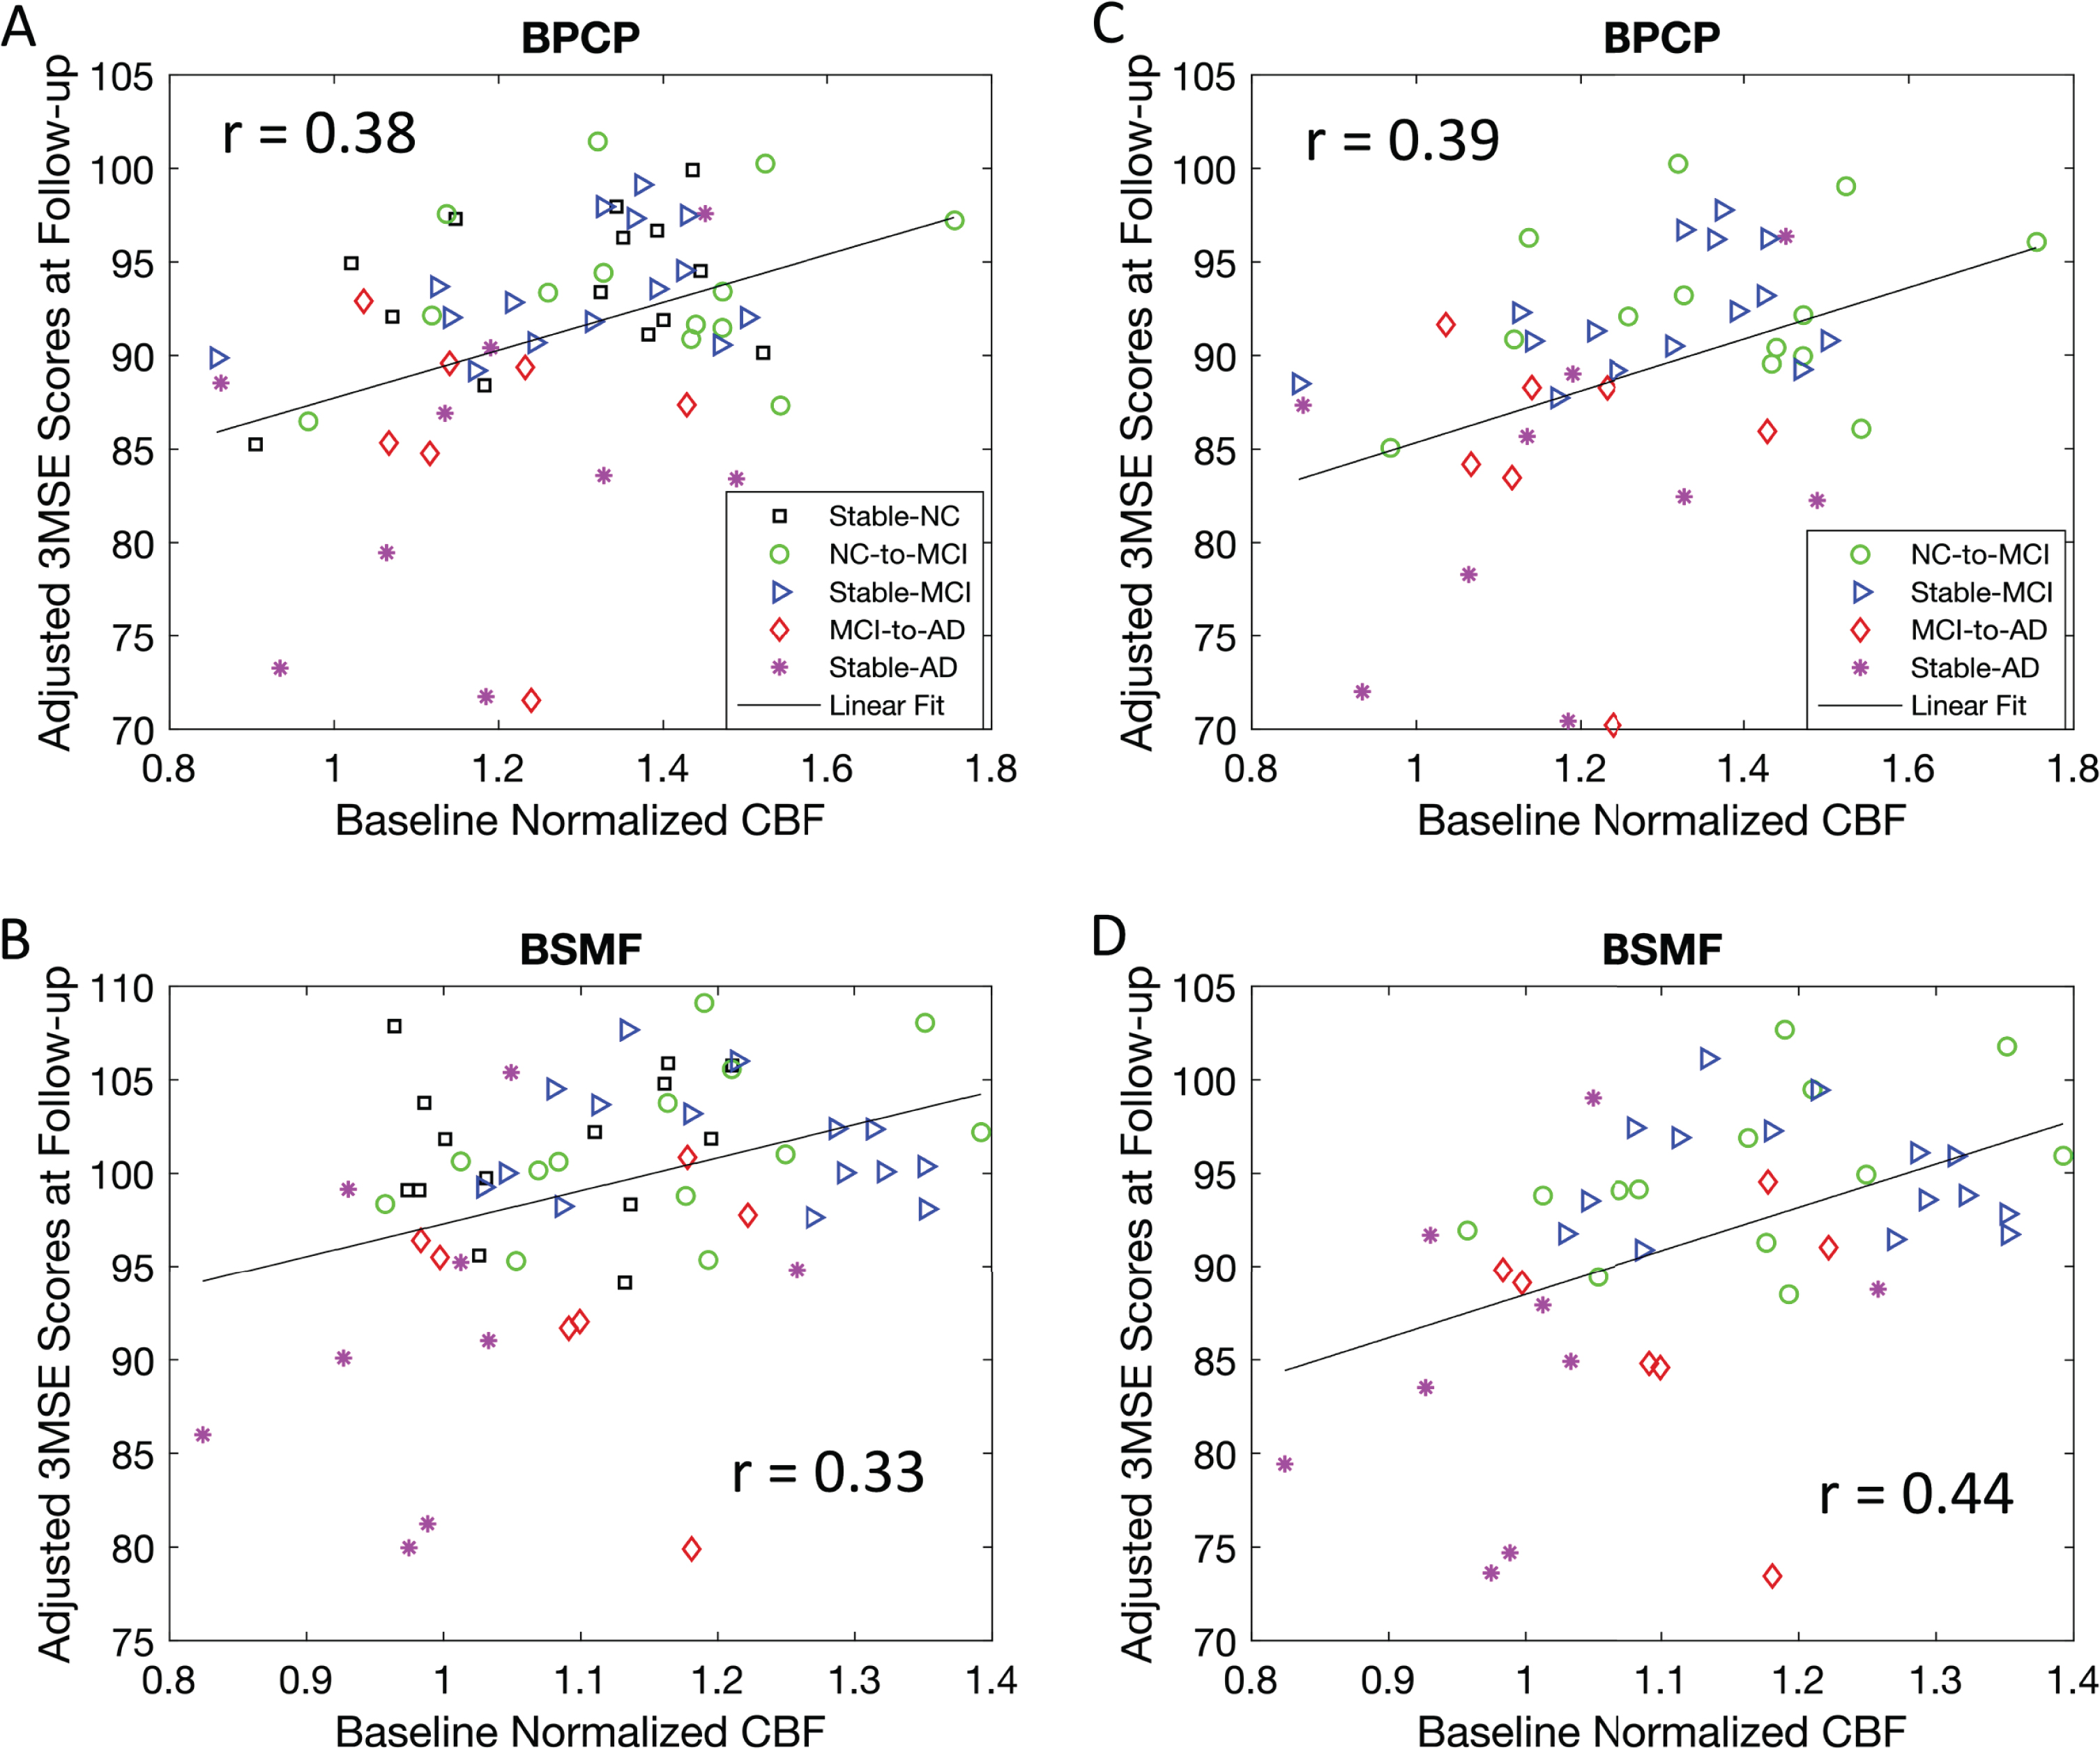
Correlation of baseline normalized rCBF values with adjusted 3MSE scores at the mean follow-up time and mean age of the group. Greater 3MSE scores at the follow-up was associated with a larger baseline rCBF after adjusting for age, gender, and follow-up time in the BPCP and BSMF regions using (A,B) all subjects and (C,D) all subjects except the stable-NC group of the longitudinal study. Note that three participants (one MCI and two ADs) had very low 3MSE scores (their raw 3MSE scores were 72).
Correlation of longitudinal rCBF changes with longitudinal 3MSE changes
For all of the subjects, the longitudinal 3MSE changes were correlated with the longitudinal rCBF changes in the RIP (r = 0.37, p = 0.0058 without PVC; r = 0.39, p = 0.0030 with PVC) (Supplementary Figure S3), while the correlation was not significant for the subjects with AD progression (all the subjects excluding those in the stable-NC group). Moreover, the rCBF association in the RIP region was not significant without PVC but significant with PVC (p = 0.0030) after FWE correction for all subjects.
DISCUSSION
We demonstrated that there were stronger longitudinal rCBF decreases in the bilateral temporoparietal regions for the MCI/AD-AD group and in the right temporoparietal and right inferior frontal and right hippocampus regions for the stable-MCI group even after correction for multiple comparisons. These findings extend the current literature (to a longitudinal study) for rCBF deterioration in the regions involved in the process of AD progression. The FDG-PET studies have shown abnormal glucose metabolic rate (MRglc) reductions from at-risk participants (e.g., APOE4 carriers) to advanced AD that were most prominent in the temporoparietal, posterior cingulate, and prefrontal areas [11, 69], and sometimes in the hippocampus [15, 70] regions. Considering the close correlation between MRglc consumption and rCBF, the FDG-PET studies are lending support to our study findings.
We found generally less sensitive rCBF changes in group comparisons and less sensitive predictive/discriminative values from baseline rCBF after PVC. The disappearance or reduced significance of the CBF changes in the right inferior parietal (stable-MCI versus stable-NC) and right hippocampus and right inferior frontal and insula (stable-MCI versus NC-to-MCI) regions after PVC shows significant atrophy during the progression of AD. Marked atrophy of the frontal, inferior parietal, and hippocampus regions were reported in MCI and AD in a larger multisite CHS study [71] and as a biomarker in preclinical AD [72, 73], which also confirms the effectiveness of the applied PVC method in filtering out the cortical atrophy. Interestingly, after PVC, rCBF decreases in the posterior cingulate region were shown with larger significance (consistently smaller p values) in the follow-up of stable-NC, NC-to-MCI, stable-MCI, MCI/AD-to-AD groups compared to the baseline. These results indicate that the posterior cingulate region suffers from consistent independent-of-atrophy CBF decreases and various atrophy rates across individuals within each group during the longitudinal progression of AD. The findings further suggest that rCBF with PVC in the posterior cingulate region is a promising biomarker in tracing individual AD progression.
We showed a stronger longitudinal rCBF decrease in the posterior cingulate region (although it is not significant after multiple comparisons) when the participants transitioned from normal cognition to MCI compared to stable normal controls. The posterior cingulate hypoperfusion may be more evident in clinically detected MCI patients (e.g., using a more sensitive ASL technique or higher field magnet) and precedes the clinical manifestation of AD. This observation is in agreement with our previous cross-sectional ASL results in MCI patients [38]. Most of the PET literature in MCI comparing amnestic MCI with normal controls showed changes in the posterior cingulate and temporal regions [11, 74]. Some studies in non-amnestic MCI patients showed the relative absence of cortical hypometabolism or hypometabolism in several other brain regions [15, 75–78]. Taken together, the reduction of rCBF in the posterior cingulate in amnestic MCI patients implies their higher risk to develop AD versus non-amnestic MCIs. The MCI subjects in our study included both amnestic and multiple cognitive domain types (see MCI classification details [57]) and hence the longitudinal reduction in the posterior cingulate region may be affected.
The significant rCBF differences at the time of the initial MCI stage between stable-MCI patients and MCI-to-AD patients suggest that the rCBF at the posterior cingulate region is discriminative for the MCI patients who convert to AD and those who do not convert at two-year follow-up. This is of great clinical significance because it allows for the identification of patients for AD treatment options. In contrast, the 3MSE scores at the initial MCI stage were not as sensitive as the initial rCBF values for identifying the converting versus stable groups (results not shown). However, we did not observe the initial rCBF differences between stable NCs and NC-to-MCI patients. Progression of hypoperfusion in the posterior cingulate region from NC to MCI was observed and was comparable with stable-NCs at the group level, but the MCIs who were converters (to AD) experienced faster perfusion reductions from normal cognition compared to MCI nonconverters. Therefore, our results indicate that the hypoperfusion in the posterior cingulate region was incipient to the MCI stage. These results are consistent with the FDG PET prediction studies that reported hypometabolism in posterior cingulate regions in MCI patients with three years of decline to AD when compared with stable-MCI patients [11–13, 74]. In summary, our results strongly suggest that in the conversion from MCI to AD, rCBF changes in the posterior cingulate region occur in advance of MCI and other regional changes.
The baseline rCBF values in the posterior cingulate, superior medial frontal, inferior frontal regions were associated with 3MSE scores at follow-up for all of the groups, and the groups except the stable NCs (those on the AD pathophysiology) after adjusting for age, gender, and time of follow-up (even after correction of multiple comparisons). Baseline metabolism in the prefrontal regions has been demonstrated to predict the cognitive decline (MMSE) in normal aging [17]. Baseline rCBF in the prefrontal and posterior cingulate/precuneus regions could predict cognitive decline (episodic memory and selective attention) of MCI patients [37]. The baseline rCBF values in the posterior cingulate, superior medial frontal, inferior frontal regions could be promising biomarkers to predict cognitive performance for both normal elderly and symptomatic patients.
Logistic regression and Cox regression analyses identified baseline rCBF values at the bilateral superior medial frontal and posterior cingulate regions as significant predictors for conversion from MCI to AD consistently (although not significant after multiple corrections). The findings are in line with a previous report of reduced rCBF in the prefrontal and posterior cingulate cortices in MCI subjects who converted to AD compared to nonconverters [79–81], and also agrees with studies of the predictive power of baseline rCBF and metabolism at medial frontal and posterior cingulate regions [12, 37]. It is worth noting that the hippocampus regions in the accumulative Cox regression model are not significant predictors for time to conversion. In contrast, logistic regression showed that the right hippocampus region was not a significant predictor for conversion status but had incremental predictive power for the two-year and three-year follow-ups. Although the hippocampus is known as the first target region in AD [19], our results suggest its limited value in prediction of AD conversion. These logistic regression results suggest that the posterior cingulate region is a major predictor for the progression status in two to three years and the superior medial frontal is a major predictor for the progression status in six to seven years. These findings are also consistent with the discriminative power of these two regions. Hence, rCBF in the posterior cingulate region is more sensitive to short-term AD progression, while rCBF in the middle frontal region is more sensitive to long-term AD progression.
There are limitations in this study. First, the small sample size and the ensuing reduced power in the longitudinal study may have affected our ability to detect existing associations between the progression of AD and the change of CBF/3MSE scores. Second, the lost follow-up of perfusion imaging scans from MCI and AD subjects were relatively large. Therefore, the MCI-to-AD and AD-to-AD groups had to be combined into one group to increase the statistical power. Third, selecting 10 regions in the longitudinal analysis and the ensuing multiple comparisons limits our ability in detecting statistical significance. This study serves as an exploratory study for investigating the capability of ASL in detecting longitudinal changes. Further studies can select smaller numbers of targeted regions in AD progression. Fourth, we observed asymmetrical patterns of longitudinal CBF changes. For instance, the stable-MCI group exhibited stronger CBF decreases in the right temporoparietal, right inferior frontal, and right hippocampus. The exact cause is unclear but potentially contributed from asymmetrical labeling efficiency between the left and right carotid and vertebral arteries in the CASL technique because of poorly chosen locations of labeling planes (e.g., not orthogonal to both carotid arteries). Another potential cause is that it may be related to handedness and multilingual background. However, we do not have a sufficient number of subjects to explore the possibility. Fifth, hippocampal CBF values had limited value in the prediction of AD conversion. The perfusion images were acquired with 2D EPI from superior to inferior and suffered marked signal dropout in the hippocampal regions due to tracer decay and susceptibility artifacts. The largely reduced signal-to-noise ratio (SNR) in these regions could have affected the ability of hippocampal CBF in AD prediction. Last, the CBF images were acquired using the CASL technique at 1.5 T before the advent of pCASL and 3 T whole brain perfusion MRI [82] that can yield higher SNR. However, despite the low number of subjects and less sensitive technique with reduced SNR in the longitudinal study, the rCBF deficits during the entire AD progression were detectable. The baseline rCBF at the medial frontal and posterior cingulate regions was associated with the 3MSE scores at follow-up and conversion from MCI to AD.
Footnotes
ACKNOWLEDGMENTS
The CHS data was supported by grants AG20098 and AG15928 from the National Institute on Aging (NIA) and by contracts N01-HC-85239, N01-HC-85079 through N01-HC-85086, N01-HC-35129, N01 HC-15103, N01 HC-55222, N01-HC-75150, N01-HC-45133, and grant HL080295 from the National Heart, Lung, and Blood Institute (NHLBI), with additional contributions from the National Institute of Neurological Disorders and Stroke (NINDS). A full list of principal CHS investigators and institutions can be found at CHS-NHLBI.org. The research was also supported by the State University of New York at Binghamton, the Nevada Cancer Institute, the University of Pittsburgh, and Washington University in St. Louis. Weiying Dai was supported by R01AG066430. Grace D. Zhou, affiliated with Vestal High School, Vestal, NY, USA, conducted her research in the Department of Computer Science when she was a visiting research assistant in Weiying Dai’s research group.