
Abstract
The consistency of cerebrospinal fluid amyloid-β (Aβ)42/40 ratio and Aβ42 has not been assessed in the AT(N) classification system. We analyzed the classification changes of the dichotomized amyloid status (A+/A–) in 363 patients tested for Alzheimer’s disease biomarkers after Aβ42 was superseded by the Aβ42/40 ratio. The consistency of Aβ42 and the Aβ42/40 ratio was very low. Notably, the proportions of “false” A+T–patients were considerable (74–91%) and corresponded mostly to patients not clinically diagnosed with Alzheimer’s disease. Our results suggest that the interchangeability of Aβ42/40 ratio and Aβ42 is limited for classifying patients in clinical setting using the AT(N) scheme.
INTRODUCTION
In 2018, the US National Institute on Aging and the Alzheimer’s Association proposed a biological definition and diagnosis of Alzheimer’s disease (AD) based on abnormal amyloid and phosphorylated tau (P-tau) biomarkers [1]. It was suggested that neuroimaging and cerebrospinal fluid (CSF) biomarkers can be compiled in the AT(N) classification system with A meaning amyloid (A), T tauopathy, and (N) neurodegeneration [1]. In these guidelines, CSF amyloid-β 42 (Aβ42) and the Aβ42/40 ratio are considered interchangeable to establish entry in the AD continuum. However, the Aβ42/40 ratio is recognized as a better amyloid biomarker than Aβ42 alone [2], and shows less sensitivity to non-AD-related pathologic changes and pre-analytic factors [2, 3], and superior accuracy for the prognosis and diagnosis of AD [4]. It is therefore of major interest to assess the consistency of Aβ42 and the Aβ42/40 ratio. Although the AT(N) system was not designed for clinical practice [1], we analyzed the classification changes after Aβ42 was superseded by the Aβ42/40 ratio.
METHODS
We recruited all patients who had a CSF sample collected by lumbar puncture during a routine workup of cognitive decline between January 2015 and August 2019 at the Neurology Department of the Toulouse Memory Clinic (France). All subjects with subjective or mild cognitive impairment and dementia were included. Exclusion criteria were: 1) unavailable Aβ42, Aβ40, P-tau, or tau biomarkers; 2) lumbar puncture performed for other indications besides AD biomarker analysis; 3) tau > 1200 pg/mL associated with acute vascular events, traumatic brain injury or status epilepticus. Only one result per subject was considered. Diagnosis was established as: “AD”, “Non-AD”, or “Other” using international and validated criteria after the clinician was informed of the biomarker results, including the Aβ42/40 ratio when possible. Non-AD patients included all other neurodegenerative diseases besides AD (frontotemporal lobar degeneration, Lewy body disease, Parkinson’s disease, Creutzfeldt-Jacob’s disease, etc.). Other included all other conditions besides neurodegenerative diseases (psychiatric disease, cerebrovascular pathology, epilepsy, encephalopathy, etc.). All patients gave their informed consent, and the study was approved by the French National Commission for Informatics and Liberties (CNIL number: 2206723v0). CSF samples were collected in polypropylene tubes (Greiner bio-one), centrifuged immediately after their receipt (3500 g, 10 mn, 4°C), aliquoted, and frozen at –20°C until assayed (< 2 weeks). Aβ42, Aβ40, P-tau, and tau were measured using commercial assays (INNOTEST, Fujeribo, Ghent, Belgium) according to the manufacturer’s procedures. Intra-assay variability was controlled according to manufacturer’s recommendations. The laboratory also participated in the external quality control program by the Alzheimer’s Association. AD biomarker profiles were specified for each patient by applying the AT(N) classification system [1] using cutoff values recommended by the manufacturer and used in previous publications [5]: A+ was defined as Aβ42 < 500 pg/mL and T+ as P-tau > 60 pg/mL. (N) was not included in the analyses as non-specific to AD [1]. Up until December 2018, Aβ40 dosing was performed only for patients with A+T–and A–T+ profiles as previous reports had failed to show the clinical utility of using the Aβ42/40 ratio when Aβ42 and P-tau are congruent [5]. Starting in January 2019, Aβ40 dosing was performed systematically following recent recommendations [4]. Patients were assigned to two groups according to these periods: one cohort referred to as patients with selective Aβ42/40 ratio evaluation (i.e., samples from 2015–2018), and one cohort referred to as patients with systematic Aβ42/40 ratio evaluation (i.e., samples from 2019). An Aβ42/40 ratio < 0.05 was considered abnormal [5]. When the Aβ42/40 ratio and Aβ42 values were congruent, we used the Aβ42/40 ratio as reference to classify patients as “true” A+ or “true” A–. For example, for “true” A+ patients, both Aβ42 value and Aβ42/40 ratio were abnormal. When Aβ42 values and Aβ42/40 ratio were incongruent, Aβ42/40 ratio was used as the reference to classify patients as “false” A+ or “false” A–. For example, a “false” A–patient had a normal Aβ42 value and an abnormal Aβ42/40 ratio. To ensure that the results of reclassification does not depend on the cutoffs, we applied a +/–10%interval margin to exclude borderline patients, and we reanalyzed the consistency of Aβ42 and the Aβ42/40 ratio using different cutoffs with A+ redefined as Aβ42 < 700 pg/mL or Aβ42/40 < 0.06.
Rates of classification changes were expressed as percentages and the corresponding 95%confidence interval (95%-CI) using the Wilson or binomial approach. The accuracy of Aβ42 prediction was estimated by positive and negative predictive values (PPV and NPV). The consistency of Aβ42 and the Aβ42/40 ratio was assessed using Cohen’s Kappa index (k) for an agreement analysis, and the McNemar test to estimate the significance of discordance rates. Comparisons of demographics and biomarker values were performed between patients who shared the same amyloid status with Aβ42 but different Aβ42/40 ratio classifications (for example “true” and “false” A+T–). We used the non-parametric Mann-Whitney U test for quantitative variables, and chi-squared or Fisher’s tests for qualitative variables. Statistical analyses were performed on R v.1.4., with significance set at p < 0.05, two-tailed.
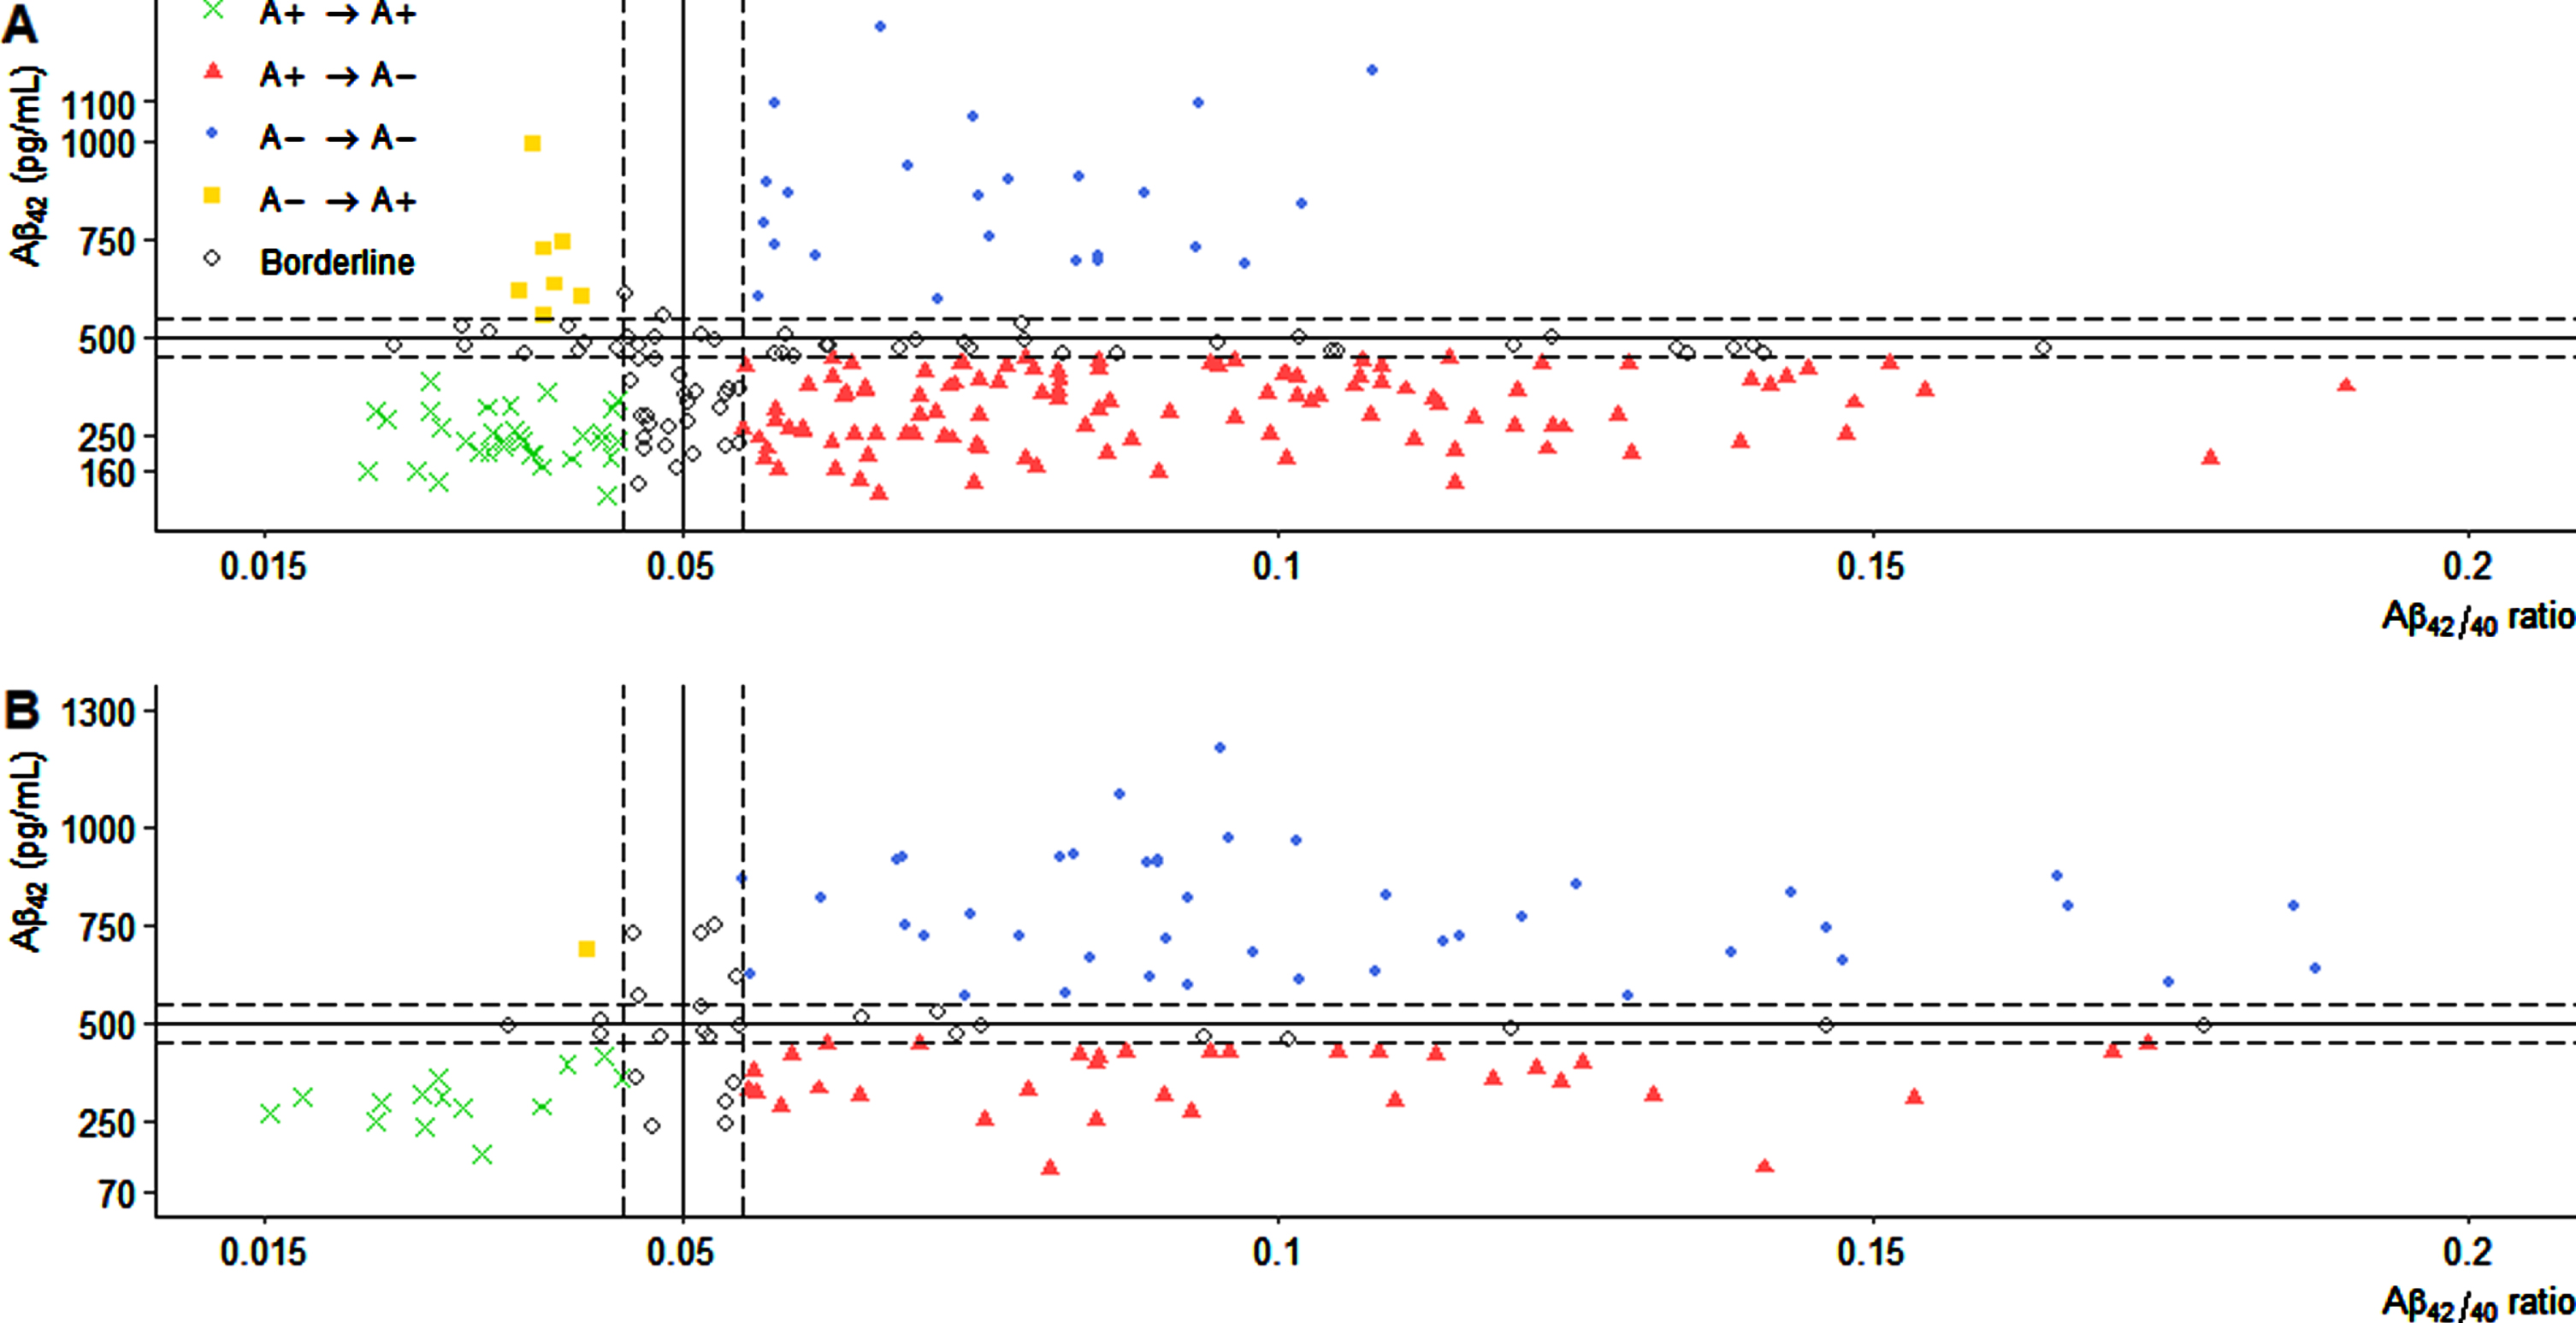
Scatter plot of cerebrospinal fluid Aβ42 values and Aβ42/40 ratio. One point represents one CSF sample for each patient in the cohort with selective Aβ42/40 ratio evaluation only for patients with A+T–and A–T+ profiles (A), or from the cohort with systematic Aβ42/40 ratio evaluation. The vertical and horizontal lines represent the Aβ42/40 ratio (0.05) and the Aβ42 (500 pg/mL) cutoff values. Dashed lines represent a +/–10%interval margin around the cutoffs. Amyloid status was determined according to the AT(N) classification system [1]: A+ corresponds to CSF Aβ42 < 500 pg/mL or Aβ42/40 ratio < 0.05. The consistency between the dichotomized biomarker values resulted in “true” amyloid positive (A+ → A+) for cases with Aβ42 < 500 and Aβ42/40 < 0.05 or “true” amyloid negative (A–→ A–) for cases with Aβ42 ≥ 500 and Aβ42/40 ≥ 0.05. Incongruent amyloid biomarker values resulted in “false” amyloid positive (A+ → A–) for cases with Aβ42 < 500 and Aβ42/40 ≥ 0.05 or “false” amyloid negative (A–→ A+) for cases with Aβ42 ≥ 500 and Aβ42/40 < 0.05. Aβ42, amyloid-β 42; CSF, cerebrospinal fluid.
RESULTS
Of 1,266 patients, 903 (71.3%) were excluded, mostly because of lack of Aβ40 dosing, while 363 (28.7%) were included (Fig. 1). Of these patients, 242 patients were assigned to the cohort with selective Aβ42/40 evaluation including 202 A+T–and 40 A–T+ patients. The cohort with systematic Aβ42/40 evaluation comprised 121 patients including 43 A–T–, 44 A+T–, 22 A+T+, and 12 A–T+ individuals (Supplementary Table 1). After Aβ42 was superseded by the Aβ42/40 ratio, in the cohort with selective Aβ42/40 evaluation, we observed classification changes of 149/202 A+T–patients to “false” A+T–(73.8%; 95%-CI = [67.3–79.3]), and 13/40 A–T+ patients to “false” A–T+ (32.5%; 95%-CI = [20.1–48]). For these patients, the consistency of Aβ42 and the Aβ42/40 ratio was at chance level (k = –0.03; p > 0.05; 95-CI = [–0.09–0.04]). The predictive accuracy of Aβ42 was low (PPV = 26.2%; NPV = 67.5%) and discordant rates were significant (p < 0.01; Fig. 1B). In the cohort with systematic Aβ42/40 evaluation, we observed classification changes of 1/43 A–T–patients to “false” A–T–(2.3%; 95%-CI = [0.001–12.3]), 40/44 A+T–patients to “false” A+T–(90.9%; 95%-CI = [78.8–96.4]), 7/22 A+T+ to “false” A+T+ (31.8%; 95%-CI = [16.4–52.7]), and 3/12 A–T+ patients to “false” A–T+ (25%; 95%-CI = [5.5–57.2]). For this cohort, the consistency of Aβ42 and the Aβ42/40 ratio was moderate (k = 0.2; p < 0.01; 95-CI = [0.08–0.33]). The predictive accuracy of Aβ42 was low (PPV = 28.8%; NPV = 92.7%) and discordant rates were significant (p < 0.01; Fig. 1A). When we applied a +/–10%interval margin around the cutoffs to exclude borderline patients, the consistency of Aβ42 and the Aβ42/40 ratio was still at chance level in the cohort with selective Aβ42/40 evaluation (Cohen’s kappa; k = –0.002; p > 0.05; 95-CI = [–0.07–0.07]; PPV = 22.2%; NPV = 77.4%; McNemar test; p < 0.01). In the cohort with systematic Aβ42/40 evaluation the consistency of Aβ42 and the Aβ42/40 ratio was still moderate (Cohen’s kappa; k = 0.27; p < 0.01; 95-CI = [0.13–0.41]; PPV = 29.2%; NPV = 97.8%; McNemar test; p < 0.01). When we used different cut-off values for Aβ42 (700 pg/mL), and the Aβ42/40 ratio (0.06), and a +/–10%interval margin, the consistency of both markers remained unchanged in the cohort with selective Aβ42/40 evaluation (Cohen’s kappa; k = 0.05; p < 0.05; 95-CI = [0.01–0.1]; PPV = 36.8%; NPV = 90.9%; McNemar test; p < 0.01) and the cohort with systematic Aβ42/40 evaluation (Cohen’s kappa; k = 0.23; p < 0.01; 95-CI = [0.12–0.34]; PPV = 38.8%; NPV = 100%; McNemar test; p < 0.01).
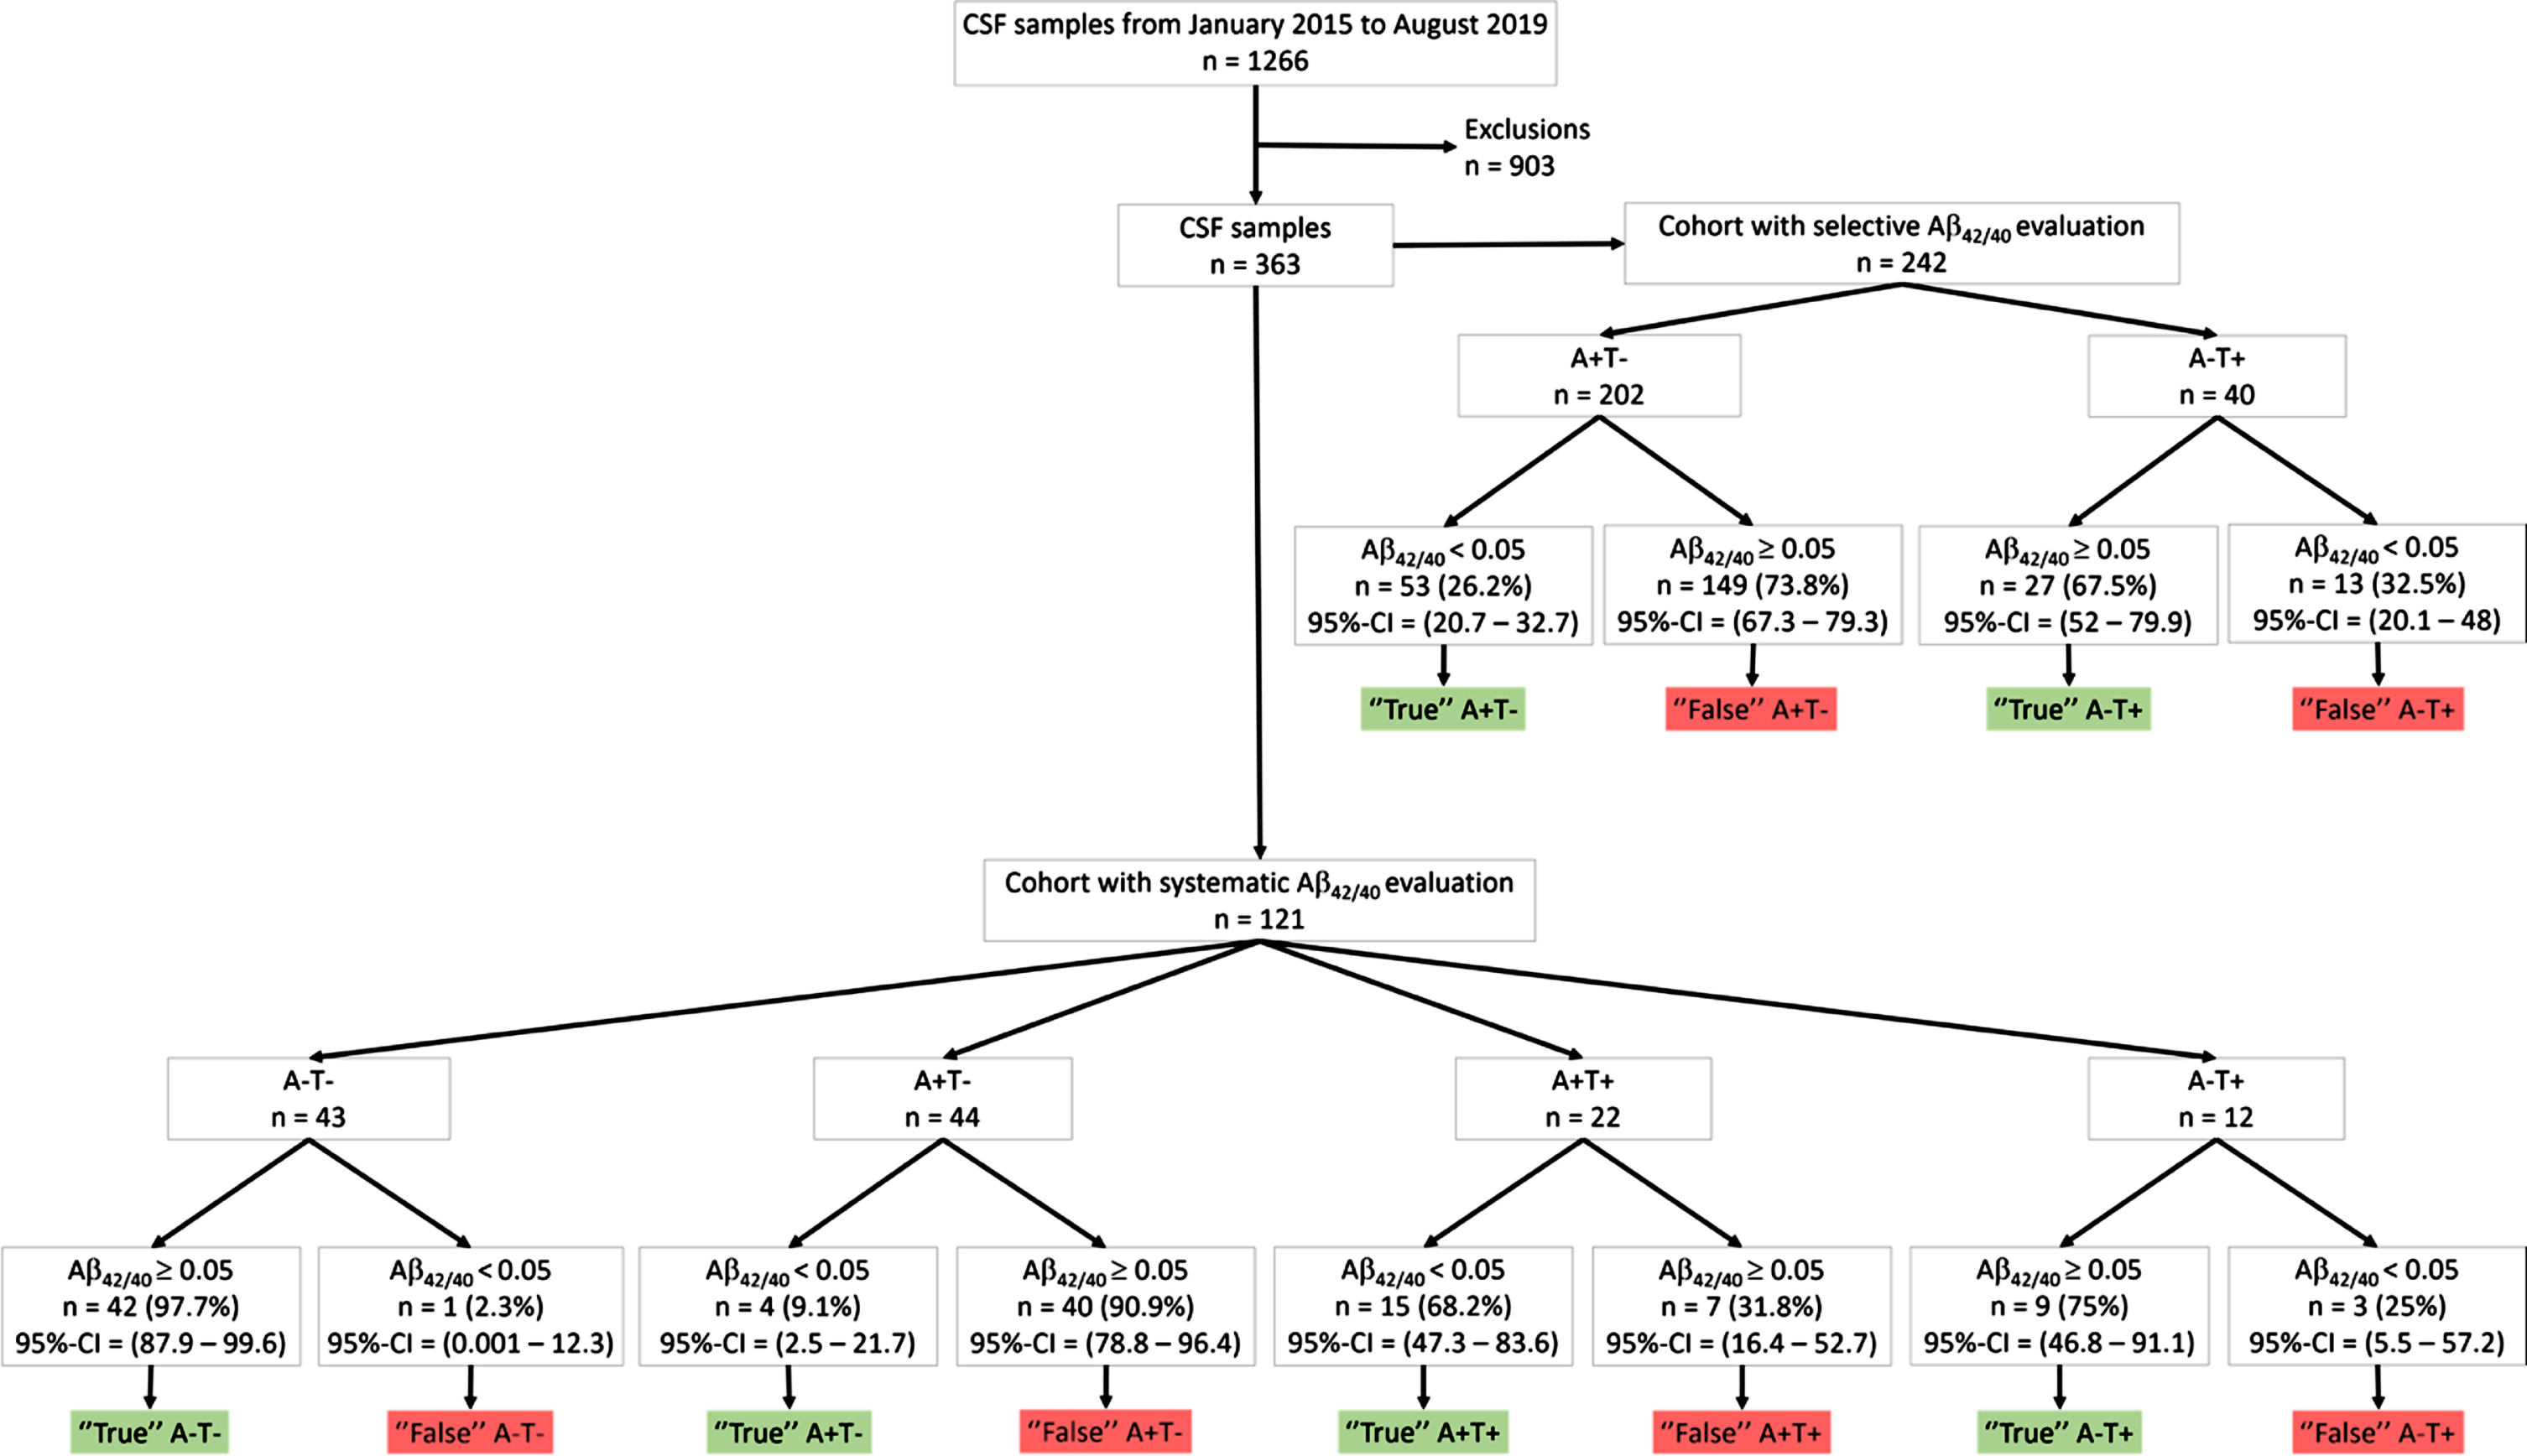
Flow chart of cerebrospinal fluid samples inclusion and classification. CSF biomarker profiles were determined according to the AT(N) classification system [1]: A+ correspond to Aβ42 < 500 pg/mL and T+ to P-tau > 60 pg/mL. Aβ42, amyloid-β 42; CSF, cerebrospinal fluid, P-tau, phosphorylated tau on threonine 181; 95%-CI, 95%confidence interval.
The subgroups of patients resulting from the reclassification were compared when the number of patients per subgroup was superior to 5 (Table 1). As expected, significant differences between amyloid biomarker levels were observed. “False” A+T+ patients had lower P-tau, and tau values compared to “true” A+T+ patients (p < 0.01). In the cohort with selective Aβ42/40 evaluation, “false” A+T–patients also had lower P-tau, and tau values compared to “true” A+T–patients (p < 0.01). Finally, for this cohort, we observed an increased proportion of patients with AD diagnosis, and a decreased proportion of patients with other neurodegenerative diseases and other conditions among “true” A+T–and “false” A–T+ compared to “false” A+T–and “true” A–T+ respectively (p < 0.05).
Comparison of the subgroups of patients resulting from amyloid status reclassification
Aβ42, amyloid β 42; CSF, cerebrospinal fluid; IQR, interquartile range; P-tau, phosphorylated tau on threonine 181; SD, standard-deviation. CSF profiles were determined according to the AT(N) classification system [1]: A+ corresponds to abnormal Aβ42 < 500 pg/mL, T+ corresponds to P-tau > 60 pg/mL. Non-parametric Mann-Whitney U test and chi-squared test or Fisher’s test were used to compare subgroups of patients who share the same amyloid status with Aβ42 but different Aβ42/40 ratio classifications (“true” and “false” A+T–for example). Comparisons were made only when the number of individuals per subgroup was superior to 5. Statistical analyses were performed on R v.1.4., with significance set at p < 0.05, two-tailed.
DISCUSSION
There is increasing evidence from clinical practice of issues related to a purely biological definition of AD [6]. The issue of the interchangeability of biomarkers related to the same pathophysiology was recently addressed in the AT(N) classification system [7, 8]. Our study shows considerable classification differences between Aβ42 and the Aβ42/40 ratio. However, one limitation is the absence of a standard reference, and this precludes ascertaining of which patient is ultimately misclassified. As we found significant differences in Aβ40 concentrations between the subgroups resulting from the reclassification, interindividual variabilities in amyloid processing might have caused classification errors when Aβ42 alone was used in the AT(N) scheme. The high rates of classification changes observed, especially those for A+T–patients, might also be due to the heterogeneity of the population. Most “false” A+T–patients did not have AD according to the clinician’s diagnosis, which suggests that the use of Aβ42 alone might produce classification errors concerning other brain pathologies in the AT(N) scheme [2, 9]. We observed 14 “false” A+T–patients clinically diagnosed with AD (Table 1). These might be cases of false-negative Aβ42/40 ratio or P-tau value (half of these patients had borderline values), or diagnostic errors. Another less likely hypothesis is that a few of these patients might have been tested at an early disease stage, before positivity on both Aβ42 and the Aβ42/40 ratio would have been detectable [10, 11]. Furthermore, we observed that most of the “true” A–T+ patients had non-AD degenerative diseases, and most of the “false” A–T+ patients had AD according to clinician’s diagnosis. These observations are consistent with a recent study showing that frontotemporal lobar degeneration was probably the main cause of “true” A–T+ patients [12]. Therefore, in our study, “false” A–T+ patients might be misclassified. We found only one “false” A–T–patient, which confirms the idea that almost no patients exhibit negative CSF Aβ42 and positive amyloid PET [2 , 13–15]. A recent study showed that positivity in both Aβ42 and PET amyloid biomarkers is not invariably associated with AD at autopsy [9]. Further investigations of our results are warranted in an autopsy confirmed AD population.
Previous studies have reported that patients with discordant Aβ42 and amyloid PET results have distinct profiles and trajectories in terms of APOE ɛ4 carriage, amyloid and tau deposition, and cognitive decline [13, 14]. Other studies have shown that these patients are subject to diagnostic reclassification [13, 15], and that the major reason for requesting an amyloid PET scan after performing CSF biomarkers was the discrepancies between the primary clinical diagnosis and CSF results [15]. As the Aβ42/40 ratio is a better amyloid marker than Aβ42 alone [4], our results suggest that the Aβ42/40 ratio might help to avoid an additional PET scan for complex clinical cases. However, previous studies have shown that the use of Aβ42/40 ratio did not influence clinician’s diagnosis when Aβ42 and P-tau are congruent [5]. As we did not assess clinician’s diagnostic changes after Aβ42 was superseded by Aβ42/40 ratio, the consistency of Aβ42/40 ratio results and clinician’s diagnosis might be artificially improved. The clinical relevance of our findings remains to be established in terms of diagnostic and evolutive trajectories.
The different operationalizations of the AT(N) system are impacted by biomarker selection, dichotomization, and population characteristics [7, 8]. The patients included in our study were heterogenous as exemplified by the small proportion of AD patients. The cohort with systematic Aβ42/40 evaluation should be considered as representative of everyday clinical practice for neurological consultations. One limitation is the exclusion of A+T+ and A–T–patients in the cohort with selective Aβ42/40 evaluation. There were few of these patients in our study, and the proportion of misclassifications among A+T+ and A–T–patients may be different with a larger population. Another concern is the choice of threshold values. However, there was no change in our results after excluding borderline patients and after retesting the analyses with different cut-off values. Besides, it has been shown that cut-off modifications for biomarkers related to the same pathophysiology did not improve their consistency [7]. Therefore, it seems unlikely that the choice of threshold values significantly influenced our analyses.
In conclusion, our results suggest that the Aβ42/40 ratio is not interchangeable with Aβ42 to delimit amyloid pathology in clinical practice using the AT(N) classification system.