
Abstract
Background:
Early and severe neuronal loss in the cholinergic basal forebrain is observed in Alzheimer’s disease (AD). To date, cholinomimetics play a central role in the symptomatic treatment of AD dementia. Although basic research indicates that a cholinergic deficit is present in AD before dementia, the efficacy of cholinomimetics in mild cognitive impairment (MCI) remains controversial. Predictors of cholinergic impairment could guide individualized therapy.
Objective:
To investigate if the extent of the cholinergic deficit, measured using positron emission tomography (PET) and the tracer 11C-N-methyl-4-piperidyl acetate (MP4A), could be predicted from the volume of cholinergic basal forebrain nuclei in non-demented AD patients.
Methods:
Seventeen patients with a high likelihood of MCI due to AD and 18 age-matched cognitively healthy adults underwent MRI-scanning. Basal forebrain volume was assessed using voxel-based morphometry and a cytoarchitectonic atlas of cholinergic nuclei. Cortical acetylcholinesterase (AChE) activity was measured using MP4A-PET.
Results:
Cortical AChE activity and nucleus basalis of Meynert (Ch4 area) volume were significantly decreased in MCI. The extent of the cholinergic deficit varied considerably across patients. Greater volumes of anterior basal forebrain nuclei (Ch1/2 area) and younger age (Spearman’s rho (17) = –0.596, 95% -CI [–0.905, –0.119] and 0.593, 95% -CI [0.092, 0.863])) were associated with a greater cholinergic deficit.
Conclusion:
Data suggest that less atrophy of the Ch1/2 area and younger age are associated with a more significant cholinergic deficit in MCI due to AD. Further investigations are warranted to determine if the individual response to cholinomimetics can be inferred from these measures.
INTRODUCTION
The observation of neuronal degeneration in the cholinergic basal forebrain in Alzheimer’s disease (AD) [1, 2] led to the AD cholinergic hypothesis and the identification of the cholinergic system as a target for pharmacotherapy. To date, most pharmacological treatments in AD still target the cholinergic system [3, 4], although effects are modest [5, 6]. In mild cognitive impairment (MCI) due to AD, which presents with objectifiable neuropsychological deficits and biomarker evidence of AD, but unimpaired functions of daily living [7], cholinergic pharmacotherapy remains controversial. Compared to cognitively healthy aging, signs of altered cholinergic neurotransmission are present in MCI [8, 9]. Furthermore, basic clinical research has demonstrated the positive effects of acetylcholinesterase (AChE) inhibitors on memory-related brain activation in MCI and cognitively healthy seniors [10 –12]. Although some clinical studies suggested that AChE inhibitors may slow the progression from MCI to dementia [13, 14], meta-analyses could not confirm this [15, 16]. An explanation for these conflicting findings may lie in varying degrees of cholinergic impairment among MCI patients, where a beneficial effect of cholinergic pharmacotherapy can only be expected once the cholinergic system is functionally decompensated. We have demonstrated that rivastigmine may partially normalize memory performance and neural activation in MCI due to AD, depending on the local integrity of the cholinergic system [12]. Specifically, the local activity of AChE, which hydrolyzes ACh in its role as a critical enzyme of cholinergic neurotransmission, was assessed through the hydrolysis rate of the PET tracer 11C-N-methyl-4-piperidyl acetate (MP4A) and was found to be lower in patients with a more substantial response to rivastigmine [12]. Conversely, pivotal clinical studies of cholinergic medication in MCI recruited patients based on clinical criteria [13, 15]. Therefore, it is uncertain if AD and, more specifically, an impairment of the cholinergic system were present in all participants. However, identifying patients with a cholinergic deficit could refine clinical trials of cholinergic pharmacotherapy in MCI and constitute the first step toward personalized therapy.
While access to MP4A-PET is limited to specialized centers, degenerative changes in specific cholinergic basal forebrain regions can be detected with structural MRI sequences comparable to those used in clinical settings [17, 18]. To clinically translate our observation that responsiveness to cholinergic stimulation in MCI depends on cortical AChE activity [12], using MP4A-PET and structural MRI, we here investigated if reductions of cortical AChE activity in a group of patients with MCI due to AD could be predicted from structural changes in the basal forebrain. We hypothesized that basal forebrain nuclei differ in their degree of atrophy and that these differences are associated with differential levels of cortical AChE activity. Since AD initially affects the posterior part of the basal forebrain (Ch4p area), we expected the basal forebrain atrophy in MCI due to AD being most significant in this area and correlating with the cholinergic deficit’s magnitude. To determine if cortical AChE activity in MCI due to AD is specifically correlated with basal forebrain grey matter atrophy, we examined if basal forebrain atrophy is more closely correlated with cortical AChE activity than hippocampal atrophy, i.e., the most characteristic imaging finding in AD [19, 20]. Given the association between white matter hyperintensities and cholinergic impairment in MCI due to AD [21], we also investigated if basal forebrain volume explains variability in cortical AChE activity beyond what can be attributed to white matter hyperintensities [21]. Furthermore, based on previous findings of a more pronounced cholinergic deficit in early-onset AD dementia [22, 23], we also postulated that the degree of the cholinergic deficit is negatively correlated with age in MCI. Additionally, in an exploratory analysis, we examined if the cholinergic deficit in MCI is associated with deficits in a specific cognitive domain. This information could help interpret the findings of cholinomimetics trials in MCI due to AD and define cognitive endpoints for future investigations.
METHODS
Participants
Twenty patients recently diagnosed with MCI in the Memory Clinic Cologne-Jülich (11 male, aged 54 to 80, mean 68.7±6.8 years) and without neurological or psychiatric comorbidities were recruited as part of the MACS study (Memory, Ageing and the Cholinergic System, EudraCT No. 2008-008896-32). This study consisted of two phases: 1) MRI and MP4A-PET were conducted in an imaging characterization phase [9 , 24]; 2) this was followed by a pharmacological phase where participants performed an episodic memory task during functional MRI after application of 3-mg of rivastigmine or placebo in a double-blind crossover design, which has been published elsewhere [12].
Sixteen of the seventeen patients had positive CSF biomarkers indicating AD pathology (Amyloid-β1 - 42 < 650 pg/ml or a Tau-Protein/Amyloid-β1 - 42 ratio > 0.52 [25]) and biomarkers of neuronal injury (temporoparietal atrophy on MRI, temporoparietal and precuneal hypometabolism in fluorodeoxy-glucose-PET or total CSF Tau > 375 pg/ml), thus meeting the criteria for a high likelihood of MCI due to AD described by Albert and colleagues [7]. The one remaining patient had a typical clinical presentation of MCI due to AD and signs of neuronal injury (temporoparietal atrophy and precuneal hypometabolism) but narrowly missed the cutoff for CSF Aβ-pathology with Tau/Aβ1 - 42 ratio of 0.49 and an Aβ1 - 42 of 741 pg/ml. Thus, this patient was classified as having an intermediate likelihood of MCI due to AD. Two patients were excluded from further analyses because of extensive subcortical white matter lesions with confluent leukoaraiosis corresponding to a grade 3 on the scale of Fazekas [26], and a third patient withdrew consent.
As a control group, 22 age-matched cognitively healthy adults (14 male, aged 53 to 80, mean 66.6±7.1 years) without a history of neurological or psychiatric disease were recruited from the community. Four controls were not eligible for further analyses due to an incidental pathological finding (severe cerebral atrophy, n = 1), severe dental metal artifacts in MRI (n = 2), and a PET data acquisition failure (n = 1). Thus, the data of 18 controls and 17 MCI patients entered the analyses. None of the participants showed clinically relevant depression as assessed using the BDI-V (cutoff < 35 points; [27].
A comprehensive medical history including basic demographic data (age, gender, level of education) and disease onset and comorbidities was obtained from all participants, who subsequently underwent a clinical examination by a neurologist and a comprehensive neuropsychological assessment, as previously described in detail [12]. All participants were free of psychoactive medication, and none had a relevant anticholinergic burden, as assessed using the anticholinergic burden score [28].
MRI and PET acquisition
MP4A was synthesized as previously described [8, 29], with minor modifications. PET-scanning was performed using an ECAT HRRT scanner (CPS Innovations, Knoxville, TN, USA) using the protocol described by Haense et al. (2012) [8]. High-resolution T1-weighted images (MDEFT3D; repetition time (TR) 1930 ms; inversion time (TI) 650 ms; echo time (TE) 5.8 ms; flip angle 18°; 128 sagittal slices; resolution 1.0×1.0×1.25 mm3), T2-weighted images (TR 3200 ms; TE 458 ms; 176 sagittal slices; resolution 1.0×1.0×1.0 mm3), and fluid-attenuated inversion recovery (FLAIR) images (TR 8040 ms; TI 2400 ms; TE 121 ms; flip angle 150°; 36 axial slices; slice thickness 4 mm, inplane resolution, 0.46875×0.46875 mm2) were acquired using a 3T Trio scanner (Siemens, Erlangen, Germany) with a 32-channel head coil.
PET processing
AChE activity was estimated as the hydrolysis rate of MP4A, k3, at the voxel level [9 , 21]. After injecting the tracer, PET scans were acquired over 60 min using an ECAT HRRT scanner (CPS Innovations, Knoxville TN, USA). k3 of MP4A was estimated using a 3-parameter compartment model [29, 30]. Images were processed as follows: 1) Rigid-body co-registration of the sum of the first 10 min of the PET-scan to the T1-image; 2) rigid-body co-registration of all consecutive frames to the co-registered first 10-min frame; 3) filtering of all individual frames with a Gaussian kernel (12 mm FWHM) with restriction of the kernel to avoid smoothing across high gradients of signal contrast; 4) segmentation and parcellation of the T1-image using FreeSurfer 5.0.0 [31 –33]; 5) extraction of the kinetic reference curve from a putaminal region of interest (ROI) defined by the use of the segmented and parcellated T1-image; 6) computation of k3 of MP4A at the voxel level [29, 30] as implemented in the software VINCI (version 4.20, Max Planck Institute for Metabolism Research, Cologne, Germany). The resulting k3-maps were co-registered to the T1-images and normalized to the Montreal Neurological Institute (MNI) space, using the parameters generated in the voxel-based morphometry (VBM) analysis described below. k3 estimates for each region of interest (ROI) were obtained as averages of the voxels in that ROI. The generation of the ROI is described in detail below.
The “cholinergic deficit” was determined for each patient using a subject-specific measurement protocol: Each patient’s AChE activity map was z-transformed by subtracting the mean of the control group and dividing by the standard deviation of the control group. This way, we accounted for inter-individual differences in the spatial pattern of reduced AChE activity and avoided diluting effects by averaging AChE activity across impaired and normal areas. A voxel was considered part of the cholinergic deficit if the AChE activity in that voxel was more than two standard deviations below the control group’s mean, i.e., the z-score was more than 2 below 0.
The z-scores were averaged across these subthreshold voxels (voxels with a z-score more than 2 below 0) and multiplied with the number of subthreshold voxels for each patient, resulting in a single value reflecting the cholinergic deficit. For ease of interpretation, throughout this publication, the cholinergic deficit is expressed in positive integers, i.e., larger values correspond to a more significant deficit.
Voxel-based morphometry
Grey matter (GM) volume was assessed using VBM as implemented in the CAT12 toolbox (Computational AnatomyToolbox 12, https://www.neuro.uni-jena.de/cat/) of SPM12 software (www.fil.ion.ucl.ac.uk/spm/software/spm12). T1-images were segmented into tissue classes, spatially normalized to MNI space using the high-dimensional registration algorithm DARTEL [34]. The resulting GM maps were modulated for nonlinear normalization only, accounting for global differences in head size modeled by the linear transform. Therefore, total intracranial volume (TIV) was not included in subsequent analyses using GM values obtained via VBM. This was done to reduce the number of covariates in subsequent analyses in light of the sample size. Using masks in MNI space of the regions of interest described below, the average voxel intensities for each ROI were extracted from the modulated normalized grey matter maps and entered in subsequent statistical analyses.
Regions of interest
Volumes of basal forebrain subnuclei were extracted from the VBM maps using a cytoarchitectonically defined map of the cholinergic basal forebrain in MNI standard space. This map differentiates between five subregions, namely the posterior NbM (nucleus basalis of Meynert; Ch4p), the anterior medial and intermediate NbM (Ch4a-i), the anterior lateral NbM (Ch4al), the horizontal limb of the diagonal band of Broca (Ch3), and a subregion combining the vertical limb of the diagonal band of Broca (Ch2) and the medial septal nuclei (Ch1) [18] (Fig. 1). A hippocampal ROI was derived from the Jülich histological atlas [35] by combining the hippocampal subregions except for the entorhinal cortex in a single ROI. This ROI extracted the hippocampal GM volume from the VBM data and hippocampal AChE activity from the PET data. Given the proximity of the hippocampus to various structures with very different AChE activities, this mask was thresholded to only include voxels with a > 50% likelihood of being part of the hippocampus, to minimize partial volume effects. Cortical regions of interest for each cerebral lobe were defined using the MNI structural atlas [36] to quantify the cortical AChE activity. Since the hippocampus receives cholinergic input from the Ch1/2 area, but the temporal cortex from the Ch4 area, the temporal lobe was divided into the hippocampal ROI described above and a temporal cortex ROI from which the hippocampus ROI had been subtracted.

Basal forebrain regions-of-interest. Coronal slices show the location of the cytoarchitectonic map of the basal forebrain subnuclei. Slice numbers are in MNI-coordinates. Ch1/2, vertical limb of the diagonal band of Broca/medial septal nucleus; Ch3, horizontal limb of the diagonal band of Broca; Ch4a-i, anterior medial and intermediate nucleus basalis of Meynert, Ch4al, anterior lateral nucleus basalis of Meynert; Ch4p, posterior nucleus basalis of Meynert.
Manual tracing of the Ch1/2 region
To cross-validate the GM volume values obtained for the Ch1/2 region using the cytoarchitectonic map, these structures were also manually traced on the T1-weighted MR images following a protocol based on histology-derived anatomical landmarks [37]. Accounting for the inter-individual variability in head size, Ch1/2 volumes were divided by the TIV, which was estimated by summing the tissue maps for GM, white matter, and CSF generated in the normalization process.
Quantification of white matter hyperintensities
Periventricular white matter hyperintensities (PVH) were assessed using the semiquantitative scale of Scheltens [38] as previously described [21]. The scale distinguishes between PVH, located adjacent to the lateral ventricles (frontal and occipital caps, lateral bands), non-periventricular white matter hyperintensities, located deep in the frontal, parietal, temporal, or occipital lobe, and subcortical white matter hyperintensities. PVH were specifically chosen, as these are associated with the cortical cholinergic deficit [21].
Statistical analysis
The distribution of parameters was assessed with Shapiro-Wilks tests. Pearson correlations were computed for normally distributed data. Otherwise, Spearman’s rho was used. All statistical analyses of non-imaging data were conducted with SPSS (Version 24.0, IBM Corp., Armonk, NY).
To account for the non-normal distribution of several parameters, including the extent of the cholinergic deficit, all correlations were computed using bias-corrected accelerated bootstrapping with 5000 permutations, and results are presented with 95% -confidence intervals.
Group comparisons
Group differences in demographics and neuropsychological performance were assessed using Mann-Whitney-U-Test given the small sample size. Gender distribution was examined using the chi-squared test.
Mann-Whitney-U-Tests were also performed to determine in which cerebral lobe cortical AChE activity was lower in MCI. Similarly, group differences in GM volume were computed for the hippocampus and the basal forebrain subnuclei.
Associations between basal forebrain GM volume and the cholinergic deficit in MCI
As the primary endpoint, the relationship between the cholinergic deficit, Ch1/2 GM volume, Ch4p GM volume, and hippocampal GM volume within each group was assessed using Spearman’s rho. These regions were specifically selected based on their involvement in AD. The Ch4p region was selected because it is the part of the basal forebrain affected earliest and most severely by AD [17, 39]. The Ch1/2 area was used as ROI because it provides the cholinergic input to the hippocampus [40]. Notably, this area has been shown to intermittently increase in volume in the course of AD [37]. The hippocampus was examined as a region typically atrophied in AD but outside the basal forebrain to ensure that an association between the cholinergic deficit and basal forebrain volume is specific and not a consequence of AD-related atrophy in general.
In a secondary analysis, Pearson correlations between the three GM volume measures and AChE activity from each cerebral lobe were computed within each group.
Assessment of age-effects on GM volume and cholinergic function in MCI
Age may affect GM volume and, therefore, the relationship between Ch1/2 volume and the extent of the cholinergic deficit observed in MCI. We, accordingly, tested for correlations between GM volumes, the extent of the cholinergic deficit, and age within the MCI group. Additional post-hoc analyses were performed to investigate further the nature of the association between Ch1/2 and Ch4p volume and the cholinergic deficit in MCI in the context of disease onset. Following the definition of early-onset AD used in clinical practice [41], the patient group was split by age at disease onset [22, 23]. Seven patients had an early onset, i.e., before the age of 65 years. The average disease duration in patients was two years. The median age of the whole patient group was 67 years. Therefore, splitting the patient group by disease onset translated to a median split. For comparative purposes and to disentangle disease effects from age-effects, the control group was also split by its median of 67.5 years, resulting in nine young controls and nine old controls.
The four subgroups were compared concerning Ch1/2 and Ch4p volume, and the MCI groups were contrasted regarding the extent of the cholinergic deficit. Furthermore, it was examined if there is an association between disease duration and the cholinergic deficit in patients.
Since both age and Ch1/2 volume were significantly correlated with the cholinergic deficit, post-hoc multiple regression analyses were performed to determine if Ch1/2 volume and age contribute independently to the cholinergic deficit and if the association between the cholinergic deficit and Ch1/2 GM volume is significant when accounting for age and the presence of PVH. The cholinergic deficit was defined as the dependent variable and age, Ch1/2 volume, and PVH as independent variables. We did not include all three independent variables in a single model given the sample size but constructed three separate models. Model 1 was used to determine if age and Ch1/2 volume are redundant in explaining the cholinergic deficit. Model 2 and Model 3 were constructed to determine if age and Ch1/2 volume are still associated with the cholinergic deficit when accounting for PVH. Robust linear regression was performed with bootstrapping to account for the non-normal distribution of the cholinergic deficit and the small sample size. Given that the direction of relationships was known a priori, i.e., from the initial correlation analyses, 1-tailed p-values are reported. Similar analyses were performed for Ch4p and hippocampal volume to determine whether age or PVH affected their relationship to the cholinergic deficit.
Level of education and the cholinergic deficit
In light of previous reports linking the level of education to cholinergic function in MCI [42 –44], an additional post-hoc analysis was performed. For this purpose, Spearman’s rho was calculated between the total level of education (the sum of school years and college/university or other formal training) and the extent of the cholinergic deficit in the MCI group.
The cholinergic deficit and cognition
In an exploratory analysis, multiple regressions were performed to assess the relevance of the cholinergic deficit for cognition, with measures of neuropsychological performance as the dependent variable and the extent of the cholinergic deficit as the explanatory variable, including age and gender as covariates of no interest. Each neuropsychological measure was examined in a separate model. The Trail-Making-Test B (TMT-B) was not included in this analysis since data were not available from all participants. Since there was a clear a priori hypothesis that a more significant cholinergic deficit would be associated with poorer cognition, 1-tailed p-values are reported. False-detection-rate (FDR) correction was applied with an FDR of 5% [45] to account for the number of comparisons.
Validation of VBM derived Ch1/2 volume measurements with manual tracing
Correlations were computed between the Ch1/2 GM volume obtained with VBM and manual tracing to validate the sensitivity of the VBM analysis in combination with the cytoarchitectonic maps of the basal forebrain. Spearman’s rho was computed for the association between manually traced Ch1/2 GM and the extent of the cholinergic deficit.
RESULTS
Demographics and neuropsychological characteristics
Groups did not differ in age (Mann-Whitney-U-Test, p = 0.386), gender distribution (χ2 (1) = 0.019, p = 0.89), or depressive symptoms assessed using the Beck’s Depression Inventory V (BDI-V) [27] (Mann-Whitney-U-Test, p = 1.000). Patients performed significantly poorer on all neuropsychological tests and had less formal education than controls (Mann-Whitney-U-Test, p = 0.026) (Table 1).
Demographic data and neuropsychological performance of the final sample
The significance of group differences assessed using 2-sided Mann-Whitney U-Tests. Gender distribution was assessed using a Chi-squared-test. IQR, inter quartile range; PVH, periventricular white matter hyperintensities; BDI-V, Becks’ Depression Inventory V; MMSE, Mini-Mental-Status Exam; VLMTDR, Verbal Learning Memory Test delayed recall; ROCFDR, Rey Osterrieth Complex Figure Test delayed recall; TMT, Trail Making Test; BTA, Brief Test of Attention; LPS4, Leistungsprüfsystem 4 (logical thinking); B-ADL, Bayer Activities of Daily Living; SD, standard deviation. The TMT-B was not included since data were not available from all patients.
Seven MCI patients had an early disease onset, i.e., before the age of 65 years. The median age of the early-onset subgroup was 62 years (1st quartile = 59 years, 3rd quartile = 66 years), and the median age of the late-onset subgroup (n = 10) was 71 years (1st quartile = 67.75 years, 3rd quartile = 74.75 years; p < 0.001) at the time of the study. The average disease duration in patients was two years. For comparative analyses, the control group was also split into a younger control group (median age = 59 years, 1st quartile = 55 years, 3rd quartile = 65 years) and an older control group (median age = 70 years, 1st quartile = 68 years, 3rd quartile = 71.5 years; p < 0.001).
Group differences in acetylcholinesterase activity and GM volume
GM volume was significantly smaller in MCI patients in the posterior NbM (Ch4p), the anterior and intermediate NbM (Ch4a-i), and the hippocampus. After correction for multiple comparisons, only GM volumes in the posterior NbM (Ch4p) and the hippocampus differed significantly between groups. AChE activity was significantly less in patients than in controls in the temporal, parietal, and occipital lobes, and the hippocampus, even after FDR-correction for multiple comparisons, but only a trend for a group difference was observed in the frontal lobe (Table 2).
Group differences in grey matter volume and AChE activity
The significance of group differences assessed using 2-sided Mann-Whitney U-Tests. IQR, inter quartile range; NbM, nucleus basalis of Meynert; DB, diagonal band of Broca. Bold font indicates significance after FDR-correction for multiple comparisons.
Associations between basal forebrain volume and the cholinergic deficit in MCI
A cholinergic deficit was present in all MCI patients, but the number of affected image voxels varied considerably, ranging from 1690 to 102827 voxels. The extent of the cholinergic deficit (Fig. 2) was positively correlated with GM volume in the Ch1/2 area (rho (17) = 0.593, p = 0.012 95% -CI [0.092, 0.863], Fig. 3), but not with GM volume in the Ch4p (rho (17) = –0.127, p = 0.626 95% -CI [–0.624, 0.419]) area or the hippocampus (rho (17) = –0.265, p = 0.305, 95% -CI [–0.64, 0.258]). Counterintuitively, greater volumes of the Ch1/2 area were associated with more extensive cholinergic deficits.
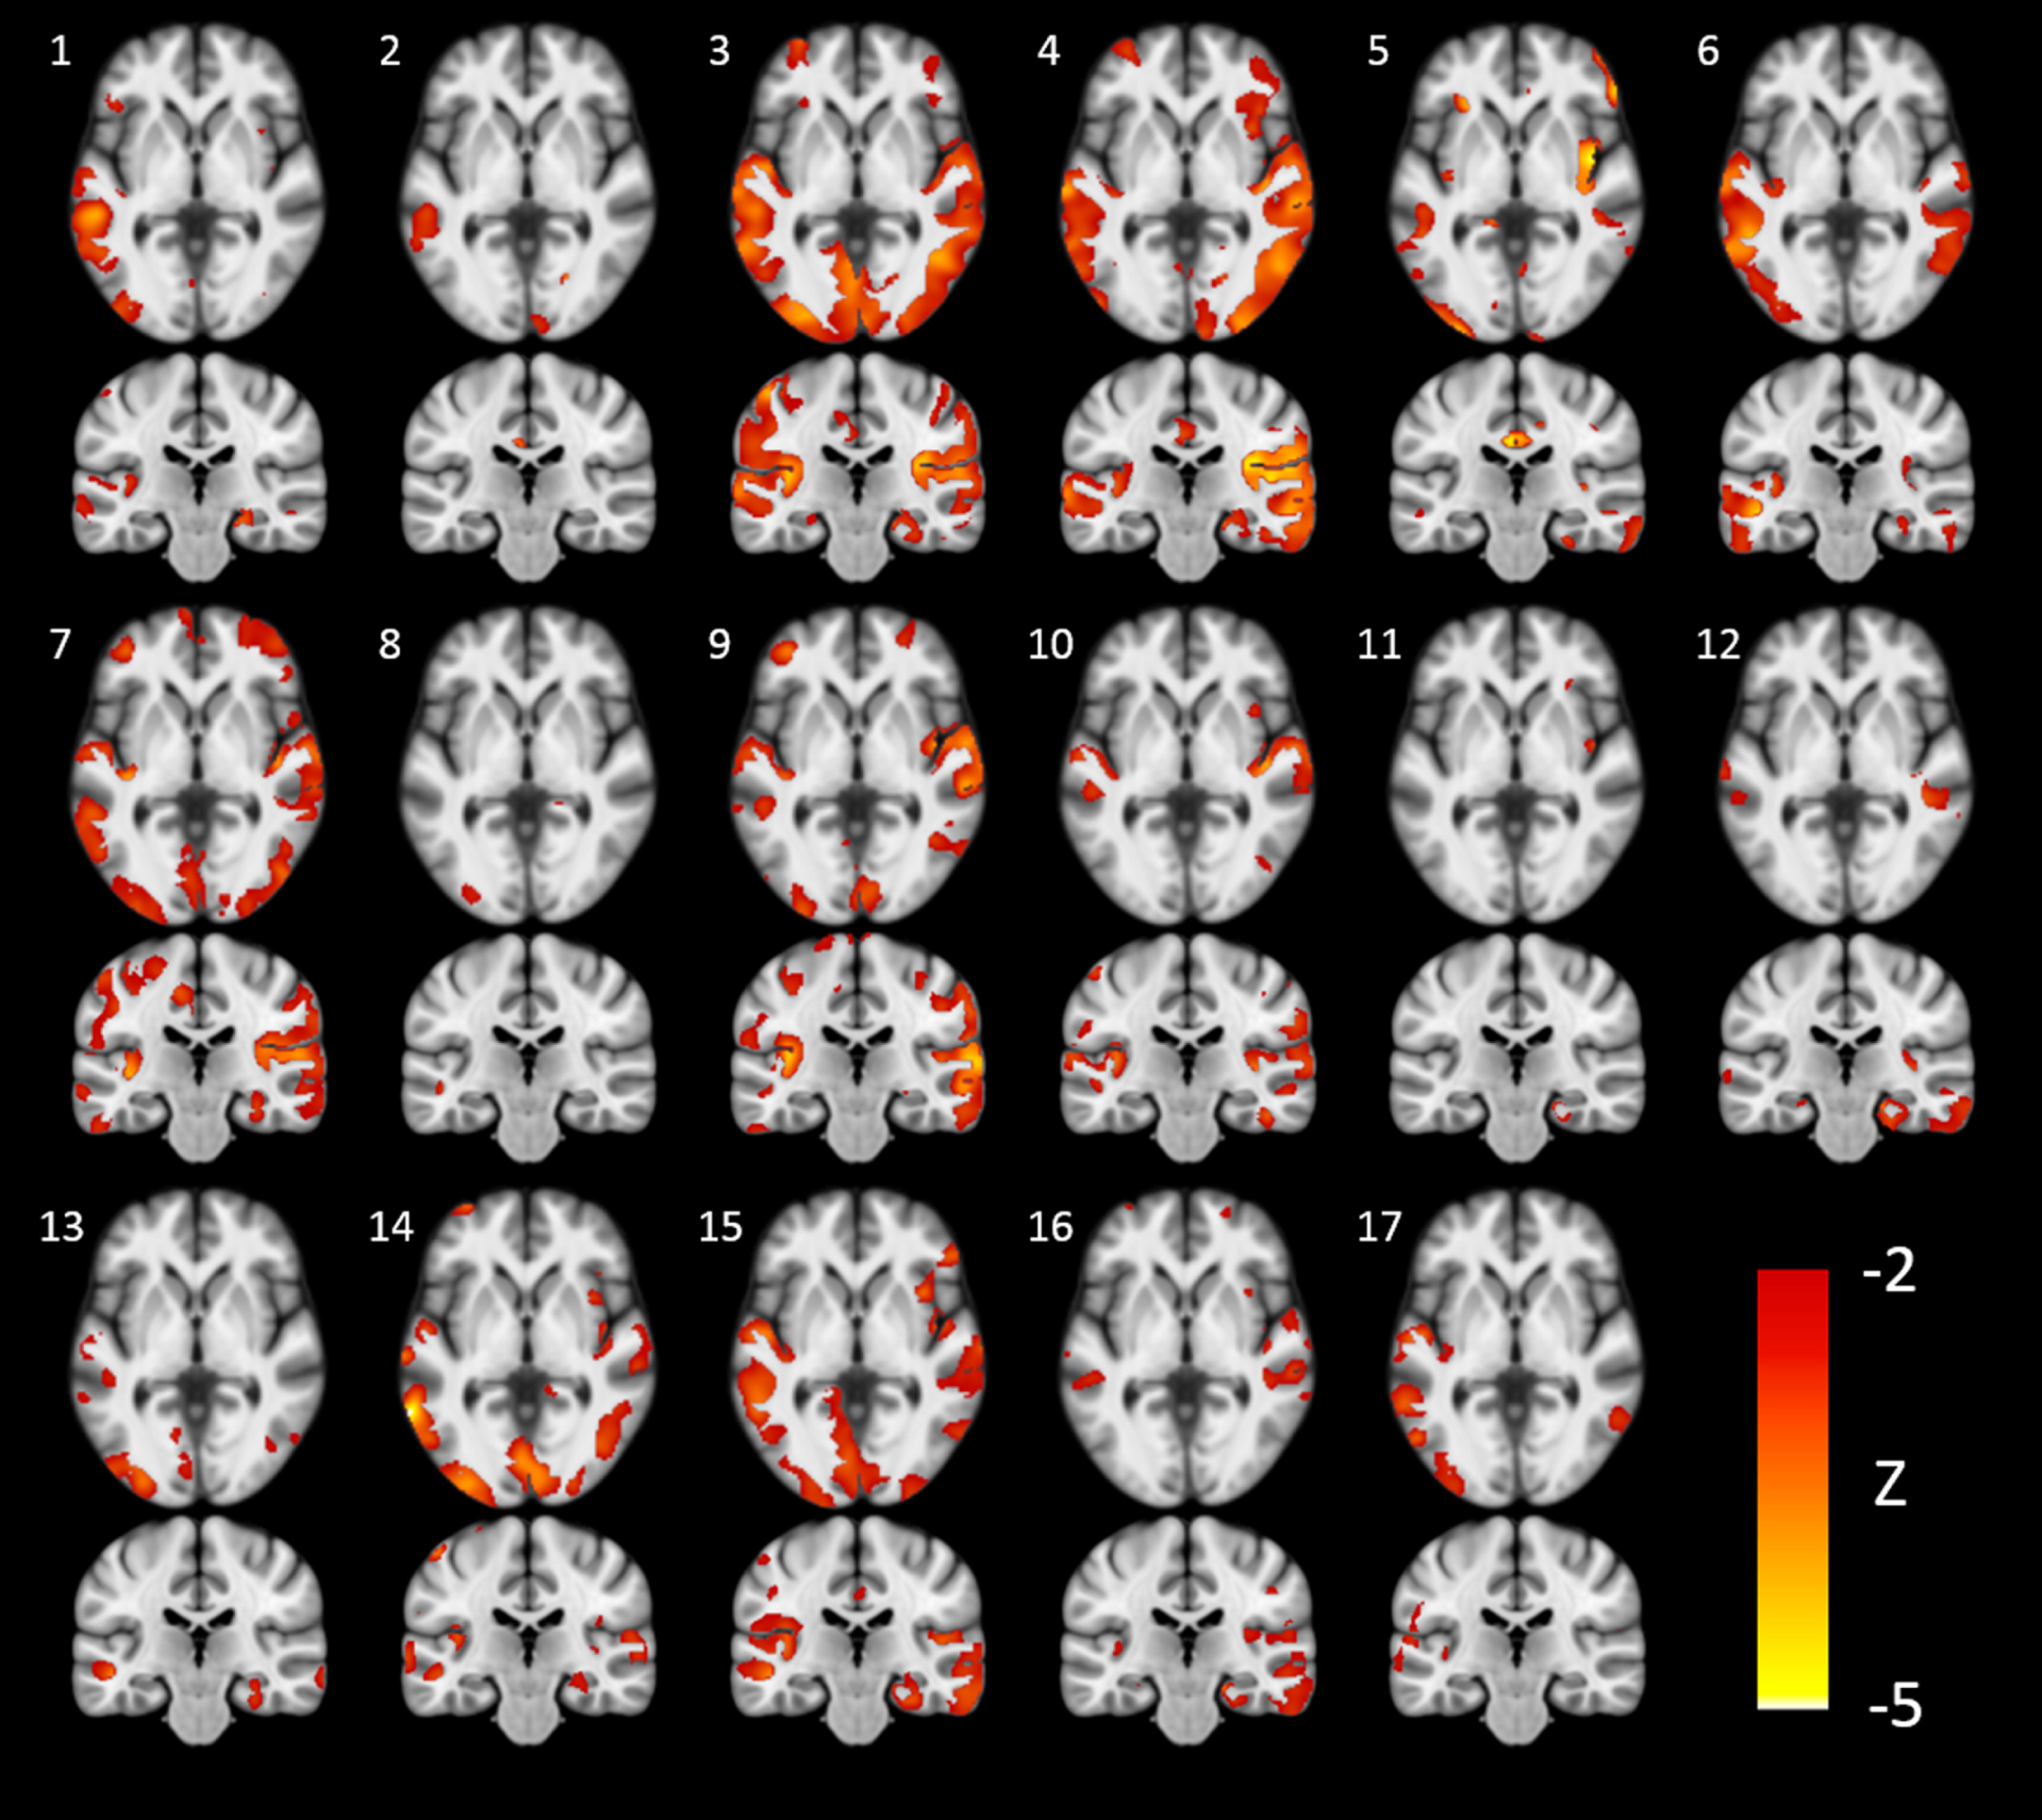
The extent of the cholinergic deficit varies across patients. Axial and coronal slices from all 17 patients with mild cognitive impairment showing areas where cortical acetylcholinesterase activity deviated more than two standard deviations below the mean of the control group, expressed as z-statistics (Z = (participant’s AChE activity –mean AChE activity of control group) / standard deviation of AChE activity of control group; MNI coordinates y = –24 and z = 0).

The extent of the cholinergic deficit is positively correlated with Ch1/2 grey matter volume (a) and negatively correlated with age in mild cognitive impairment (b). Spearman’s rho is reported with bootstrapped 95% -confidence intervals. The cholinergic deficit was defined as the number of voxels, where acetylcholinesterase activity deviated more than two standard deviations below the control group’s mean, multiplied with the average z-value across these subthreshold voxels. Ch1/2, vertical limb of the diagonal band of Broca/medial septal nucleus.
In line with this, a secondary analysis of the association between Ch1/2 volume and cortical AChE activity in the different lobes revealed a negative correlation between Ch1/2 volume and AChE activity in the temporal cortex (r (17) = –0.503, p = 0.040, 95% -CI [–0.864, –0.038] and trends towards negative correlations between Ch1/2 volume and AChE activity the frontal (r (17) = –0.469, p = 0.058, 95% -CI [–0.826, 0.198]) and parietal cortex (r (17) = –0.482, p = 0.05, 95% -CI [–0.892, 0.097]), but not in the occipital cortex (r (17) = –0.331, p = 0.195, 95% -CI [–0.823, 0.363]) or the hippocampus (r (17) = –0.157, p = 0.547, 95% -CI [–0.643, 0.246]).
In controls, age, Ch4p, Ch1/2, and hippocampal GM volume did not correlate with cortical or hippocampal AChE activity.
Cholinergic function and hippocampal volume, but not basal forebrain volume, are associated with age in MCI
In MCI, age was negatively correlated with the individual extent of the cholinergic deficit (rho (17) =–0.596, p = 0.011, 95% -CI [–0.905, –0.119] (Fig. 3) and positively correlated with AChE activity in the temporal (r (17) = 0.693, p = 0.002, 95% -CI [0.245, 0.880]), parietal (r (17) = 0.682, p = 0.003, 95% -CI [0.234, 0.871]), occipital (r (17) = 0.608, p = 0.01, 95% -CI [0.037, 0.932]) and frontal (r (17) = 0.591, p = 0.013, 95% -CI [0.163, 0.829]) cortices, but not the hippocampus (r (17) = 0.344, p = 0.176, 95% -CI [–0.25, 0.783]). In other words, younger age was associated with a less cortical AChE activity and a greater cholinergic deficit.
In this group, age was also correlated with hippocampal GM volume (r (17) = –0.698, p = 0.002, 95% -CI [–0.864, –0.463]), but only showed a trend towards a negative correlation with Ch1/2 GM volume (r (17) = –0.451, p = 0.069, 95% -CI [–0.797, 0.063]) and no significant association with GM volume in the Ch4p area (r (17) = –0.028, p = 0.914, 95% -CI [–0.522, 0.423]).
Post-hoc multiple regression analyses indicated that the association between Ch1/2 GM volume and the cholinergic deficit was significant when correcting for age (Table 4). Furthermore, both age and Ch1/2 GM volume were significantly associated with the cholinergic deficit when accounting for the presence of PVH. Ch4p and hippocampal GM volume were not associated with the cholinergic deficit, even when accounting for age or the presence of PVH.
Multiple regression analysis examining the association between the cholinergic deficit, Ch1/2 volume, age, and periventricular white matter hyperintensities (PVH)
The cholinergic deficit is the dependent variable. Independent variables are age, Ch1/2 volume, and PVH. The significance of age and Ch1/2 volume in Model 1 indicates that the two measures are not redundant in explaining the cholinergic deficit. The significance of age and Ch1/2 volume in Models 2 and 3 indicates that they are associated with the extent of the cholinergic deficit independent of PVH. GMV, grey matter volume.
Disease onset, but not duration or level of education, explains variance in the cholinergic deficit in MCI due to AD
To elucidate the nature of the association between Ch1/2 volume and the cholinergic deficit in MCI, several post-hoc analyses were conducted: The patient group was split by age at disease onset following the definition of early-onset AD, with a disease onset before 65 years of age, following clinical practice [41] and previous PET studies [22, 23]. The early-onset subgroup had a greater cholinergic deficit (133779.734±94694.894) than late-onset MCI patients (38399.214±38706.839; p = 0.011). Ch1/2 volume in late-onset MCI (0.757±0.076) was smaller than in early-onset MCI (0.872±0.117; p = 0.025) and in older controls (0.839±0.087; p = 0.022). However, Ch1/2 volume did not differ between younger controls (0.829±0.095) and older controls (0.849±0.082, p = 0.566).
Ch4p volume did not differ between early-onset MCI (0.667±0.117) and late-onset MCI patients (0.612±0.085; p = 0.276) or between younger controls (0.766±0.046) and older controls (0.759±0.085; p = 0.354), while hippocampal volume was significantly greater in early-onset MCI (0.588±0.049) compared to late-onset MCI (0.505±0.056; p = 0.010), but did not differ between younger controls (0.627±0.056) and older controls (0.610±0.042; p = 0.691).
Furthermore, we examined if there are associations between disease duration or level of education and the cholinergic deficit. The cholinergic deficit was not correlated with disease duration rho (17) = 0.051, p = 0.846, 95% -CI [–0.498, 0.606] or level of education rho (17) = 0.257, p = 0.319, 95% -CI [–0.320, 0.706]).
The cholinergic deficit and cognition in MCI
In an exploratory analysis, we examined if the extent of the cholinergic deficit was related to cognition. The cholinergic deficit was negatively correlated with the LPS4, a test of logical thinking (rho (17) = –0.492, p = 0.023, 95% -CI [–0.751, –0.12]), and the MMSE as a marker of global cognition (rho (17) = –0.476, p = 0.027, 95% -CI [–0.758, –0.041]), and trended towards a positive correlation with the TMT-A (rho (17) = 0.399, p = 0.057, 95% -CI [–0.125, 0.724]), but it was not correlated with memory performance. The correlations observed in this exploratory analysis were not significant after FDR-correction for multiple comparisons (Table 3).
Exploratory analysis of associations between the cholinergic deficit and cognition in MCI
Results of the multiple regression analyses, where each neuropsychological measure was treated as the dependent variable in a separate model and the cholinergic deficit was used as the explanatory variable, including age and gender as covariates of no interest. MMSE, Mini-Mental-Status Exam; LPS4, Leistungsprüfsystem 4 (logical thinking); VLMTDR, Verbal Learning Memory Test delayed recall; ROCFDR, Rey Osterrieth Complex Figure Test delayed recall; BTA, Brief Test of Attention; TMT, Trail Making Test. The TMT-B was not included in the analysis since data were not available from all patients. Bold font indicates statistical significance. The reported associations with the cholinergic deficit were not significant after correction for multiple comparisons.
Validation of VBM derived Ch1/2 volume measurements with manual tracing
In the MCI group, Ch1/2 volumes obtained using manual segmentation were closely correlated with GM volume values obtained for the Ch1/2 region using voxel-based morphometry (r (17) = 0.667, p = 0.003, 95% -CI [0.260, 0.892]) and the extent of the cholinergic deficit (rho (17) = 0.745, p = 0.001, 95% -CI [0.925, 0.309]).
DISCUSSION
We here demonstrate that basal forebrain nuclei differ in their degree of atrophy and association with cortical AChE activity, estimated from MP4A-PET, in patients with MCI and CSF biomarkers indicative of AD pathology. As hypothesized, in MCI due to AD, atrophy was most significant in the posterior basal forebrain (especially the Ch4p area), sparing the anterior parts, including the Ch1/2 area.
To account for individual differences in the spatial patterns of reduced AChE activity, the extent of the cholinergic deficit, defined as the deviation from the control group’s mean, was computed for each patient. Even in this seemingly homogenous patient sample, there was substantial variation in the pattern and extent of the cortical cholinergic deficit (Fig. 2), which, contrary to the initial hypothesis, was not associated with the volume of the Ch4p area. Instead, and counterintuitively, it correlated positively with the volume of the medial septal nuclei and the vertical limb of the diagonal band of Broca (Ch1/2). Furthermore, the cholinergic deficit was more significant in patients younger at disease onset, translating to a negative correlation between the extent of the cholinergic deficit and age.
Notably, the volumetric measures did not require a highly specialized MRI setting but were obtained using high-resolution T1-images comparable to those regularly used to evaluate cerebral atrophy in clinical settings.
Predictors of the cholinergic deficit
The extent of the cholinergic deficit extent significantly correlated with the Ch1/2 volume but not with the GM volume in the Ch4p area or the hippocampus. In other words, greater Ch1/2 volume was associated with a more significant cholinergic deficit in the MCI group. Interestingly, the cholinergic deficit was not associated with disease duration, and it was less pronounced in late-onset MCI. In contrast, only the latter patients exhibited significant atrophy of the Ch1/2 area, in line with reports of anterior basal forebrain atrophy MCI [46, 47]. The greater Ch1/2 volume in patients with a more severe cholinergic deficit thus could be attributable to atrophy of the Ch1/2 area in older MCI patients. While AD primarily affects the posterior part of the basal forebrain [17 , 39], the atrophy of the Ch1/2 area in late-onset MCI could be caused by non-AD co-pathology, e.g., TDP-43 and a-synuclein aggregates [48 –50], with increasing age [51, 52]. However, the Ch1/2 area has also been reported to transiently increase in volume in AD before cognitive deficits become apparent [37]. It is thus possible that the positive association between Ch1/2 volume and the cholinergic deficit may be due to a pathological or reactive increase of Ch1/2 volume due to inflammation [53] or neuroplastic processes [54 –56].
Our finding of a negative association of age with the extent of the cholinergic deficit, i.e., a more significant cholinergic deficit in younger patients with MCI due to AD, fits observations made in dementia due to AD [22, 23]. Patients in the present sample were at the early disease stage of MCI. Estimated age at onset and age at the time of the study were therefore quite similar. Therefore, the negative correlation between age (at the time of the study) and the cholinergic deficit could be attributable to the fact that patients with early-onset MCI had a more significant cholinergic deficit than patients with late-onset MCI. This finding is in line with the observation that, compared to cognitively healthy controls, cortical AChE and choline acetyltransferase (ChAT) activity are more severely reduced in early-onset than late-onset AD [22, 23]. On the other hand, in cognitively healthy aging, AChE activity remains relatively stable, and ChAT activity only decreases moderately across the lifespan [57], in contrast to age-related changes in basal forebrain volume [17]. In line with these previous findings, we did not observe a correlation between age and cortical cholinergic activity in cognitively normal controls, but only in MCI patients. This finding supports the notion that the association between age and cholinergic function in MCI is related to pathological changes.
Unlike previous reports [42 –44], we did not observe any association of cognitive reserve proxies, such as level of education, with the cholinergic deficit. This discrepancy may be attributable to the other studies having a greater range of the disease than our sample [42, 43] or different techniques used to assess cholinergic function [43, 44].
The most parsimonious explanation for different levels of the cholinergic deficit in clinically alike older and younger patients with MCI due to AD is a higher burden of non-Alzheimer co-pathology in older patients [52]. Early-onset AD is associated with a relatively higher tau burden than late-onset AD [41], and younger patients are more likely to have “pure” AD pathology. In contrast, late-onset patients often have age-related TDP-43 pathology, Lewy bodies, vascular lesions, and other pathologies contributing to the AD-typical amnestic phenotype [51, 52].
We observed a trend for a negative correlation between age and Ch1/2 volume, but multiple regression analyses indicated that the two measures are not entirely redundant. Both measures explained a significant amount of variance in the data when included in the same model. Ch1/2 volume, therefore, appears to be associated with the extent of the cholinergic deficit beyond the effect of age. Furthermore, in the present sample, Ch1/2 volume and age also predicted the extent of the cholinergic deficit when correcting for periventricular lesion load.
In line with previous findings, MCI was associated with a significantly smaller volume of the posterior NbM (Ch4p) [17] and less cortical AChE activity, especially in the lateral temporal lobes. Surprisingly, within the patient group alone, the volume of the Ch4p area did not correlate with cortical AChE activity. This may be since Ch4p only provides cholinergic input to a relatively small part of the cerebral cortex, mainly the temporal pole and the superior temporal lobe [49, 58], while the cholinergic deficit, even in MCI, can extend far beyond these areas (cf. Fig. 2). The Ch4a-i complex, which is assumed to project to the rest of the cerebral cortex, was smaller in the MCI group, but this comparison missed statistical significance, so arguably, structural changes in this area may be too subtle to be detected with the methods presented here. In this context, it is worth mentioning that macroscopic MRI studies consistently report progressive atrophy of the basal forebrain in AD [17 , 59–61].
In contrast, neuronal counts [62] and AChE activity [63] in the basal forebrain have been reported to remain normal in MCI and mild AD dementia. Also, neurofibrillary degeneration, which is not necessarily reflected in the loss of GM, plays an essential role in NbM dysfunction during early disease stages [1, 39]. Furthermore, MRI-based basal forebrain volume was also found independent from neuronal loss within the AD spectrum but more related to cortical amyloid load in a recent clinicopathological correlation study [50].
Several methodological limitations of this study need to be considered. Volumetry of the basal forebrain is only an indirect measure of the integrity of the cholinergic system since the basal forebrain contains some other neuronal populations [64 –66]. Furthermore, the NbM does not have distinct boundaries with considerable overlap between the subnuclei [49], which cannot be captured using structural MRI. Another limitation is that, even though we have previously found the response to the cholinomimetic rivastigmine to be more significant in patients with lower AChE activity [12], AChE activity may not fully capture the degeneration of the cholinergic system in AD. AChE is only one of several biochemical markers of cholinergic neurotransmission. However, most other molecular markers of cholinergic neurotransmission, such as the presynaptic vesicular acetylcholine transporter (VChAT) and nicotinic acetylcholine receptors, also decrease in MCI and mild dementia due to AD [8 , 67–70]. The exception is ChAT, which is central to ACh-metabolism and mostly co-localizes with AChE [71, 72]. ChAT is increased in the hippocampus in MCI [54, 73], attributed to reactive synaptogenesis in the medial septal nuclei [74, 75].
Furthermore, we only have CSF biomarker data for the patient group. It, therefore, cannot be ruled out that the control group included asymptomatic individuals with AD pathology. Also, recent reports indicate that non-AD co-pathologies such as Lewy body or age-related TDP-43 pathology are very likely to be present in older AD patients, as in the present sample. However, to date, we cannot directly investigate this, as there are no validated in vivo markers for these non-AD co-pathologies [52, 76].
Additionally, when interpreting the results of this study, one should consider the relatively small number of participants and that age at disease onset and at the time of scanning were very similar. Thus, their effects cannot be disentangled from each other.
Finally, it needs to be emphasized that we specifically examined patients at the stage of MCI. Clinical symptoms and neurodegeneration at this disease stage are relatively mild. It is conceivable that a correlation between the volume of posterior basal forebrain nuclei (the Ch4 area) and the cholinergic deficit would be observed in samples that cover a more comprehensive range of disease burden and include patients with dementia due to AD and more severe degenerative changes, but this would not help to assess the cholinergic deficit in MCI.
Possible implications of non-AD co-pathologies for pharmacotherapy in AD
Histopathological data indicate that non-AD pathologies are present in older patients with AD and are highly likely to have been present in some of our older patients with CSF biomarkers indicative of AD [51, 52]. The fact that the typical amnestic phenotype of AD is associated with an increasing burden of non-AD pathology as age progresses [52] has several far-reaching consequences for pharmacotherapy in AD.
First of all, it may explain the limited efficacy of cholinesterase inhibitors in MCI: Under the assumption that beneficial effects of cholinomimetics depend on a cholinergic deficit, which appears to be less pronounced in older patients, it is conceivable that clinical trials in MCI failed, because the average patient may have been “too old”. Specifically, the presence of non-AD pathology, which is more common with increasing age [51, 52], may have diluted effects that would have been pronounced in younger samples.
Secondly, studies investigating imaging biomarkers as predictors of the response to cholinomimetics have reported that hippocampal volume and measures of basal forebrain volume predict the effectivity of donepezil in AD dementia [77, 78] and galantamine in cognitively normal adults [79]. However, in MCI due to AD, neither total basal forebrain volume nor hippocampal volume predicted the response to donepezil [80]. It could be argued that the individual basal forebrain nuclei are too small to assess changes in their volume using VBM with the 3D T1-Sequences commonly used. However, as previously demonstrated [81], we found that the volumes of the Ch1/2 area obtained using VBM correlate well with manual tracing of these structures. Furthermore, the present and previous VBM analyses [17, 18] also capture the posterior-anterior gradient of basal forebrain degeneration [39]. Measurements of basal forebrain subnuclei, specifically Ch1/2 volume, are thus feasible and provide insights beyond those obtained using the volume of the whole basal forebrain. Therefore, the investigation of Ch1/2 GM volume and age as predictors of the response to cholinomimetics appears promising.
Finally, age-associated non-AD pathology [51] could also attenuate the effects of pharmacotherapy that specifically targets amyloid and tau-pathology [82]. Non-AD co-pathology could dilute the effects of such disease-modifying medications, even in samples with positive biomarkers of AD, if many older patients are included [52].
The cholinergic deficit in MCI and cognition
Exploratory analyses revealed that the cholinergic deficit in MCI is associated with poorer global cognition, logical thinking, and executive functions but not with memory. These findings align with our previous observation that the AChE inhibitor rivastigmine partially normalized neuronal activation in areas related to stimulus processing, but not memory formation, during a visual memory encoding task [12]. An association of the cholinergic deficit with relatively broad measures of cognition would also explain the observation from clinical trials that cholinesterase inhibitors improve global cognition and clinical state, but not specifically memory [5, 13]. Besides, it has to be considered that the present sample of MCI patients had relatively mild impairments of memory and cognition. It is conceivable that a correlation between the cholinergic deficit and memory performance would be observable in more severely affected patients or a larger patient sample. Furthermore, the results of this exploratory analysis have to be treated with caution since they were not significant when correcting for multiple comparisons.
Conclusions
The basal forebrain subnuclei differ distinctly in their association with the cholinergic deficit in MCI due to AD. Interestingly, the Ch1/2 volume and age were most closely correlated with the extent of the cholinergic deficit in this population, but the direction of the correlation was opposite to our initial hypothesis. Further investigations are warranted to determine an association between age and Ch1/2 volume and the response to cholinergic pharmacotherapy in MCI due to AD.
Footnotes
ACKNOWLEDGMENTS
We are grateful to our colleagues from the Clinical Trials Center Cologne (Zentrum für Klinische Studien Köln) and the former Max-Planck Institute for Neurological Research (now: Max-Planck Institute for Metabolism Research), in particular D. Yves von Cramon, Rudolf Graf, and Matthias Schmidt, for their valuable support. This work was supported by a grant from the Medical Faculty of the University of Cologne (Forschungspool Klinische Studien, Nr. 2620000301) and the Marga and Walter Boll Foundation (Nr. 210-08-13), Kerpen, Germany, to GRF, OO, and JK.