
Abstract
Background:
The presence of subjective cognitive complaints (SCCs) is a core criterion for diagnosis of subjective cognitive decline (SCD); however, no standard procedure for distinguishing normative and non-normative SCCs has yet been established.
Objective:
To determine whether differentiation of participants with SCD according to SCC severity improves the validity of the prediction of progression in SCD and MCI and to explore validity metrics for two extreme thresholds of the distribution in scores in a questionnaire on SCCs.
Methods:
Two hundred and fifty-three older adults with SCCs participating in the Compostela Aging Study (CompAS) were classified as MCI or SCD at baseline. The participants underwent two follow-up assessments and were classified as cognitively stable or worsened. Severity of SCCs (low and high) in SCD was established by using two different percentiles of the questionnaire score distribution as cut-off points. The validity of these cut-off points for predicting progression using socio-demographic, health, and neuropsychological variables was tested by machine learning (ML) analysis.
Results:
Severity of SCCs in SCD established considering the 5th percentile as a cut-off point proved to be the best metric for predicting progression. The variables with the main role in conforming the predictive algorithm were those related to memory, cognitive reserve, general health, and the stability of diagnosis over time.
Conclusion:
Moderate to high complainers showed an increased probability of progression in cognitive decline, suggesting the clinical relevance of standard procedures to determine SCC severity. Our findings highlight the important role of the multimodal ML approach in predicting progression.
INTRODUCTION
Mild cognitive impairment (MCI) has been described as a prodromal stage of dementia in individuals with objective cognitive decline, cognitive complaints, and well preserved functionally [1]. People with MCI have a considerably higher risk of conversion to dementia [2], particularly those subtypes with multiple impaired domains [3–5]. A new pre-symptomatic stage, subjective cognitive decline (SCD), has recently been proposed as falling between the normative age-related decline in cognition and MCI as a prodromal stage of dementia [6, 7]. Individuals diagnosed with SCD experience and express persistent subjective cognitive complaints (SCCs) of decline in cognitive ability, which cannot be explained by medical conditions or substance use, with no evidence of objective decline in cognition or functionality beyond the threshold suggesting subtle impairments. Although research on the progression of SCD is scarce, some results from studies carried out in community and clinical settings have suggested a significantly higher risk of progression to MCI than non-complainers [8, 9]. In addition, participants with SCCs (focusing particularly on memory) at baseline have shown an increased risk of non-normative cognitive decline and eventual progression to MCI and dementia [10–12].
Information about neuropathological progression across pre-symptomatic and prodromal stages of dementia, specifically Alzheimer’s disease, is increasingly available, and quite a high consensus has been reached regarding the continuous nature of the disease across the stages that precede the diagnosis [13]. In accordance, similar socio-demographic (e.g., age, gender, education, professional attainment), health (e.g., comorbidity, functionality, depression) and cognitive (e.g., memory, executive functions) measures have been proposed as valid predictors of progression to dementia in both SCD [9–11, 14–18] and MCI [19–28]. Progression to dementia in SCD and MCI can potentially be predicted from a large number of sociodemographic, health, and cognitive variables. Machine learning (ML) is therefore a suitable approach for extracting complex patterns and analyzing the precision with which the data fit the progression observed in the different groups [29].
Despite the nature of SCD and MCI as respectively pre-symptomatic and prodromal stages of dementia, some participants with MCI [4] and to a greater extend those with SCD [11, 30] do not progress or convert to dementia during a standard follow-up period. The problem of the validity of predictors of conversion, particularly in SCD, must be addressed by improving the procedures used to measure the core diagnostic criteria and to establish the clinical significance of these [31, 32]. In both MCI (i.e., cognitive performance) and SCD (i.e., complaints), compliance with the core criteria must be verified using indicators that already generally change in normative aging, making diagnosis of these conditions particularly challenging. Cut-off points ranging from 1 to 2 SD below mean are used to determine cognitive impairment in MCI [33]. However, in SCD the significance of complaints is evaluated and established in different ways across studies [11, 12]. No standard procedure for distinguishing normative and non-normative complaints has yet been established. As SCCs are common in normative aging [11], quantification of the complaints may be important for distinguishing participants undergoing normative aging from those with pre-symptomatic and prodromal stages of dementia. The frequency of perceived difficulties is often rated using items that assess cognition on a scale ranging from ability to disability, in order to quantify the importance of SCCs and to characterize SCD psychometrically [6, 32]. Thus, exploration of a valid threshold that can differentiate participants by the importance of SCCs and successfully predict progression to dementia appears worthwhile.
Separate predictions of progression in SCD, particularly in MCI participants, have been studied in recent years by using neurocognitive markers. Despite the widespread idea that SCD and MCI are part of a continuum of deterioration that can lead to dementia, we are not aware of any study specifically aimed at predicting the progression of participants with these pre-symptomatic and prodromal stages of the disease.
The main objectives of this study were: 1) to determine whether differentiation of participants with SCD according to SCC severity improves the validity of the prediction of progression of pre-symptomatic and prodromal states of dementia using ML algorithms; and 2) to explore the validity of the quantifying of SCCs using two extreme cut-off points for the classification of low and high complainers in predicting progression to dementia, as a preliminary study of the clinical significance of complaints. For this purpose, we consider as extreme thresholds the scores corresponding to the 5th or 95th percentiles of the distribution of scores in a questionnaire on SCCs.
MATERIALS AND METHODS
Participants
A sample of 262 subjects of age 50–87 years already participating in the Compostela Aging Study (CompAS) and who completed clinical and neuropsychological assessments at baseline and two follow-ups were included in the present study. CompAS is an ongoing longitudinal project [34] involving the detection of cognitive impairment in patients attending primary care centers in Galicia (an autonomous region in north-western Spain). All participants reported SCCs, including memory problems, to their general practitioners. None of the participants had prior diagnosis of dementia, psychiatric or neurological disorders, severe illness, deafness or blindness; they were not receiving chemotherapy, and they did not consume alcohol or other substances.
Trained psychologists carried out extensive neuropsychological and cognitive assessment of the participants, who were classified at baseline as MCI (N = 54) or SCD (N = 199) at a special meeting of the research team. MCI diagnosis was diagnosed according to the criteria established by Albert et al. [35] and participants were classified into four MCI subtypes following standard criteria [1]: single-domain amnestic MCI (sda-MCI); multiple-domain amnestic MCI (mda-MCI); single-domain non-amnestic MCI (sdna-MCI); and multiple-domain non-amnestic MCI (mdna-MCI). Participants who reported SCCs but did not exhibit objective cognitive impairment were considered to have SCD. Diagnosis at baseline was corrected conservatively when diagnosis at the first follow-up (18–24 months later) suggested some degree of recovery (i.e., from MCI to SCD, or from multiple-domain MCI to single-domain MCI).
In each successive follow-up assessment, participants were reclassified, using the same criteria as at baseline, as having SCD, sda-MCI, mda-MCI, sdna-MCI, mdna-MCI, or probable dementia (DSM-IV and NINCDS-ADRDA). The between-test interval was around 18–24 months. Nine participants whose diagnosis was reversed from MCI to SCD at the second or third follow up evaluation were excluded from the study, and the final sample therefore consisted of 253 participants. At the third evaluation (54–72 months), participants were classified into four groups according to changes in their cognitive status: participants with SCD at baseline who remained stable (SCD-stable group, n = 170, 67.20%); participants with SCD at baseline who progressed to MCI (n = 20) or dementia (n = 9) (SCD-worsened group, n = 29, 11.46%); participants diagnosed with MCI at baseline who remained stable (MCI-stable group, n = 15, 5.92%); and participants diagnosed as sda-MCI or sdna-MCI at baseline who progressed to mda-MCI and mdna-MCI (n = 7) or to dementia (n = 32) at follow-up 1 or 2 (MCI-worsened group, n = 39, 15.42%). We assumed, in accordance with Brambati et al. [3] and Campos-Magdaleno et al. [36], that the change from single-domain to multiple-domain indicates cognitive decline, as multiple domain MCI represents the most severely impaired of the MCI subtypes. The sample descriptive scores at baseline for sociodemographic, health, subjective complaints, cognitive status and functional measures are shown in Table 1.
Descriptive scores at baseline (mean and SD, in parentheses) for sociodemographic, health, subjective complaints, cognitive status and functional measures in SCD and MCI participants
CCI, Charlson comorbidity index; QAM, Questionnaire d’auto-évaluation de la Mémoire-short version; MMSE, Mini-Mental State Examination. *p < 0.05. **p < 0.001.
SCD and MCI groups differed significantly in age, cognitive status, and informant-rated IADL variables, but were similar in regard to education, self-rated subjective complaints, gender, and comorbidity.
All participants gave their written informed consent prior to participation in the study. The research project was approved by the Galician Clinical Research Ethics Committee (Xunta de Galicia, Spain), and the study was performed in accordance with the ethical standards established in the Declaration of Helsinki as revised in Seoul 2008.
Materials and procedure
Socio-demographic variables such as age, gender, profession, and years of schooling were collected using an ad hoc questionnaire. The socio-cognitive complexity of tasks associated with professional attainment was ordered, according to the protocol outlined by Garibotto et al. [37] on a scale of 1 to 6 (where 1 = no occupation and 6 = high-ranking civil servant or director, university lecturer, self-employed with high level of responsibility).
With a diagnostic purpose, we used a short Spanish version of the Questionnaire d’auto-évaluation de la Mémoire (QAM) [38, 39] to evaluate the SCCs. The questionnaire consisted of seven items that rated the frequency of prospective and retrospective forgetfulness, distractions, and difficulties in lexical access and spatial orientation on a five-point Likert scale (from ‘never’ to ‘always’). General cognitive status and functionality were assessed using respectively the Mini-Mental State Examination (MMSE) and the Lawton and Brody Index. Memory impairments were assessed using the Short delay free recall test in the Spanish version of the California Verbal Learning Test (CVLR) [40, 41]. Other cognitive domains such as language, attention-calculation, praxis, perception, and executive functioning were assessed using the corresponding subscales of Spanish version of the Cambridge Cognitive Examination (CAMCOG-R) [42].
With a predictive purpose, other measures of health, cognition, language, cognitive reserve, and neuropsychiatric symptoms were collected at baseline using measures from the Spanish versions of the following instruments: A) the Charlson Comorbidity Index (CCI), to quantify the individual’s burden of disease from the patient’s medical history; B) QAM informant subjective complaints; C) CAMCOG-R total score, as measure of general cognitive status; D) Logical memory I and II, Verbal paired associated I and II, and immediate and delayed auditory memory subtests of the Wechsler Memory Scale–Third Edition (WMS-III); E) CVLT measures for Long delay free recall, intrusions in free and cued recall, total perseverations, recognition accuracy, false positives in recognition, recall discriminability, semantic and serial strategies in long and short delay free recall, serial position effect (corrected score for primacy, middle and recency regions [36]; F) Working memory indexes from adapted versions of the reading and counting span tasks, with the partial-credit unit scoring (i.e., mean proportion of items successfully recalled, relative to serial order within a series); G) the Peabody Picture Vocabulary Test-Revised and the Vocabulary subtest of the Wechsler Adult Intelligence Scale (WAIS-III); H) Verbal fluency, evaluated through the letter, semantic and ideational tests; I) Severity and stress measures of the Neuropsychiatric Inventory Questionnaire (NPI-Q); J) Total score of the Geriatric Depression Scale-15 items (GDS-15); K) Burden on the wellbeing of the informant-caregiver, from the Caregiver Burden Interview (CBI). Years of schooling, professional attainment, and vocabulary scores were also considered proxy measures of cognitive reserve. Total time from baseline to the last study-evaluation and time of stability (i.e., months without changes in diagnostic status) were also calculated for each participant.
Statistical analysis
Missing data in some measures were completed for 22 of the participants (8.69%) by estimating mean values from subsets of participants with similar characteristics (e.g., grouped by cognitive scores, gender, and five-year age intervals). Thus, original and imputed missing data sets were highly correlated according to intraclass correlation coefficients (ICC) (ρ> 0.80), showing good reliability values in the method of imputed missing values [43].
This work is a first approach to test the importance of: a) considering or not the severity of complaints in predicting progression to dementia; and b) comparing the prediction validity classifying participants in high and low complainers using two extreme distribution criteria (95th and 5th). Predictive validity for stable and worsening SCD and MCI groups was first analyzed in the four groups (4-group model), i.e., SCD-stable (SCD-s), SCD-worsened (SCD-w), MCI-stable (MCI-s), and MCI-worsened (MCI-w), by ignoring the severity of complaints made by the SCD participants. We subsequently took the severity of the complaints into account, differentiating them into low and high according to the percentile distribution of participants’ total QAM scores calculated for each age-groups. We tested two different criteria: a) a stricter criterion considering the 95th percentile (i.e., 50–59 age-group = 21/22; 60–69 age-group = 20/21; 70–79 age-group = 20/21; >80 age-group = 19/20); and b) a less strict criterion considering the 5th percentile (i.e., 50–59 age-group = 18/19; 60–69 age-group = 17/18; 70–79 age-group = 16/17; >80 age-group = 16/17).
Combining diagnostic group, progression, and severity led to analysis of predictive validity in six groups (6-group models): i.e., low SCD-stable (l-SCD-s), high SCD-stable (h-SCD-s), MCI-stable (MCI-s), low SCD-worsened (l-SCD-w), high SCD-worsened (h-SCD-w), and MCI-worsened (MCI-w). Two 6-group models were tested using the stricter (95th) and the less strict (5th) criterion (see Table 2).
Descriptive scores (means, standard deviations in parentheses, minimum and maximum) at baseline for socio-demographic variables (gender, age and years of schooling), health (Comorbidity Index, CBI), subjective complaints (QAM-participant), functional status (Lawton-Brody IADL) and cognitive status (Mini-Mental State Examination, MMSE), for the SCD patients (N = 199) classified in low and high SCD groups according to the stricter criterion (95th percentile) and the less strict criterion (5th percentile) for complaint severity
Low SCD versus high SCD comparison: *p < 0.05, **p < 0.001.
Mann-Whitney U and Chi-square tests were performed using SPSS, version 21.0 (SPSS, Chicago, IL, USA) for descriptive analysis and group comparisons. Supervised ML techniques were used to predict the accuracy of classification of participants who progressed (i.e., worsened) or who remained stable (i.e., stable) across follow-ups considering the four groups in the 4-group (i.e., SCD-s, SCD-w, MCI-s, MCI-w) or considering the six groups in the 6-group (i.e., l-SCD-s, h-SCD-s, MCI-s, l-SCD-w, h-SCD-w, MCI-w) models. For each model, socio-demographic, health, functional, cognitive performance, cognitive reserve, affective and behavioral symptoms measured at baseline were used as predictors of participants’ progression.
The data set consisted of 253 triplets from participants and 41 input variables: age, gender, years of schooling, professional category, Peabody vocabulary, WAIS vocabulary, CBI comorbidity, IADL-Lawton informant’s score, CBI-burden, NPI-Q severity, NPI-Q stress, complaints from informant QAM, depression GDS-15, semantic fluency, letter fluency, ideational fluency, total score CAMCOG-R, logical memory I WMS-III, logical memory II WMS-III, paired associated I WMS-III, paired associated II WMS-III, immediate memory WMS-III, delayed memory WMS-III, primacy region CVLT, middle region CVLT, recency region CVLT, recall discriminability CVLT, long delay free recall (LDFR) CVLT, correct recognition CVLT, false positive recognition CVLT, intrusions free recall CVLT, intrusions cued recall CVLT, perseveration CVLT, semantic strategies short delayed free recall CVLT, semantic strategies long delayed free recall CVLT, serial strategies short delayed free recall CVLT, serial strategies long delayed free recall CVLT, working memory (WM) reading span, WM counting span, duration of stability, and total time.
ML analysis was performed using Python scripts and the Scikit-Learn library, with the Google Colaboratory tool [44]. For the training phase, a set of three ML classifiers (previously widely used in health research) was selected. In particular, we use the Random Forest Classifier and Extra Trees Classifier, based on trees that minimize a loss function, and the Support Vector Machines, which use hyperplanes that maximize the margin or distance from the line to the nearest points. We also applied a 10-fold stratified cross-validation in order to avoid biased or highly optimistic classification and to manage accurate imbalanced classes [45].
After the training phase, we computed widely used performance metrics, including score-based and graph metrics, to evaluate the adequacy of the ML prediction models. The true positives (TP: counts all instances of a group that are classified in that group), false positives (FP: counts all non-group instances that are classified in that group), true negatives (TN: counts all non-group instances that are not classified in that group), and false negatives (FN: counts all group instances that are not classified in that group) were computed. The following score-based metrics were calculated according to the correction in the classification for each of the groups considered in the 4-group model (i.e., SCD-s, SCD-w, MCI-s, MCI-w) and in the two 6-group models (i.e., l-SCD-s, h-SCD-s, MCI-s, l-SCD-w, h-SCD-w, MCI-w): 1) Recall or Sensitivity corresponding to the proportion of true positives [TP/(TP + FN)]; 2) Specificity corresponding to the proportion of true negatives [TN/(TN + FP)]; 3) Precision or Positive Predictive Value (PPV) corresponding to the ratio of correctly predicted positive observations to the total predicted positive observations [TP/(FP + TP)]; 4) Accuracy corresponding to the number of correct predictions divided by the total number of predictions [(TP + TN)/(TP + TN + FP + FN)]; 5) F1-score corresponding to the harmonic mean of Precision and Recall [2*(Recall*Precision)/(Recall + Precision)]; 6) Error-rate corresponding to the proportion of false positives and false negatives divided by the total number of predictions [(1-(TP + TN/TP + TN + FP + FN))*100]; and 7) Negative Predictive Value (NPV) corresponding to the ratio of correctly predicted negative observations to the total predicted negative observations [TN/(TN + FN)].
The decision about the applicability of the 4-group or 6-group models was made by comparing the score-based metrics and their respective confusion matrices. The most valid, informative, and parsimonious model for classifying stable and worsening SCD and MCI participants was selected for further predictive analysis.
The significance of the inter-group comparisons between stable and worsening l-SCD, h-SCD, and MCI groups for the predictive measures at baseline was established, and the p value was revised to avoid the type I error for multiple comparisons [46].
Predictive loadings associated with each measure were calculated for the global predictive model selected, and importance was established according to the predictive weights.
RESULTS
Descriptive scores at baseline for socio-demographic, health, subjective complaints, cognitive status, and functional measures for the SCD groups with low and high subjective complaints, and considering more and less strict criteria for determining complaint severity, are shown in Table 2.
We observed significant group differences in gender and QAM scores, but not in age, education, comorbidity, functionality, or cognitive status when comparing the strict and less strict criteria for the importance of complaints.
Total scores of the complaints questionnaire did not show normal distribution [Shapiro–Wilk’s test: W(253) = 0.973, p < 0.001] and therefore the reference scores for the extreme reference values in the distribution (5th and 95th) were calculated considering percentiles. The distribution was positively skewed (Skewness = 0.537; Standard error = 0.153) and adopted a slight leptokurtic shape (Kurtosis = 0.372; Standard error = 0.305).
Most of the SCD participants (79.4%) remained stable across the follow-ups, and only 20.58%progressed either to MCI (11.76%) or dementia (8.82%). The proportion of MCI participants who worsened reached 68.62%, with 60.78%converting to dementia and 7.84%progressing to multiple-domain MCI.
Predictive validity ignoring or considering the severity of complains
Sensitivity (recall), Specificity, Precision, Accuracy, F1-score, Error-rate and Negative Predictive Value (NPV) were calculated ignoring the severity of complains (for the 4-group models) (see Table 3) and taking the severity into account (6-group models) (see Table 4). Random forest algorithm yielded the best results for predictive validity, producing the most accurate classification, considering the predicted progression.
Predictive validity values for the 4-group model: SCD-stable, MCI-stable, SCD-worsening, MCI-worsening
The validity metrics (Random Forest) correspond to the accuracy of the classification of the participants in each of the groups.
Predictive validity values for the 6-group models: low-SCD-stable (l-SCD-s), high-SCD-stable (h-SCD-s), MCI-stable (MCI-s), low-SCD-worsening (l-SCD-w), high-SCD-worsening (h-SCD-w), and MCI-worsening (MCI-w) using the less strict criterion (5th percentile) and stricter criterion (95th percentile) for complaint severity
The validity metrics (Random Forest) correspond to the accuracy of the classification of the participants in each of the groups.
Ignoring (4-groups model) or taking into account (6-groups models) the severity of complains did not showed differences in classifying stable SCD groups with lower severity regarding Sensitivity, Precision, and Accuracy. However, taking into account severity (6-group models) improved the global accuracy in the worsened SCD group, particularly identification of true negatives (i.e., correct classification of participants who do not belong to the low or high SCD-w group, in relation to both the total number of true negatives, the specificity and the total of predicted negatives, NPV). The 6-group model was also globally better for simultaneously classifying the stable and worsening MCI participants. In summary, specificity, accuracy, and NPV were more favorable in the two 6-group models (considering both the more and less strict criteria for complaint importance) for predicting SCD-w, MCI-s, and MCI-w, regardless of the increased probability of mistaking the classification associated with the greater number of groups considered.
Strict or less strict criteria for the valid identification of participants’ progression
Regarding application of the less strict or strict criteria for identifying high versus low SCD participants, the stricter criterion (95th percentile) only yielded better metrics for classifying stable SCD groups. The metrics were similar or more favorable for the less strict criterion (5th percentile) in predicting progression in the SCD-w, MCI-s, and MCI-w groups. Closer analysis using the confusion matrix (see Fig. 1) showed the following: a) both criteria, particularly the stricter one, failed to correctly classify the h-SCD-s participants who were mainly considered l-SCD-s; b) the less strict criterion was better in successfully classifying the l-SCD-w and h-SCD-w participants; and c) the less strict criterion was better in the valid prediction of the stable and worsening MCI participants.
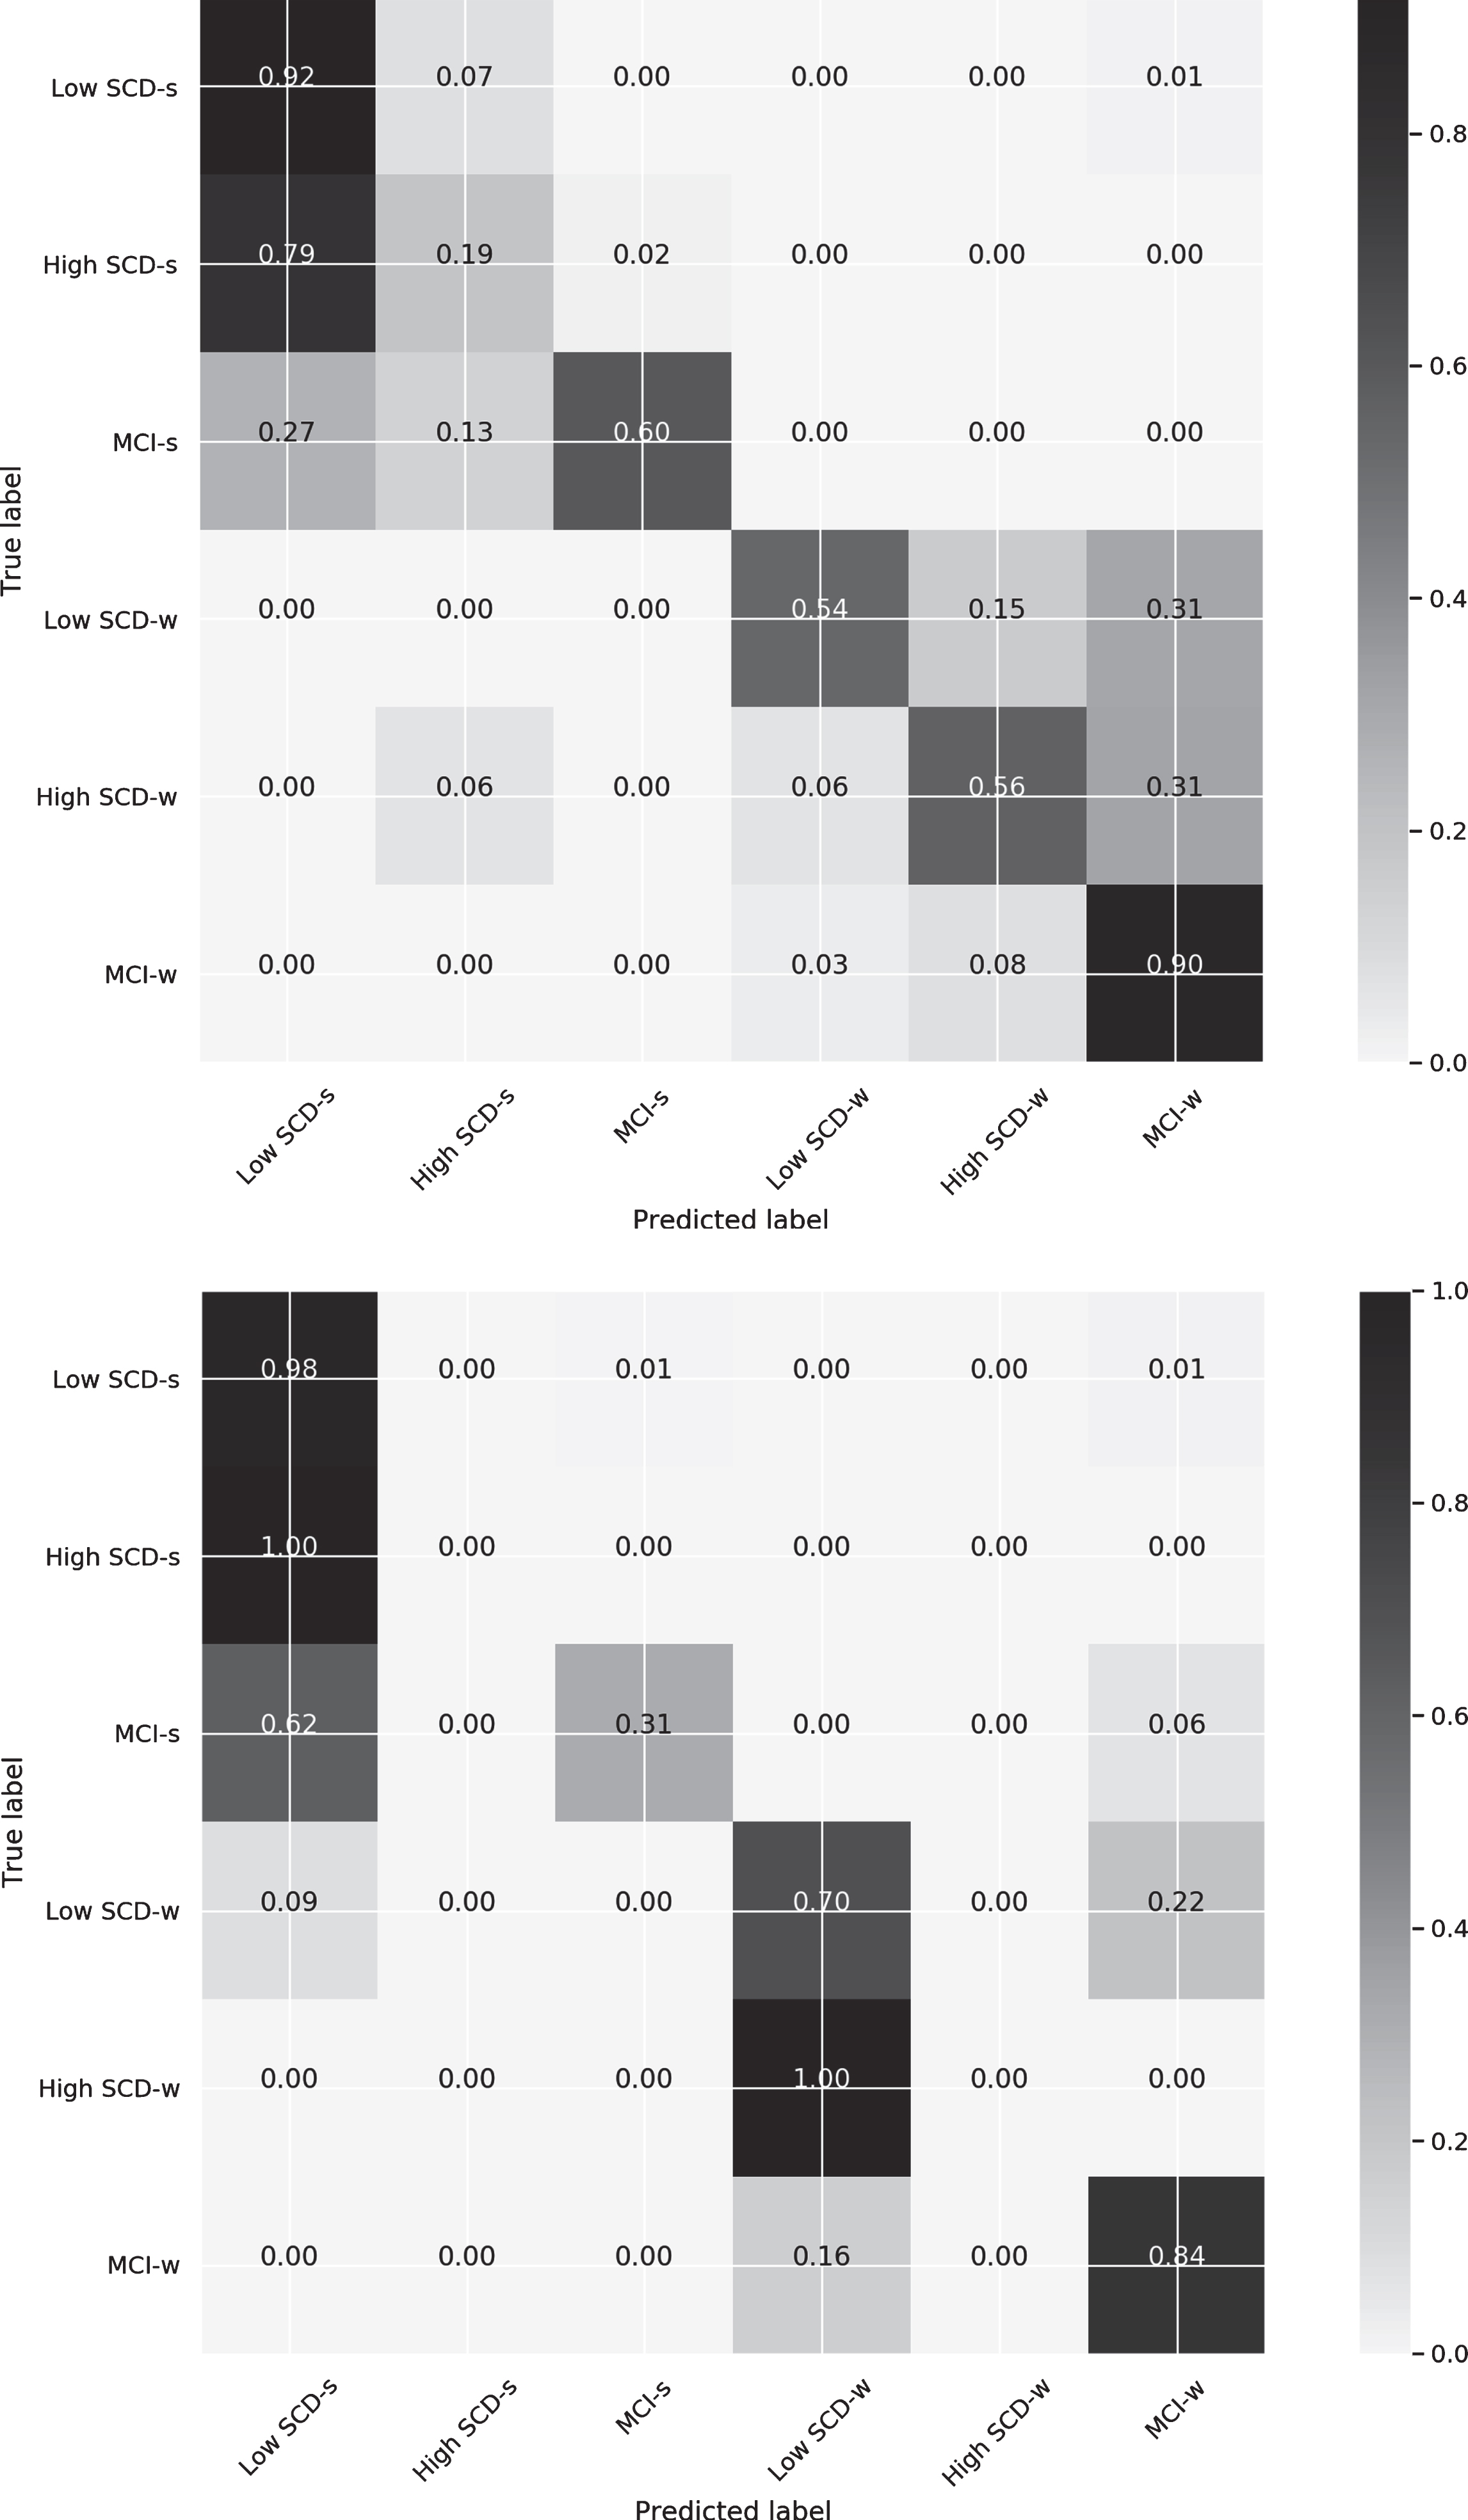
Confusion matrices for the 6-group classification model with the less strict (5th percentile) criterion for complaint severity (above) and the corresponding stricter criterion (95th percentile) (below).
When the less strict criterion of complaint severity was applied, the progression rate was 3.92%(1.96%to dementia) in the low SCD group, and 16.66%(6.86%to dementia) in the high SCD group. By contrast, when the stricter criterion was applied, the progression rate was 14.70%(6.86%to dementia) in the low SCD group and 5.88%(1.96%to dementia) in the high SCD group. Our results showed that the highest progression rates were observed in the groups that included not only those who complained the most but also those who complained moderately, whatever the rigor of the criterion used (i.e., in the high SCD group for the 5th percentile and in the low SCD group for the 95th percentile).
Descriptive values for the predictive measures for the two 6-group models with the less strict criterion for complaint severity were calculated, and pairwise differences between groups were estimated (see Table 5). To deal with familywise error rates for multiple hypothesis tests, the significance p level at 0.05 was corrected using the Shaffer & Holm procedure suggested by Holland & Copenhaver [46] for improvement of the Holm-Bonferroni method (pHolmhboxBonferroni < 0.00008).
Descriptive values (means, M, and standard deviations, SD) for the predictive variables and corrected Holm-Bonferroni estimation of the inter-group differences at baseline for the 6-group model (5th percentile)
*significance of the group comparison with Holm-Bonferroni correction (p < 0.00008) at baseline measurements; (1) l-SCD-s/h-SCD-s; (2) l-SCD-s/MCI-s; (3) l-SCD-s/l-SCD-w; (4) l-SCD-s/-h-SCD-w; (5) l-SCD-s/MCI-w; (6) h-SCD-s/MCI-s; (7) h-SCD-s/l-SCD-w; (8) h-SCD-s/h-SCD-w; (9) h-SCD-s/MCI-w; (10) MCI-s/l-SCD-w; (11) MCI-s/-h-SCD-w; (12) MCI-s/MCI-w; (13) l-SCD-w/h-SCD-w; (14) l-SCD-w/MCI-w; (15) h-SCD-w/MCI-w.
Group differences in predictive variables at baseline considering the less strict criterion (5th) of the 6-group model
Differences in predictive variables at baseline were mainly found when comparing the worsening MCI group and the stable SCD groups (i.e., both low SCD and high SCD). Thus, comparison of the worsening MCI group and the stable SCD groups showed that the worsening MCI participants were significantly older, remained stable for less time, and obtained lower scores in cognitive variables (semantic and ideational fluency tests, CAMCOG-R test, vocabulary WAIS subtest, episodic memory measures from the WMS, i.e., logical memory I and II, paired associates I and II, immediate and delayed memory, and the CVLT, i.e., recall discriminability, long delay free recall, recognition accuracy, false positives in recognition, intrusions in cued recall, total perseverations, semantic strategies in long and short delay free recall, recall in the recency and middle region tests, and reading and counting span). In addition, the worsening MCI group obtained lower scores in IADL than the high SCD-stable group.
Some differences at baseline were also observed when comparing the two types of stable SCD (i.e., low and high SCD) groups and the stable MCI groups. Thus, scores were higher for low SCD-stable group than for the stable MCI group in several measures of episodic memory (i.e., Logical memory II of the WMS, and long delay free recall, recall discriminability, false positives in recognition, and semantic strategies in short delay free recall of the CVLT). Significant differences between high SCD-stable and stable MCI groups were observed for the measures of episodic memory recall of the CVLT (i.e., intrusions in cued recall and recall discriminability).
Significant differences were also observed when the two worsening SCD (low and high SCD) were compared with the worsening MCI group. The worsening SCD participants scored better in long delay free recall and used more semantic strategies in short delay free recall of the CVLT than the worsening MCI group. High SCD-w participants also used more semantic strategies in long delay free recall of the CVLT than the worsening MCI group.
The only significant difference between stable and worsening SCD groups was found between high SCD-worsened and low SCD-stable groups, only for the logical memory I subtest of the WMS.
Significant differences were found in the length of time participants remained stable, in all pairwise comparisons between stable and worsening, regardless of group (SCD or MCI). No significant differences between the SCD and MCI groups were observed either when both were stable or when they worsened.
Factors importance in predicting progression considering the less strict criterion (5th) of the 6-group model
The importance of the factors used in predicting progression of conditions with the less strict criterion (5th percentile) for this 6-group model was established by computing and ranking the standardized variable loadings of the algorithm that provided the best prediction metrics (i.e., Random Forest). The sum of the predictive loads associated with the 10 variables selected (i.e., 24.4%of the total data set) for the stable and worsening groups accounted for around 60%of the total importance of the predictive algorithm.
The algorithm showed that the following measures, ordered by loadings, mainly predicted progression: recall of words from the primacy portion (primacy reg CVLT: w = –0.0434), paired associates recall (paired assoc. I WMS: w = 0.0176; paired assoc. II WMS: w = 0.0222), professional category (Professional category: w = 0.0208), propensity to use of semantic strategies in the long delay free recall (semantic strategy LDFR CVLT: w = 0.0170), comorbidity (Comorbidity CCI: w = 0.0164), recognition accuracy (correct recogn. CVLT: w = 0.0151), education (Years of schooling: w = 0.0131), working memory counting span (counting WM: w = 0.0127), and vocabulary (Vocabulary WAIS: w = 0.0113).
DISCUSSION
Our main objectives were to analyze the validity of considering SCD subgroups according to SCCs’ severity and to compare two extreme thresholds (5th and 95th percentiles) when applying ML algorithm in predicting progression of SCD and MCI participants.
Regarding progression, our findings indicated that most of the SCD participants (79.4%) remained stable across the follow-ups [11, 30] as only 20.58%progressed either to MCI (11.76%) or dementia (8.82%). By contrast, worsening of MCI participants reached 68.62%, with 60.78%converting to dementia and 7.84%progressing to multiple-domain MCI after 54–72 months of follow-up.
In line with the increased risk of progression and conversion estimated for SCD participants relative to non-complainer older adults [8, 9], we observed considerably higher rates of progression and conversion in participants with moderate to high complaints (above the 5th percentile) than in those with low levels of complaints (below the 5th percentile) as also observed in normative aging [11]. Similarly, even using the stricter criterion (95th), higher rates of progression and conversion were observed in the group in which participants with moderate to high complaints were classified together (i.e., low SCD).
Regarding quantification of SCC severity, our findings showed that joint consideration of the SCD participants classified according to stability, but without distinction by severity (i.e., the 4-group model), provided better predictive validity than the 6-group model for classifying stable SCD participants. However, when SCD participants were classified according to complaint severity, differentiating low and high SCCs (i.e., with the any of 6-group models), the predictive validity metrics improved overall for the worsening SCD and stable and worsening MCI participants. These results highlight the importance of considering the severity of SCCs in predicting progression along the continuum of the pre-symptomatic and prodromal stages of dementia. This is particularly important for SCD participants who progress to MCI or dementia, because it enables more precise identification of participants who do not really belong to the l-SCD-w and h-SCD-w groups [6, 32]. Our findings give partial empirical support to the need to evaluate SCC severity by rating the frequency of perceived difficulties through items that assess complaints on a scale ranging from low to high [31, 32].
Comparison of two extreme thresholds for quantifying complaint severity indicated that the less strict criterion was better with almost all the metrics of predictive validity for predicting progression in participants with SCCs. Thus, even though both criteria failed to correctly classify the stable h-SCD participants (i.e., high SCD-stable were mostly classified as low SCD-stable), the less strict criterion was more successful in classifying the worsening SCD participants, and especially in accurately classifying stable and worsening MCI participants. Therefore, the predictive validity in our sample of participants with SCCs improved when the cognitively unimpaired participants declaring low frequency of cognitive difficulties (i.e., equal or below the 5th percentile) were distinguished from the moderate to high complainers (i.e., above the 5th percentile).
Concerning the baseline intergroup differences, our findings showed significant differences mainly between the worsening MCI and the stable SCD groups (i.e., l-SCD-s, h-SCD-s). Participants classified with worsening MCI were significantly older, progressed faster, and obtained lower scores at baseline in the vast majority of the cognitive measures (i.e., recall and recognition episodic memory, cognitive status, vocabulary, and working memory and executive measures) than the SCD-stable (both low and high) groups. The highly stable SCD participants even showed better functional status and use of semantic strategies than the MCI-worsened group at baseline. However, Stable SCD (i.e., l-SCD-s, h-SCD-s) and MCI-worsened groups did not differ significantly in gender, comorbidity, behavioral disturbance, depression, informant complaints, burden, cognitive reserve proxies (i.e., schooling, professional achievement) or total time in the study.
In contrast to the results reported by Bessi et al. [10] who did not implement corrections to avoid type I errors, we did not find any significant differences when comparing the stable and worsened MCI groups or the stable and worsened SCD groups at baseline. Thus, the only significant difference between stable and worsening SCD groups were found in a measure of episodic memory recall (i.e., logical memory I subtest), indicating lower scores for high SCD-worsening participants than for low SCD-stable participants and enhancing the importance of episodic memory measures in discriminating SCD participants who progress along the continuum of cognitive decline [18, 47].
As expected, the stability of diagnosis over time indicated significantly faster progression in worsening than stable groups, both in MCI and SCD participants. Although previous studies reported faster progression rates in MCI participants with enhanced risk markers [5, 48] and SCD [11, 50], we cannot reach relevant conclusions about this aspect, as we did not analyze time differences according to risk factors or severity of progression among those participants who worsened.
The variables with a major role in conforming the algorithm for predicting stable and worsening SCD and MCI participants were those related to working memory/executive functions (counting span, semantic strategies), episodic memory recall (primacy recall, paired associates’ recall) and recognition, proxies for cognitive reserve (schooling, professional attainment, vocabulary), health (comorbidity) and duration of stability of diagnosis. Overall, our results support the important role of working memory and executive functions [17, 51] and episodic memory [18, 47] measures, as well as the modulating role of protective and risk factors such as cognitive reserve and health status in jointly predicting progression of SCD and MCI participants.
Our findings highlight the important contribution of the multimodal ML approach in predicting progression to Alzheimer’s disease [29]. Thus, several of the most important measures in predictive algorithms (e.g., primacy recall, comorbidity, schooling, professional category, depressive symptomatology) were not significant in the comparison of stable and worsening groups at baseline after Holm-Bonferroni correction, even in the comparison of groups at the opposite extremes of the cognitive decline continuum (i.e., stable SCD groups and worsening MCI group). Moreover, calculation of factor importance in predicting progression in SCD and MCI, and the consequent simplification to the most relevant factors enables improvements in future protocols by focusing on these variables.
Further studies, preferably with a larger sample size, should be carried out to minimize the risk of overfitting and to establish specific predictors for each stable and worsening SCD and MCI groups. The validity of the classification of SCD participants according to the severity of the complaints, indicated by more or less strict criteria, should be analyzed in community samples. Additional studies should be carried out to specifically search for significant predictive associations in each stable and worsening SCD and MCI groups.
Footnotes
ACKNOWLEDGMENTS
This work was financially supported through ERDF founds by the National Research Agency (Spanish ‘Ministry of Science, Innovation and Universities) (Projects Ref. PSI2014-55316- C3-1-R and PSI2017-89389-C2-1-R), the Galician Government (Consellería de Cultura, Educación e Ordenación Universitaria; axudas para a consolidación e estruturación de unidades de investigación competitivas do Sistema Universitario de Galicia; GI-1807-USC: Ref. ED431-2017/27), and the Galician Dementia Research Network (GAIN, Xunta de Galicia; grant IN607C-2017/02).