




Abstract
Background:
Growing evidence supports that receptor for advanced glycation end products (RAGE) and glyoxalase-1 (GLO-1) are implicated in the pathophysiology of Alzheimer’s disease (AD). Extracellular vesicles (EVs) are nanovesicles secreted by almost all cell types, contribute to cellular communication, and are implicated in AD pathology. Recently, EVs are considered as promising tools to identify reliable biomarkers in AD.
Objective:
The aim of our study was to determine the levels of RAGE and GLO-1 in circulating EVs from mild cognitive impairment (MCI) and AD patients and to analyze their correlation with the clinical Mini-Mental State Examination and Montreal Cognitive Assessment scores. We have studied the possibility that neuronal cells could release and transfer GLO-1 through EVs.
Methods:
RAGE and GLO-1 levels were measured in circulating EVs, respectively, by Luminex assay and western blot. Released-EVs from SK-N-SH neuronal cells were isolated and GLO-1 levels were determined by western blot.
Results:
Our data showed higher levels of RAGE in EVs from late AD patients while GLO-1 levels in EVs from early AD were lower as compared to control and MCI patients. Interestingly, levels of RAGE and GLO-1 in EVs were correlated with the cognitive scores regardless of age. For the first time, we demonstrated that GLO-1 was released from neuronal cells through EVs.
Conclusion:
Although more samples will be needed, our preliminary results support the use of peripheral EVs cargo as new tools for the discovery of peripheral AD biomarkers.
Keywords
INTRODUCTION
Alzheimer’s disease (AD) is the most common cause of dementia and its prevalence continues to increase worldwide in the absence of prevention strategies and effective treatments [1]. AD is pathologically characterized by the accumulation of the amyloid-β (Aβ) plaques and hyperphosphorylation of tau proteins that forms neurofibrillary tangles (NFTs) [2]. Clinically, AD is defined by a progressive decline in cognitive function and memory loss as well as behavior changes [3]. To date, AD diagnosis is based on the patient history, the clinical scores on cognitive tests which could be completed with the phosphorylated tau and Aβ42 ratio in the cerebrospinal fluid (CSF) combined with the morphology and functional brain imaging [4]. However, the relative invasiveness of the CSF sample collection and the high costs of Aβ and tau brain-imaging limit their usefulness for routine clinical testing and follow-up assessments.
Therefore, there is a growing need to identify peripheral biomarkers which can predict AD progression [5].
Accumulating evidence supports the implication of receptor for advanced glycation end products (RAGE) and glyoxalase-1 (GLO-1) in the pathophysiology of AD. RAGE can bind a variety of ligands such as advanced glycation end products (AGEs), Aβ, high mobility group box-1 protein (HMGB1), and several S100 family proteins [6]. In the central nervous system (CNS), the binding of AGEs, as well as Aβ to RAGE, induces pathophysiological and cellular responses including oxidative stress, the release of pro-inflammatory cytokines such as TNF-α and IL-6 via the NF-κB activation, BACE1 overexpression, Aβ generation, senile plaque formation, tau hyperphosphorylation and glial cells activation [7–11]. RAGE also plays a key role as cargo transporter by facilitating the influx of circulating blood Aβ across the blood-brain barrier (BBB) [12, 13]. In contrast to RAGE, its soluble form (sRAGE), which is generated by a proteolytic cleavage of RAGE located at the membrane surface or by alternative splicing, can interact with circulating ligands and prevent their neurotoxicity [14]. In AD and MCI patients, there is a decrease in circulating RAGE levels [15–17]. In the AD brain, the expression of RAGE was found to be higher in neuronal and glial cells in hippocampus and cortex as compared to control brains [18]. In glial cells, RAGE can activate the transcription factor NF-κB and the expression of TNF-α and GFAP [19].
GLO-1, a cytosolic protein, is the unique scavenging enzyme of methylglyoxal (MG) and glyoxal (GO) which are the most important precursors of AGEs. GLO-1 catalyzes the conversion of MG to S-D-lactoylglutathione with reduced glutathione (GSH) as a cofactor [20]. MG and GO induced cellular damages by increasing the intracellular reactive oxygen species production, tau hyperphosphorylation, mitochondrial dysfunction, and Aβ release and could therefore contribute to the pathogenesis of neurodegenerative diseases [21]. In peripheral, we have recently demonstrated that the serum levels of MG and GO were increased in MCI patients [22]. In AD brain, GLO-1 expression is upregulated in the early stages of AD but is gradually downregulated in the middle and late stages of AD [23].
Extracellular vesicles (EVs), a set of various membrane-bound particles such as exosomes and microvesicles, are secreted by all cells and contains a variety of membrane and intracellular proteins as well as lipids and nucleic acids [24]. EVs are implicated in cell-to-cell communication by transferring many biological materials from donor cells and their cargos participate in physiological and pathogenic processes in recipient cells [25, 26]. In brain, EVs are key playersRAGE also plays a key role as cargo transporter by of the intercellular communication between neurons, astrocytes, oligodendrocytes and microglia [27, 28]. Many studies have demonstrated the implication of EVs in AD pathogenesis by their capacity to deliver and propagate misfolded proteins related to AD such as Aβ and hyperphosphorylated tau [29–31]. Moreover, EVs have attracted attention as a potential reservoir of biomarkers for neurodegenerative diseases due to their ability to cross the BBB in both directions [32–34]. Some recent studies have indicated that neuronal derived-exosomes can be isolated from the bloodstream, using a surface located protein, L1-cell adhesion molecule (L1CAM) [35–38]. However, this strategy could be non-specific for the detection of neuronal exosomes, since L1CAM are also expressed in other cell types such as kidney [39, 40]. Recently, we have shown variation of the levels of the RAGE ligands, carboxymethyl lysine (CML) and their precursor (MG and GO), and Aβ142 in peripheral and in total circulating EVs from AD, MCI patients and control subjects [22, 42]. We hypothesize that differential regulation of RAGE and GLO-1 levels in the total circulating EVs could offer an interesting alternative to identify potential AD progression markers. This study aims to compare the levels of RAGE and GLO-1 in circulating EVs and in serum between controls, MCI and AD patients and to evaluate their association with Mini-Mental State Examination (MMSE) and Montreal Cognitive Assessment (MoCA) cognitive tests. Furthermore, we have explored the possibility of the release of GLO-1 by neuronal cells in culture through EVs.
MATERIALS AND METHODS
Study population
Venous blood samples were collected from control subjects, MCI and different stages of AD patients (early stage (ES), moderate (MS) and, late-stage (LS)). Blood samples were collected after overnight fasting and centrifuged to collect serum fractions which were stored at –80°C until analysis. Patients’ recruitment was performed by the Memory Clinic of Sherbrooke and written informed consent was provided before blood and data collection (protocol #2010-21/Fülöp). For all participants, the global cognitive function was assessed by the MMSE and MoCA [43, 44]. Control subjects were defined according to the SENIEUR protocol to select only those in good health conditions, to distinguish between any alterations caused by aging per se and those caused by disease [45]. Cognitive test scores and Petersen criteria were performed for MCI selection [46]. The criteria of the National Institute of Neurological and Communicative Disorders and Stroke and the Alzheimer’s Disease and Related Disorders Association (NINCDS_ADRDA) and the fourth edition of the Diagnostic and Statistical Manual of Mental Disorders (DSM-IV) were used for AD patient selection [47]. The inclusion and exclusion criteria used in the study are indicated in Supplementary Table 1.
Isolation and characterization of EVs from serum samples and neuronal SK-N-SH culture media
EVs from serum and SK-N-SH culture media were isolated by precipitation method using the Total Exosome Isolation reagent (Invitrogen™ by Life Technologies Inc., Carlsbad, CA, USA) and characterized, following the methodological guidelines to study EVs, using transmission electron microscopy (Hitachi H-7100 TEM instruments), nanoparticle tracking analysis (Nanosight NS300 system), and western blot analysis (FluorChem HD2 system) as previously described [22, 42].
Determination of RAGE and GLO-1 levels
The levels of RAGE in serum EVs were measured using a Luminex assay (R&D Systems, Inc., USA) according to the manufacturer’s instructions. Diluted samples from all participants were added to pre-coated beads with specific human RAGE antibodies. After the addition of biotinylated detection antibodies and phycoerythrin (PE)-conjugated streptavidin, beads were read using the Luminex 100/200, and data were analyzed using Xponent 4.2 software. Concentrations of RAGE in EVs were normalized with the total protein amount of EVs.
The levels of GLO-1 were evaluated by western blot. Briefly, 20μg of serum or EVs proteins were heated at 95°C in the presence of a loading buffer. The mixture was separated using 10%SDS-PAGE. After protein separation, the gel was transferred to the PVDF membranes with the wet transfer method and the membranes were blocked for 1 h at room temperature with TBS containing 5%BSA. Then, we incubated each membrane with the corresponding primary antibody GLO-1 (1/2000) (MyBiosourseInc, San Diego, CA, USA) in TBS with 5%BSA and incubated overnight at 4°C. After 3 washes for 10 min, HRP-conjugated anti-rabbit antibodies (1/2000) (Cell Signaling Technologies) were incubated in TBS with 5%BSA. Finally, the membrane was washed 3 times for 10 min and the protein bands were visualized by the chemiluminescence detection using ECL substrate (Bio-Rad), and their levels were analyzed with the luminescent imaging system FluorChem. Briefly, each western blot membrane was scanned, and the obtained digital data were processed through the luminescent imaging system FluorChem. After overexposure checking, the background means value (BMV) was then subtracted from the original digital data to obtain the background-free image. The integrated densitometric value associated with each band was then calculated as the sum of the density values overall the pixels belonging to the considered band. The band densitometric value was then normalized to the total proteins signal intensity and the ratios were calculated.
To evaluate the presence and the amount of GLO-1 in neuronal SK-N-SH cells and EVs, total proteins from SK-N-SH cells and EVs were extracted with RIPA buffer containing a cocktail of protease and phosphatase inhibitors and were measured using BCA assay. The same protein amount (20μg) was used to determine GLO-1 as described above by western blot.
Statistical and correlation analysis
SPSS or GraphPad Prism programs were performed for data analysis. All data were presented as mean±SEM. p-value less than 0.05 was considered statistically significant. After the verification of the normal distribution, statistical analyses between groups of the clinical study were performed using One-Way ANOVA analysis followed by LSD post hoc test. For non-normally-distributed data including serum GLO-1 levels, we performed the nonparametric Kruskal-Wallis test followed by Dunn’s post hoc test to determine significant differences between groups. Correlation analyses were performed by the linear regression analysis using the Pearson coefficient of correlation. Receiver-operating characteristic (ROC) curves and the area under the curve (AUC) were used to determine the ability of RAGE and GLO-1 levels to differentiate between groups of patients. Comparison of GLO-1 levels between cells and neuronal derived-EVs was analyzed by the Student’s t-test.
RESULTS
Control subjects, MCI, and AD patients’ characteristics
Gender, age and scores of cognitive tests (MMSE and MoCA) of participants are presented in Table 1. Significant differences were observed in the mean age between control subjects, MCI and AD patients. MMSE scores were significantly lower in AD groups while MoCA scores were significantly lower in MCI patients and AD groups as compared to control subjects. LS AD patients were not able to answer or complete the MMSE and MoCA tests.
Clinical characteristics of the studied population
Statistical analysis was performed using the One-Way ANOVA followed by LSD test with **p < 0.01 and ***p < 0.001 versus control subjects. Values are mean±standard error of the mean (SEM). AD, Alzheimer’s disease; ES, early stage of Alzheimer’s disease; MS, moderate stage of Alzheimer’s disease; LS, late stage of Alzheimer’s disease; MMSE, Mini-Mental State Examination; MoCA, Montreal Cognitive Assessment; ND, not determined.
RAGE levels in peripheral EVs
Circulating EVs from control subjects, MCI and AD patients were isolated and characterized as previously described [41, 42]. Our results showed that peripheral EVs contained RAGE and levels were not different between controls, MCI and AD groups except for the late stage of AD which expressed higher levels as compared to other groups (Fig. 1).
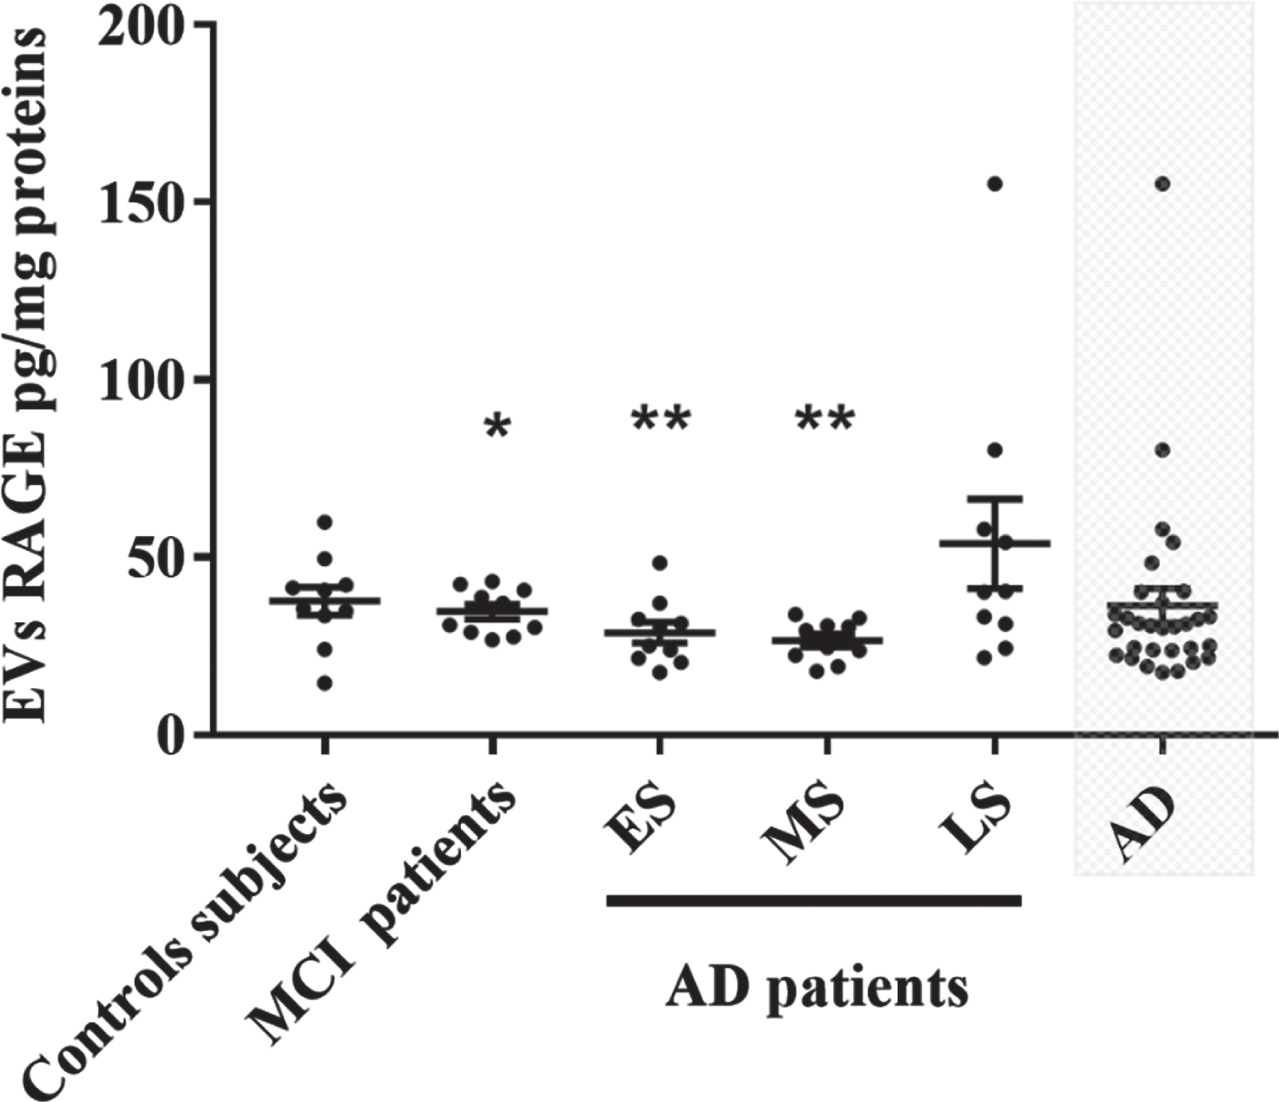
EVs RAGE levels in control subjects, MCI and different groups of AD patients. Each point represents the value of one subject. Difference between groups were analyzed with the One-Way ANOVA followed by LSD test. Values are mean±SEM with *p < 0.05 and **p < 0.01 versus LS AD patients. AD, Alzheimer’s disease; ES, early stage of Alzheimer’s disease; MS, moderate stage of Alzheimer’s disease; LS, late stage of Alzheimer’s disease; EVs, extracellular vesicles.
GLO-1 levels in serum and peripheral EVs
GLO-1 was detected in serum and EVs from all groups (Fig. 2). GLO-1 levels in serum were not different among the five groups (Fig. 2A). Interestingly, GLO-1 levels in EVs were significantly decreased in AD group and specifically in the early AD group as compared to control subjects and MCI patients (Fig. 2B). To note, GLO-1 levels in EVs were higher than in serum suggesting that, in EVs, GLO-1 is protected from degradation.
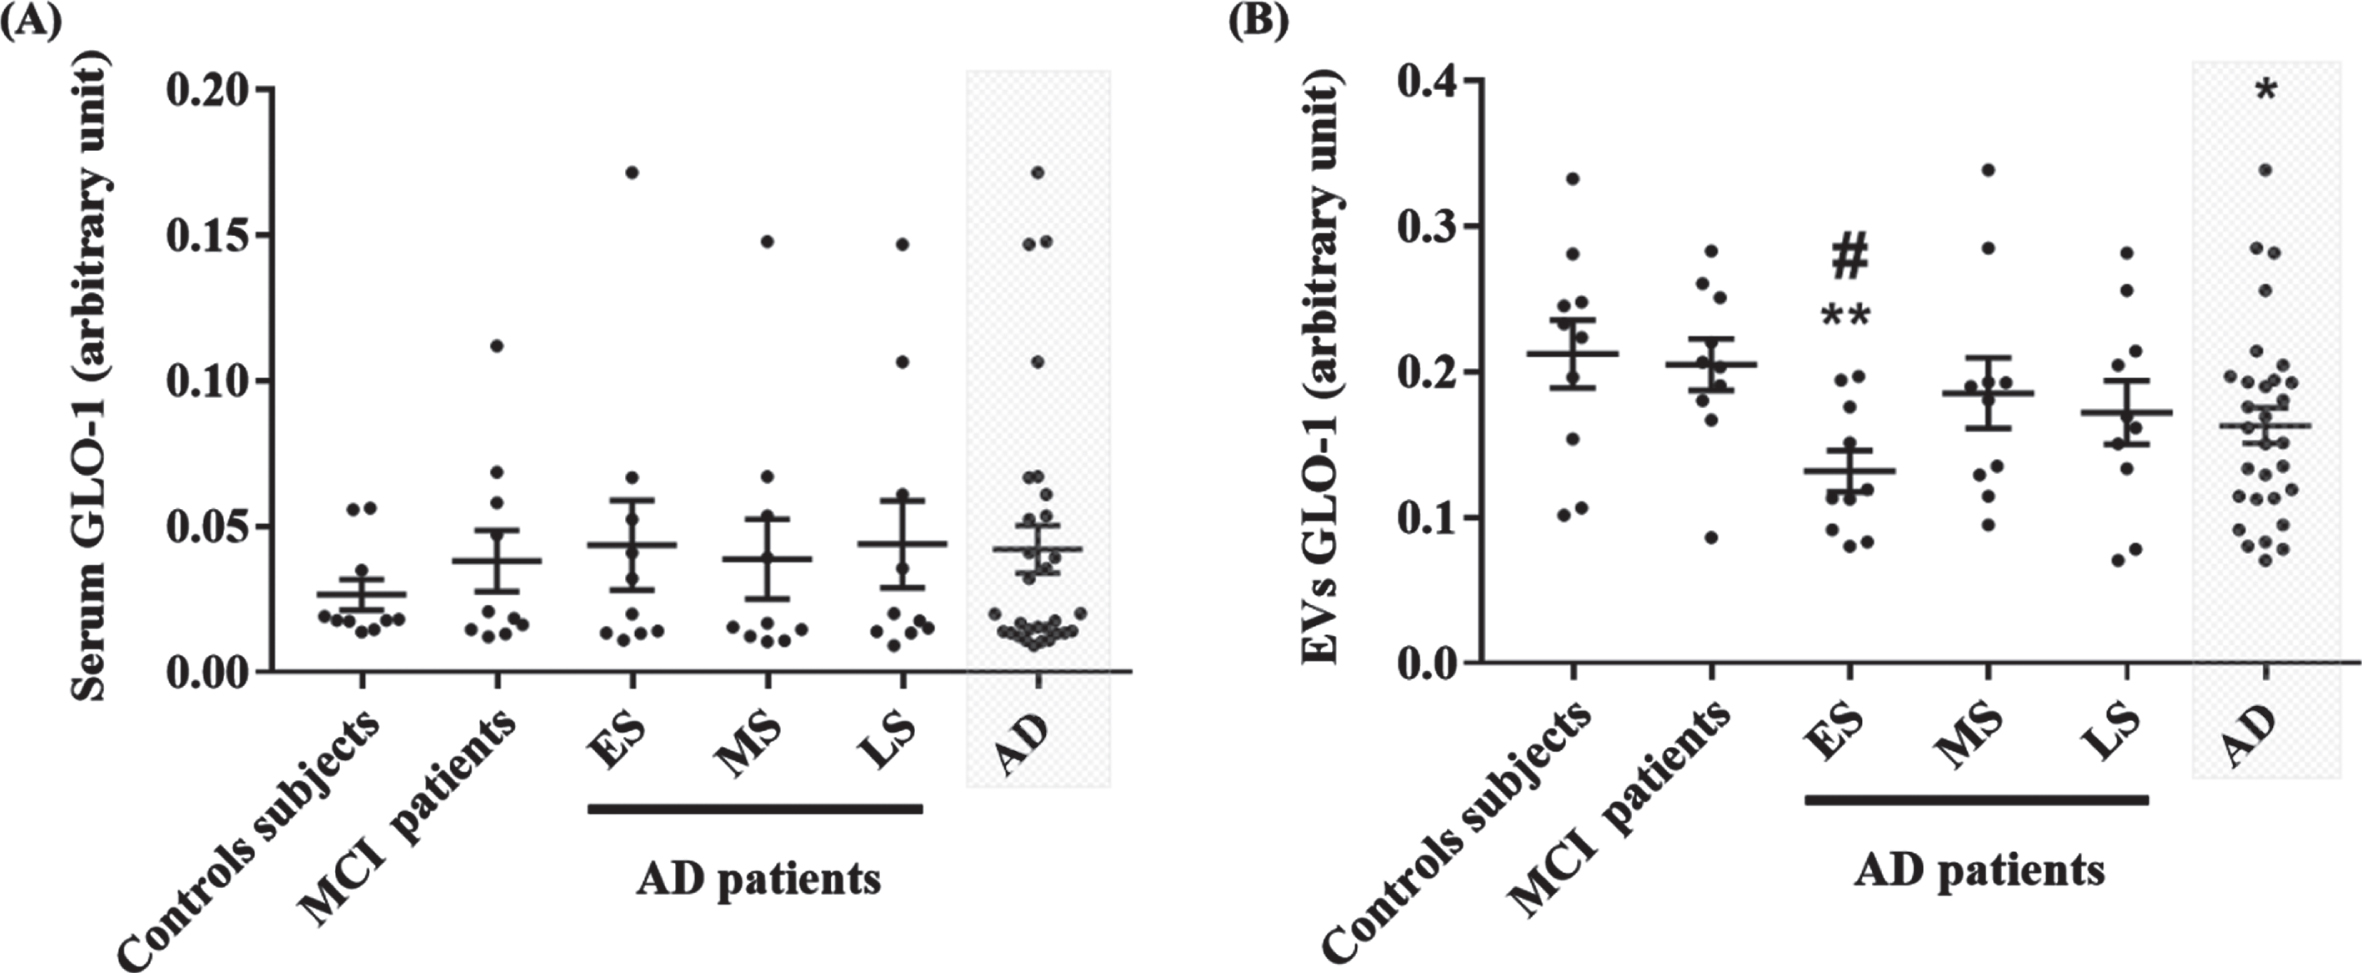
Evaluation of GLO-1 levels in serum and EVs from control, MCI and different AD groups by Western blot. Quantitative results of GLO-1 in serum (A) and in EVs (B). Each point represents the ratio of GLO-1 band intensity and the total proteins intensity stained with the Coomassie Blue. The difference between groups for GLO-1 levels in EVs was analyzed with One-Way ANOVA followed by the LSD post hoc test. The difference between groups for GLO-1 levels in serum was analyzed with the nonparametric Kruskal-Wallis test followed by Dunn’s post hoc test. Values are mean±SEM with *p < 0.05 and **p < 0.01 versus control sub-jects. #p < 0.05, versus MCI patients.
RAGE and GLO-1 levels in EVs differentiate stages of AD
The ability of RAGE and GLO-1 levels in EVs to distinguish different AD stages from MCI patients and control subjects was assessed using the ROC analysis. We found that RAGE levels in EVs provide a fair classification of the LS AD patients from ES and MS AD patients with an area under the curve (AUC) of 0.79 (95%CI: 0.58–0.99, p = 0.02) and 0.83 (95%CI: 0.63–1.02, p = 0.01), respectively (Fig. 3A, B). Cutoff values of the ROC curve analysis are given in (Supplementary Table 2).
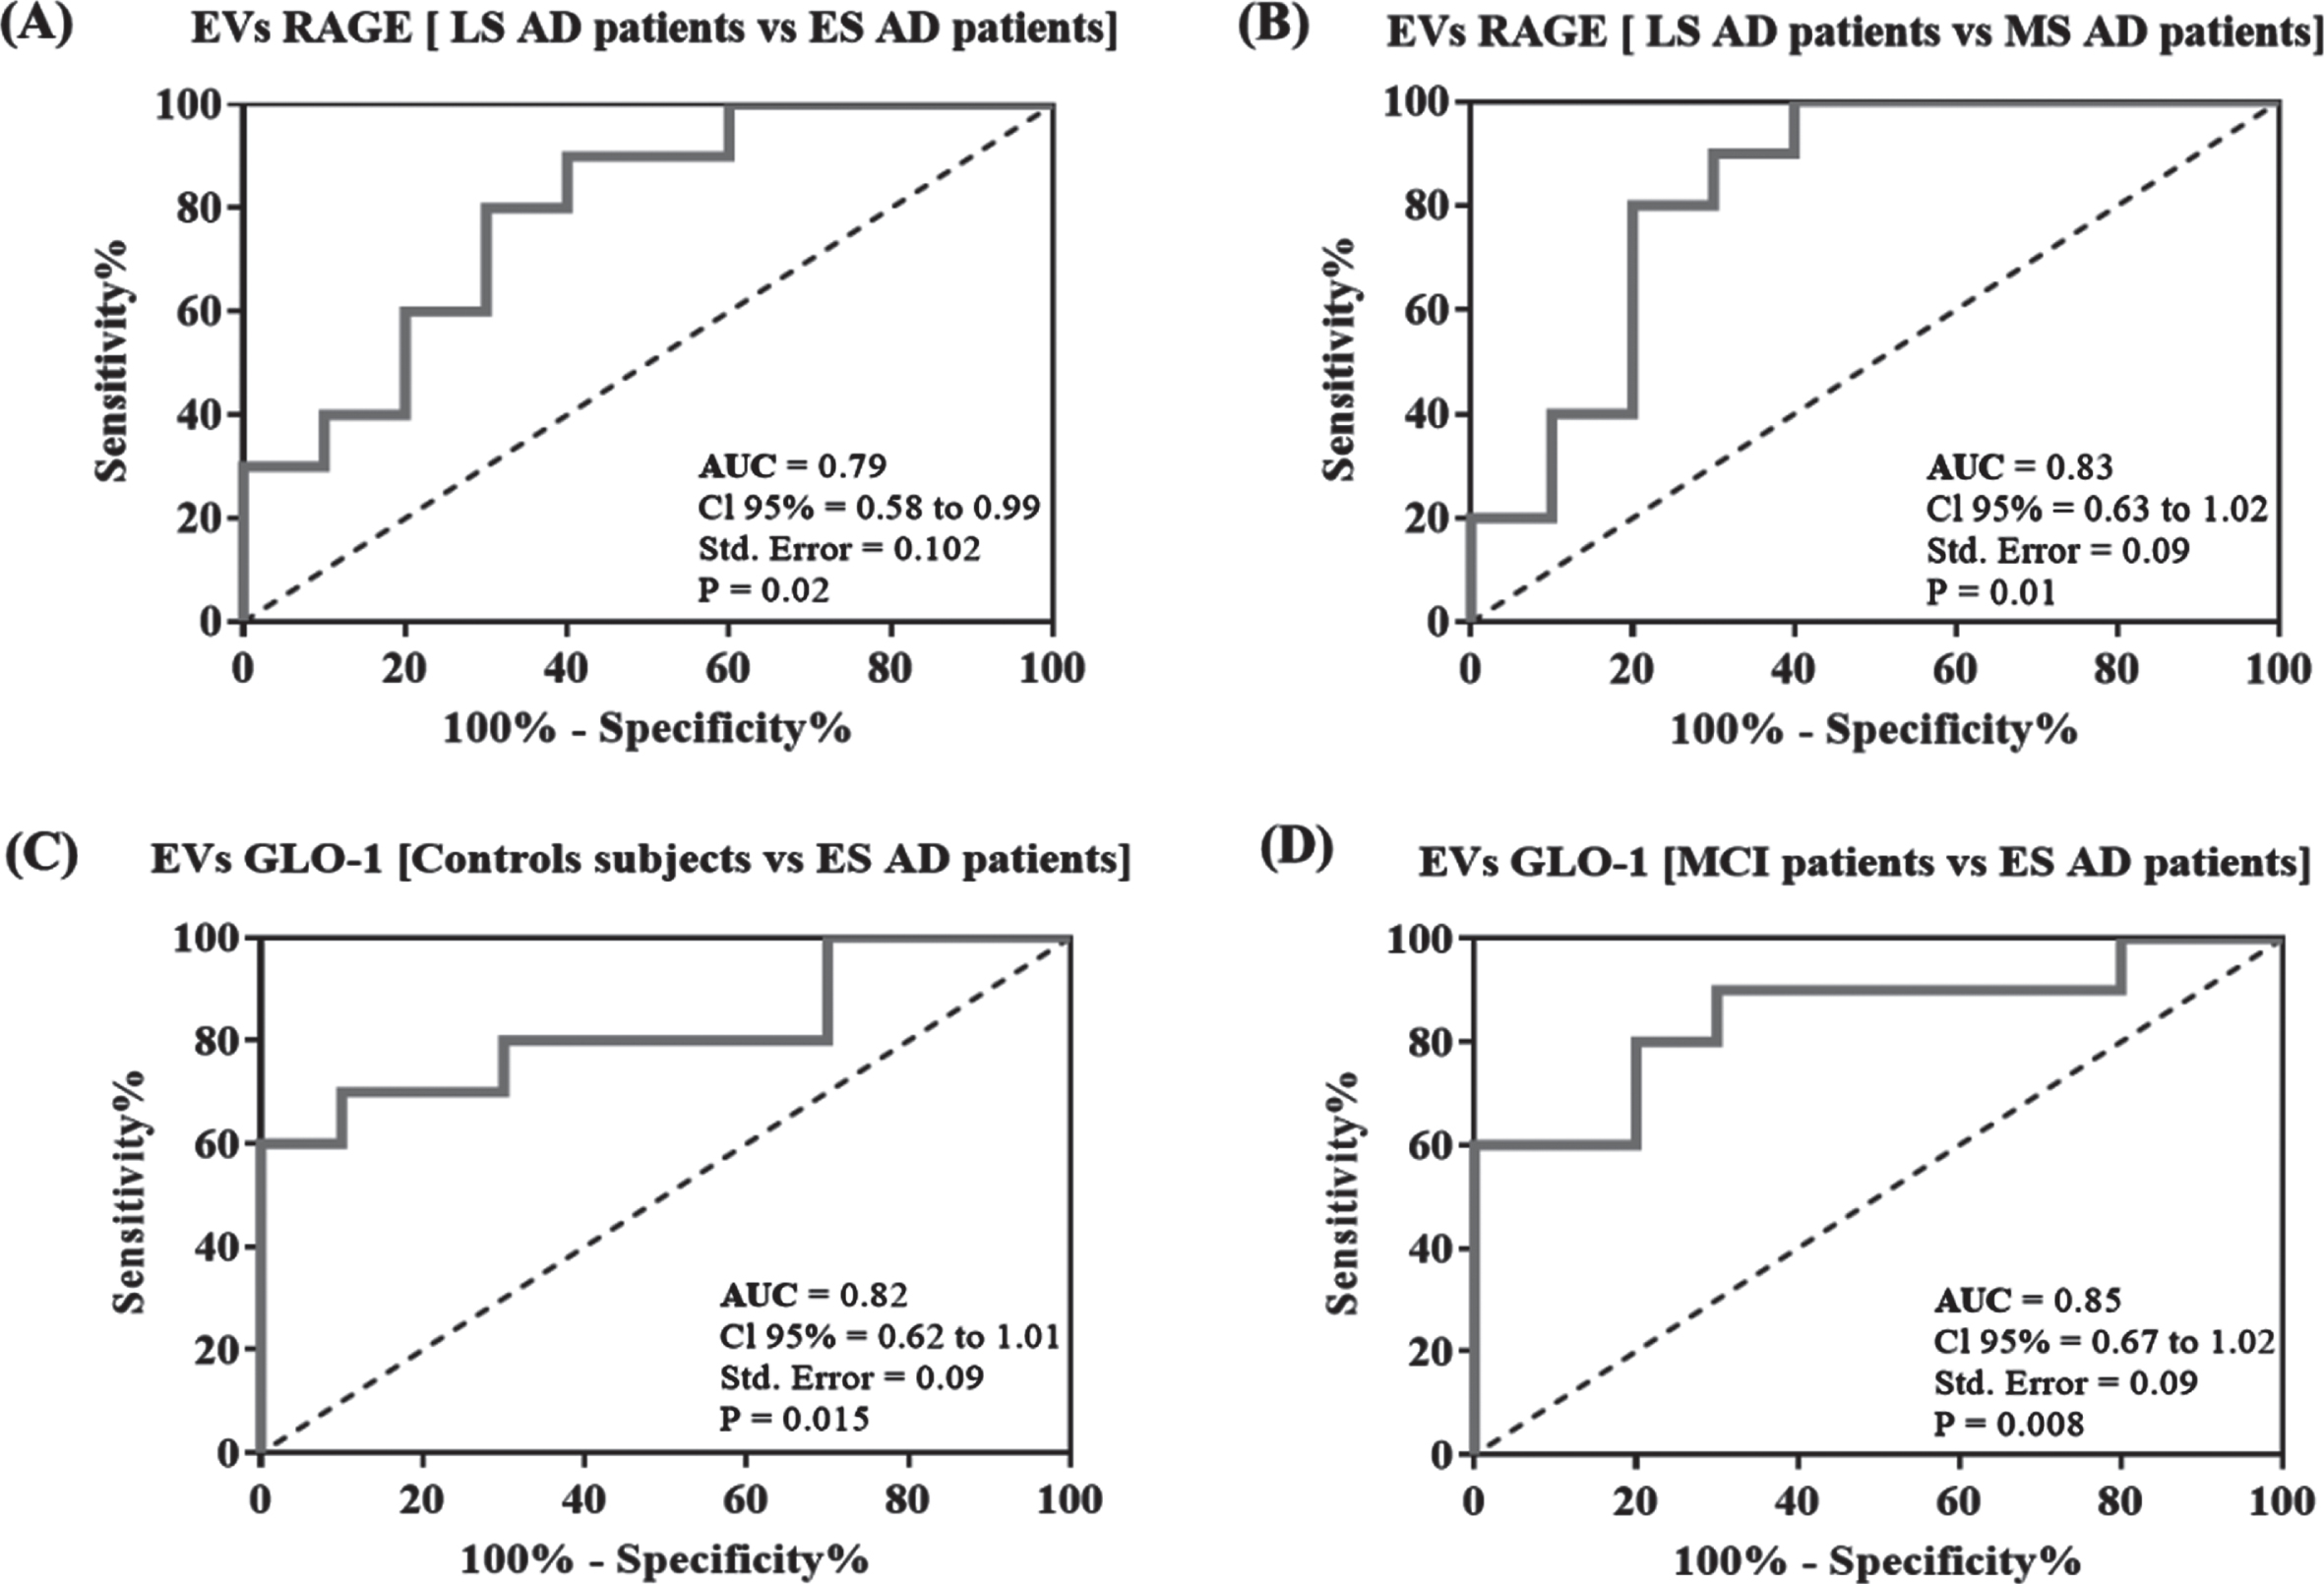
Receiver operating characteristic (ROC) curve analysis. Plots represent the performance of RAGE levels in EVs to differentiate LS AD patients to ES and MS AD patients (A, B) and the performance of GLO-1 levels in EVs to differentiate ES AD patients to MCI and control subjects (C, D). Area under the curve (AUC) values, 95%confidence intervals (CI 95%), standard error (Std. Error) and p values are indicated on the curve.
To distinguish ES AD patients from control subjects and MCI patients, ROC curves for GLO-1 levels in EVs showed high classification accuracy with AUC of 0.82 (95%CI: 0.62–1.01, p = 0.015) and 0.85(95%CI: 0.67–1.02, p = 0.008), respectively (Fig. 3C, D).
Correlation between RAGE, GLO-1 levels, and cognitive scores
Pearson correlation was used to analyze the correlation between RAGE, GLO-1 levels, and the cognitive scores (MMSE and MoCA). We found a correlation between the RAGE levels in EVs and the MMSE but not with the MoCA scores (Fig. 4A, D). Meanwhile, the GLO-1 levels in EVs were correlated with the MoCA but not with MMSE scores (Fig. 4B, E). No correlation was found between the GLO-1 levels in serum and both the MMSE or the MoCA scores (Fig. 4C, F). Levels of RAGE and GLO-1 were not age-dependent (Supplementary Figure 1).

Correlation between RAGE, GLO-1 levels, and the cognitive scores (MMSE and MoCA) analyzed by the Pearson correlation.
Detection of GLO-1 in neuronal EVs
We have recently shown that neuronal cells were able to release RAGE via EVs. However, the release of GLO-1 in neuronal derived-EVs remains to be demonstrated [22]. For this, we have isolated EVs from the neuronal SK-N-SH cells. We have identified two forms of GLO-1, the monomeric 21 kD and the dimeric forms 46 kD. To note, both forms were present in neuronal and in neuronal derived-EVs but not in peripheral EVs from patients who have only the dimeric form (Fig. 5A). Also, the levels of both forms of GLO-1 in neuronal derived-EVs represent only a small fraction of the total neuronal GLO-1 (Fig. 5B, C).
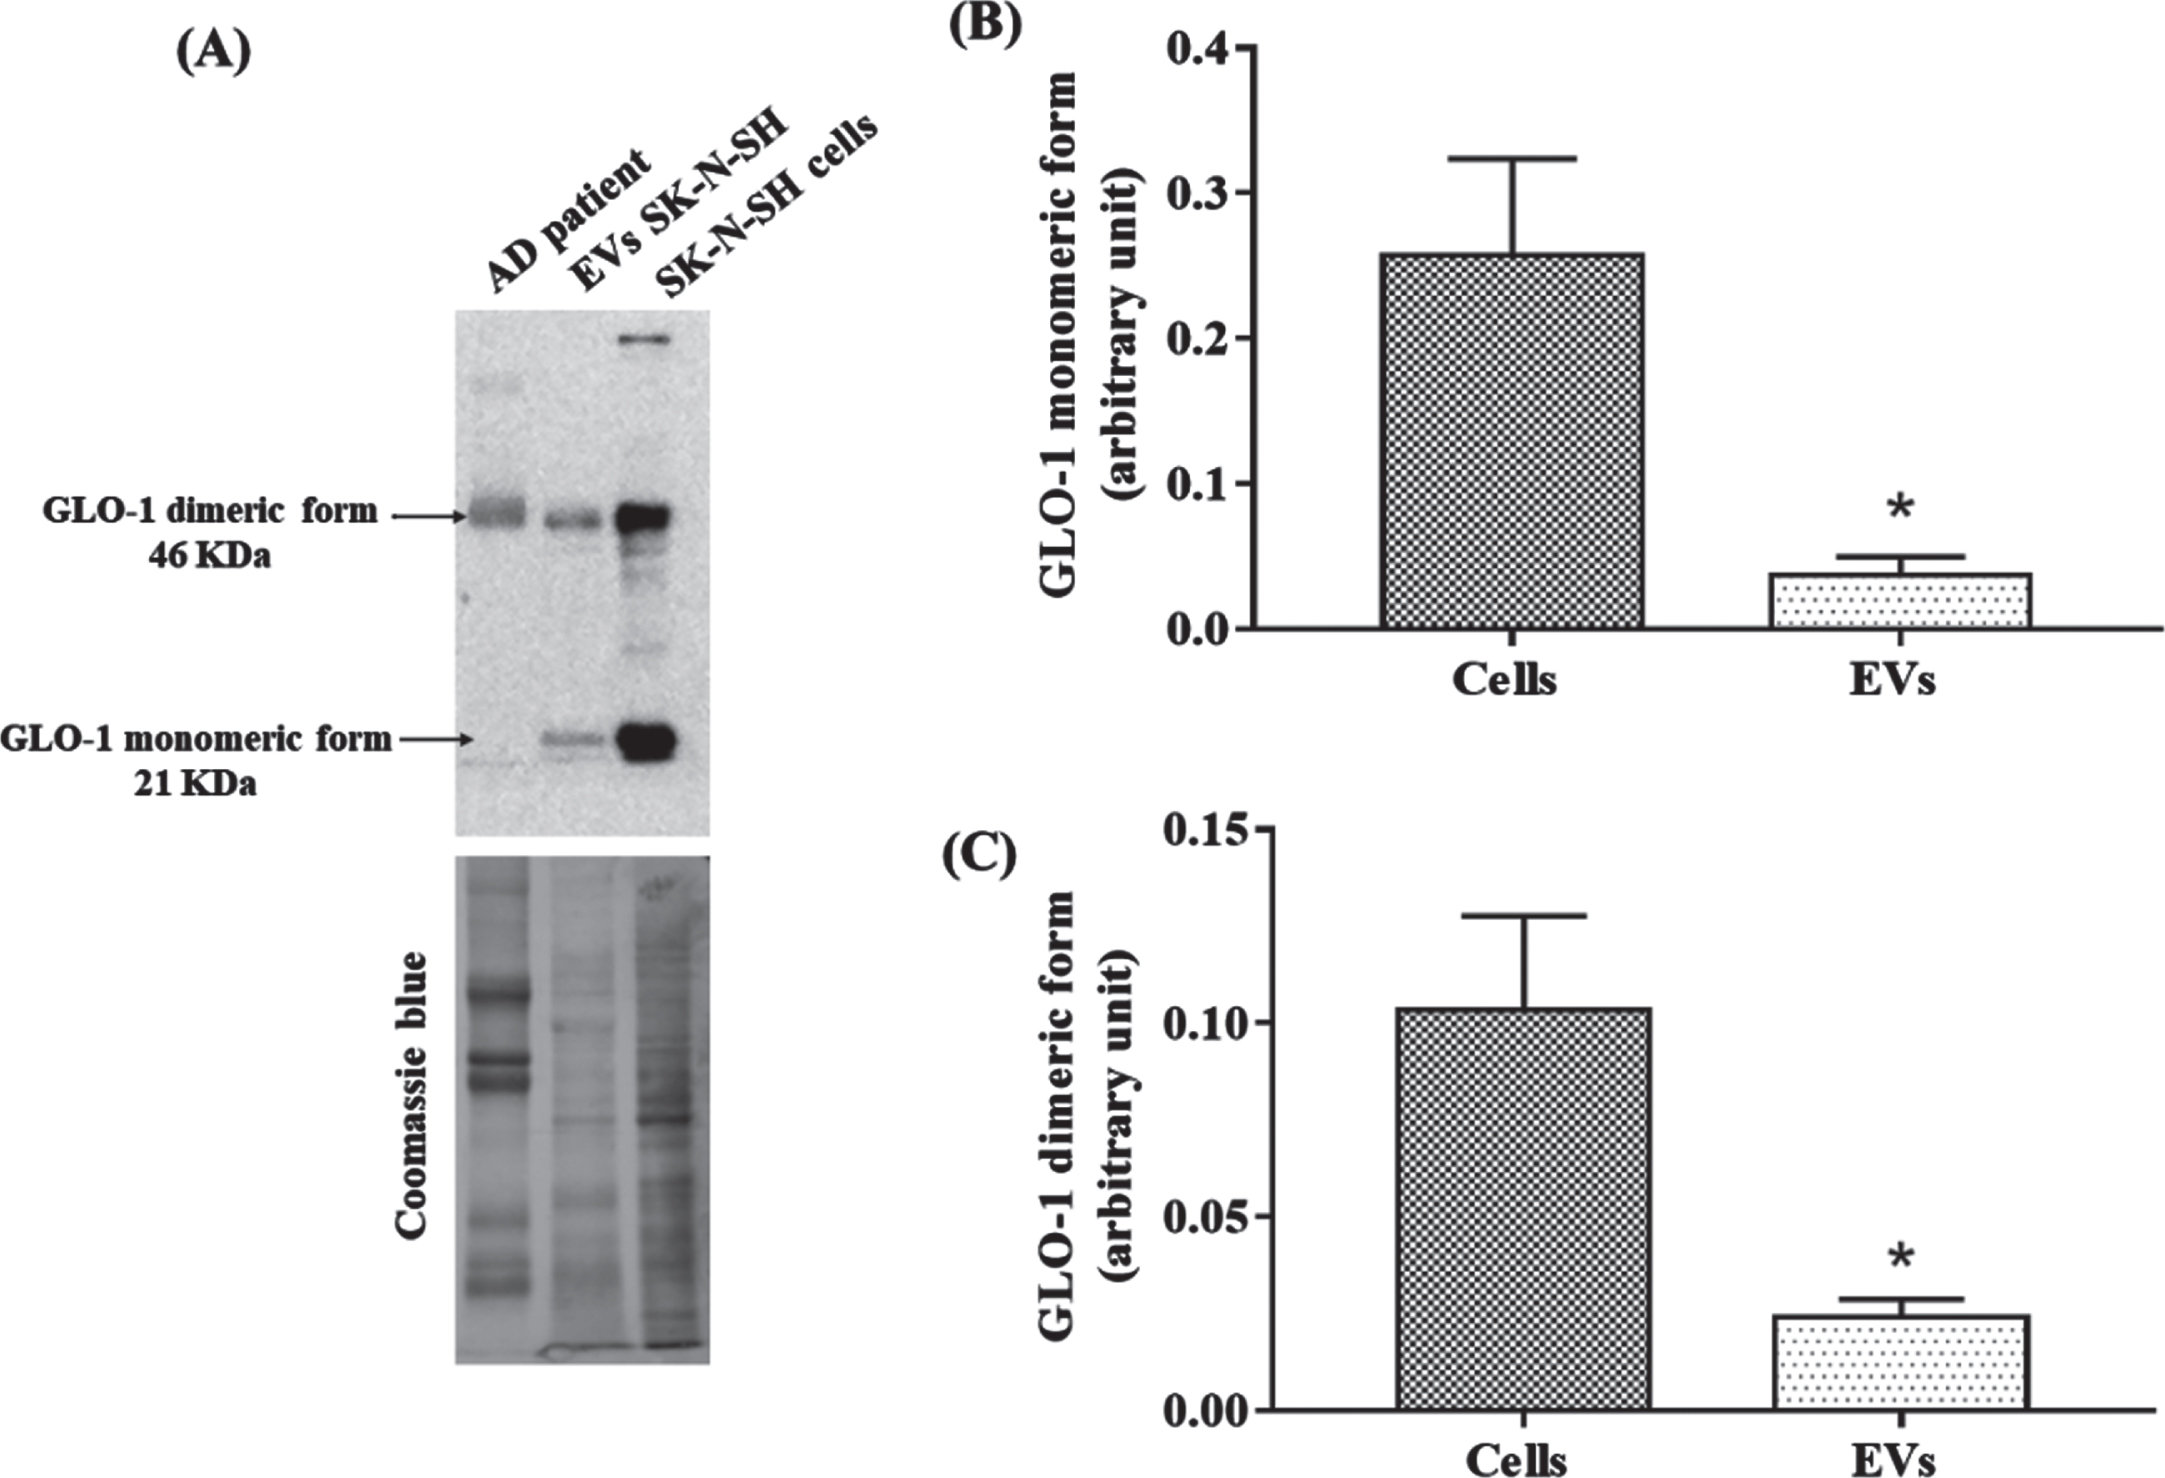
Identification of the presence of GLO-1 in neuronal EVs. A) Representative western blot of GLO-1 in EVs from AD patients, in neuronal EVs and in SK-N-SH cells. Coomassie blue stained total proteins was used as the loading control. B, C) Comparison between cells and EVs GLO-1 monomeric (B) and dimeric form (C) levels. The difference in each group was analyzed with the Student’s t-test. Values are mean±SEM with * p < 0.05.
DISCUSSION
AD is a systemic disorder with active crosstalk between the brain and the periphery where multiple pathways altered in the brain cells are also affected in peripheral cells and plasma [48]. Besides, some abnormal systemic changes might develop secondary to brain dysfunction and have a crucial role in the development and progression of AD. This study aimed to assess the RAGE and GLO-1 levels in peripheral EVs from MCI and multi-AD stages patients and analyze their association with cognitive performance using the well-established clinical MMSE and MoCA scores.
We demonstrated that the GLO-1 levels in circulating EVs were significantly decreased in AD and particularly in the early stage of the disease compared to control and MCI patients while the levels of RAGE in these EVs increased during the late AD stage. Meanwhile, GLO-1 levels in serum were not different between the study groups (controls, MCI, and AD patients). Interestingly, RAGE and GLO-1 levels in EVs were correlated with the clinical cognitive scores independently of age. Moreover, ROC analysis demonstrated that GLO-1 levels in EVs could differentiate ES AD patients from MCI patients and control subjects, while RAGE levels in EVs have a higher probability to differentiate LS AD patients from other AD groups. For the first time, we identified that GLO-1 was released from neuronal cells derived-EVs.
There is abundant literature suggesting that RAGE plays a pivotal role in the development of AD [49]. In the brain, RAGE contributes to the pathological features of AD by stimulating Aβ production [50], activates intracellular signaling pathways associated with oxidative stress and releases of inflammatory factors involved in the progression of AD [49]. In the circulation, RAGE regulates the influx of circulating Aβ across the BBB [12]. The scrambled form of RAGE, sRAGE, interacts and promotes Aβ elimination in the liver and other organs or blocks the influx of Aβ into the brain [51]. Some studies described decreased of the sRAGE in plasma/serum from MCI and AD patients [15–17] and were associated with cognitive function and impairment [52]. To date, the presence and implication of RAGE in circulating EVs was poorly investigated. Only one study had detected the presence of RAGE on neuronal derived-exosomes in the circulation [53]. They had estimated that the levels of RAGE in plasma exosomes might represent approximately 13%of that found in the plasma fraction [53]. RAGE is a cell-surface receptor expressed in different peripheral cell types [54], and it is regulated in response to metabolic changes for instance, during aging, diabetes and hyperlipidemia [55]. As circulating EVs represent a mixture of vesicles released from different cell-type in the periphery [56]. Thus, RAGE in circulating EVs represents an indicator of systemic metabolism. As EVs were suggested to be able to cross the BBB in both directions, RAGE in circulating EVs could be an essential player in the propagation of peripheral Aβ and inflammatory molecules to the brain through the BBB because RAGE also can bind many pro-inflammatory ligands. On the other hand, the presence of GFAP and neuronal markers [42] indicated that a fraction of the circulating EVs origins from the brain. Thus, RAGE in circulating EVs could also be a detoxifying mechanism to eliminate AGEs and other ligands from the brain during AD progression. Further studies are required to understand better the biological significance of the expression of RAGE on EVs as a detoxifying mechanism or the propagation of pathological ligands. Meanwhile, our findings showed that RAGE levels in circulating EVs should be further explored as potential markers of the AD progression.
Many evidence suggested that impaired GLO-1 activity is implicated in the pathogenesis of neurodegenerative disorders like AD [20]. For instance, in the overexpressing human tau P301L mice, which display hyperphosphorylation of tau protein and memory deficits, GLO-1 is strongly expressed in many brain areas, including the cortex, hippocampus, and amygdala, and GLO-1 is the unique upregulated gene in the whole brain [57]. These results suggest that GLO-1 is upregulated in response to tau aggregation. Also, the restoration of GLO-1 activity restored cognitive capacity in a mouse model of AD [58]. In the AD brain, the decrease of GLO-1 levels correlates with the increase of the AGEs deposition and disease progression [23, 59]. As GLO-1 represents the limiting enzyme in the detoxification of MG and GO, the decrease of GLO-1 activity contributes to their accumulation, cellular oxidative stress raising and AGEs formation. In the AD brain, GLO-1 is upregulated in the early stage but is downregulated in the other stages of the disease [23]. In the peripheral, the plasma level of GLO-II was found to be increased in MCI and AD patients [60], but the levels of GLO-I remained to be determined. Our results revealed that the GLO-I levels in serum were not different in MCI and AD. Interestingly, we have evidenced the presence of GLO-1 in peripheral EVs which decreased in the early stage of AD and correlated with the MoCA scores. The peripheral EVs contain only the dimeric form, while the human neuronal cell-line SK-N-SH derived-EVs contain both the dimeric and monomeric forms of GLO-1. These data are in line with our previous study demonstrating that human neuronal derived-EVs contain DJ-1 which is considered a human homolog of a novel type of glyoxalase that converts MG to lactic acid in the absence of GSH [22]. In the bloodstream, we found an increase in CML, MG and GO levels among MCI and AD groups. Considering the critical role of GLO-1 in the detoxification of these molecules, it is suggested that the variation of GLO-1 levels in EVs could be explained by an imbalance of the redox system homeostasis (antioxidants/oxidants) in the periphery. This mechanism appears to be an early event in the disease progression [22, 61]. Finally, considering the role of GLO-1 in the glycemic control, in vascular function, in obesity, in cardiometabolic diseases, or insulin resistance [62–64], our results strengthen the notion of the loss of systemic homeostasis in the early stage of AD which is a particularly aggressive form with rates of progression typically exceeding those in late AD [65].
The MoCA test was developed to enable earlier detection of MCI relative to others tests like the MMSE. Although it offers many of the same advantages as the MMSE, the MoCA test was developed as a more challenging test that includes complex visuospatial processing, higher-level language, and executive function to enable detection of mild impairment with less ceiling effect [66]. These facts could explain the correlation observed in our study between GLO-1 levels in EVs from MCI and ES-AD groups and the MoCA rather than the MMSE scores. Besides, the relationship between RAGE levels and the MMSE scores is not fully clear, and future studies are needed to establish the possible causal link between them.
Overall, our findings support the notion that the total circulating EVs could be considered as emerging tools to complement the clinical scores in AD. Identifying the cargo signature with a defined cargo-molecular fingerprint for each stage of the disease will improve the predictive diagnostic power of circulating EVs. In this context, the development of early, validated and easily accessible patterns of blood-based biomarkers would benefit people at risk to develop AD by providing better targeted therapeutic intervention. The development of specific EVs molecular profiles will also open promising perspectives in cure improvement. The current study has two principal limitations. The first relates to the small number of participants who were enrolled in the study. The sample size was adequate for statistical analysis, but data should be validated in larger groups. Also, the modifications of these proteins in EVs and plasma should be compared to patients with other neurodegenerative disorders. Finally, the findings herein reported might also be influenced by the over-representation of the female gender.
CONCLUSIONS
In conclusion, our study showed that levels of RAGE and GLO-1 in EVs from serum were different in MCI and AD patients and were associated with cognitive scores. These data support the use of peripheral EVs cargo as new tools for discovering peripheral AD biomarkers. Further studies are still needed to validate our observations in larger groups and to explain the mechanistic implication of peripheral EVs RAGE and GLO-1 in AD pathophysiology.
