
Abstract
Background:
Alzheimer’s disease (AD) is one of the most challenging diseases causing an increasing burden worldwide. Although the neuropathologic diagnosis of AD has been established for many years, the metabolic changes in neuropathologic diagnosed AD samples have not been fully investigated.
Objective:
To elucidate the potential metabolism dysregulation in the postmortem human brain samples assessed by AD related pathological examination.
Methods:
We performed untargeted and targeted metabolomics in 44 postmortem human brain tissues. The metabolic differences in the hippocampus between AD group and control (NC) group were compared.
Results:
The results show that a pervasive metabolic dysregulation including phenylalanine metabolism, valine, leucine, and isoleucine biosynthesis, biotin metabolism, and purine metabolism are associated with AD pathology. Targeted metabolomics reveal that phenylalanine, phenylpyruvic acid, and N-acetyl-L-phenylalanine are upregulated in AD samples. In addition, the enzyme IL-4I1 catalyzing transformation from phenylalanine to phenylpyruvic acid is also upregulated in AD samples.
Conclusion:
There is a pervasive metabolic dysregulation in hippocampus with AD-related pathological changes. Our study suggests that the dysregulation of phenylalanine metabolism in hippocampus may be an important pathogenesis for AD pathology formation.
INTRODUCTION
Alzheimer’s disease (AD) is the most common dementia that influences over 35 million people worldwide and a great deal of fortune will be spent to deal with this neurodegenerative disease [1, 2]. The most common pathological characters of AD are amyloid-β (Aβ) plaques and neurofibrillary tangles (NFTs) which are considered to be the culprits causing AD symptoms [3–6]. Extracellular aggregation of Aβ peptides is responsible for senile plaques formation. Various metabolic dysfunction of Aβ precursor or Aβ could contribute to Aβ misfolding and aggregation [7–10]. NFTs are aggregated from hyperphosphorylated tau [11] which inhibits formation of microtubules [12] and exerts neurotoxicity to brain [13]. The occurrence of Aβ and NFTs in different brain regions have their own spatio-temporal order [14, 15], and the pathological changes can reveal the severity level of AD [16].
Generally, the diagnosis of AD is dependent on clinical criteria or neuropathologic changes. The National Institute on Aging-Alzheimer’s Association recommends the ABC score to assess the AD neuropathology [17]. The experiments of Aβ plaque score (A score) [14], Braak NFT stage [18] or phospho-tau immunohistochemistry [15] (B score), and The Consortium to Establish a Registry for Alzheimer’s Disease (CERAD) neuritic plaque score (C score) [19] need to be performed independently and these data can be summarized to assess the severity level of AD. The advantage of ABC score is that it summarizes more comprehensive pathological information than other pathological diagnosis methods which just based on single pathological features of AD. The recommended brain regions for ABC score experiments were collected from the right brain in our brain bank to assess the neuropathology of brains.
The brain is one of the most energy-consuming organs in human body; the complex brain metabolism networks maintain supply of energy to neurons and astrocytes. However, the metabolism balance is disrupted in AD patients, and potential therapeutic targets may be found through analyzing these dysregulated metabolites [20]. A series of dysregulated metabolites or metabolic pathways were found correlated with AD pathology in postmortem brains [21, 22]. Except for the direct differential metabolites identified in AD brains, the gut microbial metabolites of dietary were also found correlated with AD [23, 24]. Though correlation between metabolism dysregulation and AD has aroused attention, more exploration of AD metabolism still needs to be performed. Untargeted metabolomics in our study discovered several dysregulated metabolites and metabolic pathways in AD group and may provide alternative biomarkers or drug targets for AD.
Phenylalanine is a precursor for catecholamines (dopamine, norepinephrine, epinephrine) and indispensable for biosynthesis of these neurotransmitters [25]. Phenylpyruvic acid and N-acetyl-L-phenylalanine are byproducts of phenylalanine metabolism. Abnormal accumulation of phenylalanine, phenylpyruvic acid, and N-acetyl-L-phenylalanine can be seen in urine and plasma of phenylketonuria patients [26–28], phenylketonuric brain damage can be seen in partial phenylketonuria patients [29]. High level of phenylalanine is considered to be associated with AD [30, 31]. In the present study, we found elevated levels of phenylalanine, phenylpyruvic acid, and N-acetyl-L-phenylalanine in AD samples. L-amino-acid oxidase (IL-4I1) controlling the catalytic step from phenylalanine to phenylpyruvic acid is also upregulated. These results indicate that dysregulated phenylalanine metabolism may be an important pathogenesis for AD pathology formation.
MATERIALS AND METHODS
Tissue samples
A total of 44 postmortem human hippocampus were obtained from the National Human Brain Bank for Development and Function, Chinese Academy of Medical Sciences. The protocols were approved by the Institutional Review Board of the Institute of Basic Medical Sciences of the Chinese Academy of Medical Sciences, Peking Union Medical College, Beijing, China [Approval Number: 009-2014;031-2017]. All antemortem written informed consent forms were received from both the potential donor and his/her next-of-kin to guarantee that the donation was completely voluntary and ethically-approved use of the brain tissues in future scientific research was permitted. Brains were collected and processed according to the standardized operational protocol of human brain banking in China [32]. Briefly, within 24 h of postmortem delay, the left half brain were collected freshly (some functional brain regions including hippocampus were dissected) and stored in –80°C freezer. The right half were fixed in 10%formalin, then brain regions needed for neuropathologic examination were dissected and paraffin-embedded. ABC score assessment divided the samples into “Not”, “Low”, “Intermediate”, and “High” levels. Samples with “Intermediate” or “High” AD neuropathologic changes were attributed to AD group, samples with “Not” or “Low” AD neuropathologic changes were attributed to control group. No intracranial metastasis of tumor was observed in the samples used for metabolomics. The basic demographic and pathologic characteristics of samples are shown in Table 1. The age, postmortem delay (PMD), and storage time characteristics of AD group versus NC group are shown in Table 2.
Sample demographic and pathological characteristics
N, none; L, low; I, intermediate; H, high; m, month.
Comparison of age, PMD, storage time and gender between NC group and AD group
F, female; M, male.
ABC score assessment
We performed immunohistochemistry for Aβ plaques detection using antibody 6F/3D (Novocastra, United Kingdom). For “A” score assessment, midbrain including substantia nigra, cerebellar cortex and dentate, basal ganglia at level of anterior commissure with basal nucleus of Meynert, hippocampus and entorhinal cortex, middle frontal gyrus, superior and middle temporal gyri, and inferior parietal lobule were used for immunohistochemistry to detect whether Aβ plaques exist. Every brain region chosen to assess “A” score should be judged Aβ plaques positive or Aβ plaques negative. A0, A1, A2, and A3 were evaluated according to which brain regions exhibiting Aβ deposits [14]. “B” score assessment was performed by immunohistochemistry of NFTs using phospho-tau antibody (Abcam, United Kingdom). For “B” score assessment, brain regions including basal ganglia at level of anterior commissure with basal nucleus of Meynert, hippocampus and entorhinal cortex, middle frontal gyrus, superior and middle temporal gyri, inferior parietal lobule, and occipital cortex were detected for NFTs. Four levels including B0, B1, B2, and B3 were evaluated according to Braak NFT stage criterion [15]. Detection of senile plaques (“C” score) was performed by modified Bielschowsky stain. “C” score assessment criteria is based on CERAD protocol. The brain regions taken to perform modified Bielschowsky stain for senile plaques were hippocampus and entorhinal cortex, middle frontal gyrus, superior and middle temporal gyri, inferior parietal lobule, and occipital cortex. The density of neurotic plaques are used to assess the level of “C” score [19]. The ABC score summarized pathologic conditions of detected brain regions and divided samples into “Not”, “Low”, “Intermediate”, and “High” levels. More details of ABC score assessment can be found in a practical protocol recommended by National Institute on Aging-Alzheimer’s Association [17].
Chemicals and reagents
Reagents used for experiments are all LC-MS grade. Water and methanol were purchased from Sigma-Aldrich. Acetonitrile, ammonium acetate and ammonium hydroxide were obtained from Merck Chemicals. The external standard reagent for phenylalanine and phenylpyruvic acid quantification were purchased from Sigma-Aldrich. N-acetyl-L-phenylalanine was purchased from JSENB.
Metabolites extraction
The frozen hippocampus tissues were weighed and 25 mg per piece was added to EP tube. Then 500μL extract solution (acetonitrile: methanol: water = 2: 2: 1, with isotopically-labelled internal standard mixture) was added and vortexed. The samples were then homogenized and sonicated for 3 times on ice. After the upper step, the samples were incubated for 1 h at –40°C fridge and centrifuged at 12000 rpm for 15 min at 4°C. The supernatant was transferred into new vial and ready for later analysis. A quality control (QC) pool was constructed by mixing an equal aliquot of the supernatants from all of the samples.
LC-MS/MS analysis
LC-MS/MS analyses were performed using an UHPLC system (Vanquish, Thermo Fisher Scientific) with a UPLC BEH Amide column (2.1 mm×100 mm, 1.7μm) coupled to Q Exactive HFX mass spectrometer (Orbitrap MS, Thermo) in both electrospray ionization positive (ESI+) and electrospray ionization negative (ESI-) mode. The solvent A consisted of 25 mmol/L ammonium acetate and 25 mmol/L ammonia hydroxide in water (pH = 9.75), acetonitrile acted as solvent B. The elution gradient used for the analysis was as follows: 0∼0.5 min, 95%B; 0.5∼7.0 min, 95%∼65%B; 7.0∼8.0 min, 65%∼40%B; 8.0∼9.0 min, 40%B; 9.0∼9.1 min, 40%∼95%B; 9.1∼12.0 min, 95%B. The column temperature was 30°C. The auto-sampler temperature was 4°C, and the injection volume was 2μL. The MS/MS spectra was obtained from the QE HFX mass spectrometer on information-dependent acquisition mode under the control of the acquisition software (Xcalibur, Thermo). In the DIA mode, the acquisition software can evaluate the full scan MS spectrum continuously. Detailed parameters set in our study were as following: sheath gas flow rate was 50 Arb, Aux gas flow rate was 10 Arb, capillary temperature 320°C, full MS resolution was 60000, MS/MS resolution was 7500, collision energy was 10/30/60 in NCE mode, spray Voltage was 3.5 kV (positive) or –3.2 kV (negative), respectively.
Data preprocessing and annotation
We use ProteoWizard software to convert raw data into the mzXML format. For peak detection, extraction, alignment and integration, data were processed with an in-house program, which was developed using R and based on XCMS. Then metabolite annotation was applied in an in-house MS2 database (BiotreeDB). The cutoff for annotation was set at 0.3. The MS2 data detected in ESI+ and ESI- mode were summarized together by eliminating the same metabolites with lower MS2 score.
Multivariate statistical analysis
SIMCAP software (V16.0.2, Sartorius Stedim Data Analytics AB, Umea, Sweden) was used for multivariate data analyses and establishment of models [33]. Models of principal component analysis (PCA) and partial least-square discriminant analysis (OPLS-DA) were built. The descriptive performance of the models was determined by R2X (cum) and R2Y (cum) values, while the prediction performance was indicated by Q2 (cum) value. The value of R2X (cum) in PCA model for “Total with QC” is 0.517 and for “AD versus NC” is 0.523. In the OPLS-DA model for “AD versus NC”, R2X (cum) is 0.217, R2Y (cum) is 0.774, Q2(cum) is 0.397. OPLS-DA is important for determination of discriminating metabolites using the variable importance on projection (VIP). In general, the VIP value lager than 1 is considered as significant. The permutation test (n = 200) of OPLS-DA model for “AD versus NC” group was performed to determine whether there is over fitting. Discriminating metabolites were identified by VIP>1 and p < 0.05. These discriminating metabolites were used for later hierarchical clustering analysis and pathway analysis.
Standard preparation and assay
The standard reagents were diluted in glass vials and prepared in a series of concentrations. Linear range and sensitivity were assessed by detecting a series of standard concentrations. The peak area ratios were determined and plotted against the concentrations of standard dilutions.
Western blot
Human brain tissues were homogenized by ultrasonic cell disruptor in protein lysis buffer (Beyotime, China). The protein concentration was determined by BCA protein assay kit (Beyotime, China). The primary antibodies were incubated overnight at 4°C. The dilution ratio for anti-IL-4I1/LAO antibody (Abcam, United Kingdom), anti-Aspartate Aminotransferase (GOT1) antibody (Abcam, United Kingdom) and anti-GAPDH (Abcam, United Kingdom) were all 1:1000. The secondary antibody was HRP-conjugated anti-rabbit (ABclonal, China). Image acquisition was performed using a chemiluminescence imaging system (Tanon, China).
Statistical analysis
All the original data of every sample were presented in Table 1. The age, PMD, and storage time were expressed as mean±the standard deviation (SD) in Table 2, the statistical differences of age, PMD, and storage time between AD group and NC group were tested by unpaired student’s t-test. The gender difference between NC and AD group was compared by chi-square test. The statistical differences of metabolites were compared by student’s t-test and adjusted by multiple testing. The false discovery rate was performed by the Benjamini and Hochberg method and q value in Table 3 as well as Table 4 represents the adjusted p value.
Statistical analysis of decreased metabolites in AD group. Fold changes (AD/NC) lower than 0.83 are listed
Statistical analysis of increased metabolites in AD group. Fold changes (AD/NC) larger than 1.2 are listed
RESULTS
ABC score assessment in postmortem human brain tissues
Our study compared the metabolic changes in hippocampus between AD group and NC group. The pathologic level assessment of every sample is shown in Table 1. Four stages of “A” score are A0, A1, A2, and A3, and these assessments will provide important references for AD neuropathologic changes judgement. No Aβ plaques can be found in brain in A0 stage. Figure 1A shows an example of A0 in inferior parietal lobule. The A1 stage is corresponding to Thal Phase for Aβ plaques 1 or 2. Figure 1B shows an example of A1 in middle frontal gyrus. The A2 stage is corresponding to Thal Phase for Aβ plaques 3. Figure 1C shows an example of A2 in basal ganglia. The A3 stage is corresponding to Thal Phase for Aβ plaques 4 or 5. Figure 1D shows an example of A3 in cerebellum. No NFTs occur in the B0 stage. Figure 1E shows an example of B0 in hippocampus. The B1 stage is corresponding to Braak and Braak NFT Stage I or II. Figure 1F shows an example of B1 in hippocampus. The B2 stage is corresponding to Braak and Braak NFT Stage III or IV. Figure 1G shows an example of B2 in middle temporal gyrus. The B3 stage is corresponding to Braak and Braak NFT Stage V or VI. Figure 1H shows an example of B3 in striate cortex. The C0 stage is corresponding to CERAD neuritic plaque score “none” and no neuritic plaque can be found. Figure 1I shows an example of C0 in inferior parietal lobule. The C1 stage is corresponding to CERAD neuritic plaque score “sparse” and the density is 1 to 5 neuritic plaques per 1 mm2. Figure 1J shows an example of C1 in inferior parietal lobule. The C2 stage is corresponding to CERAD neuritic plaque score “moderate” and the density is 6 to 20 neuritic plaques per 1 mm2. Figure 1K shows an example of C2 in inferior parietal lobule. The C3 stage is corresponding to CERAD neuritic plaque score “frequent” and the density is more than 20 neuritic plaques per 1 mm2. Figure 1L shows an example of C3 in inferior parietal lobule. The ABC score summarized the pathologic information of many brain regions. In the present study, we focused on hippocampus which is considered a key brain region suffering neuropathologic changes in AD. All the subjects with “Intermediate” or “High” score are considered as AD samples, others are classified as NC samples. The frozen hippocampus tissues dissected from left brain were used for untargeted and targeted metabolomics. Numerous brain regions from the right half brain were used to detect pathological changes and assess ABC score; detailed ABC score information is listed in Table 1.
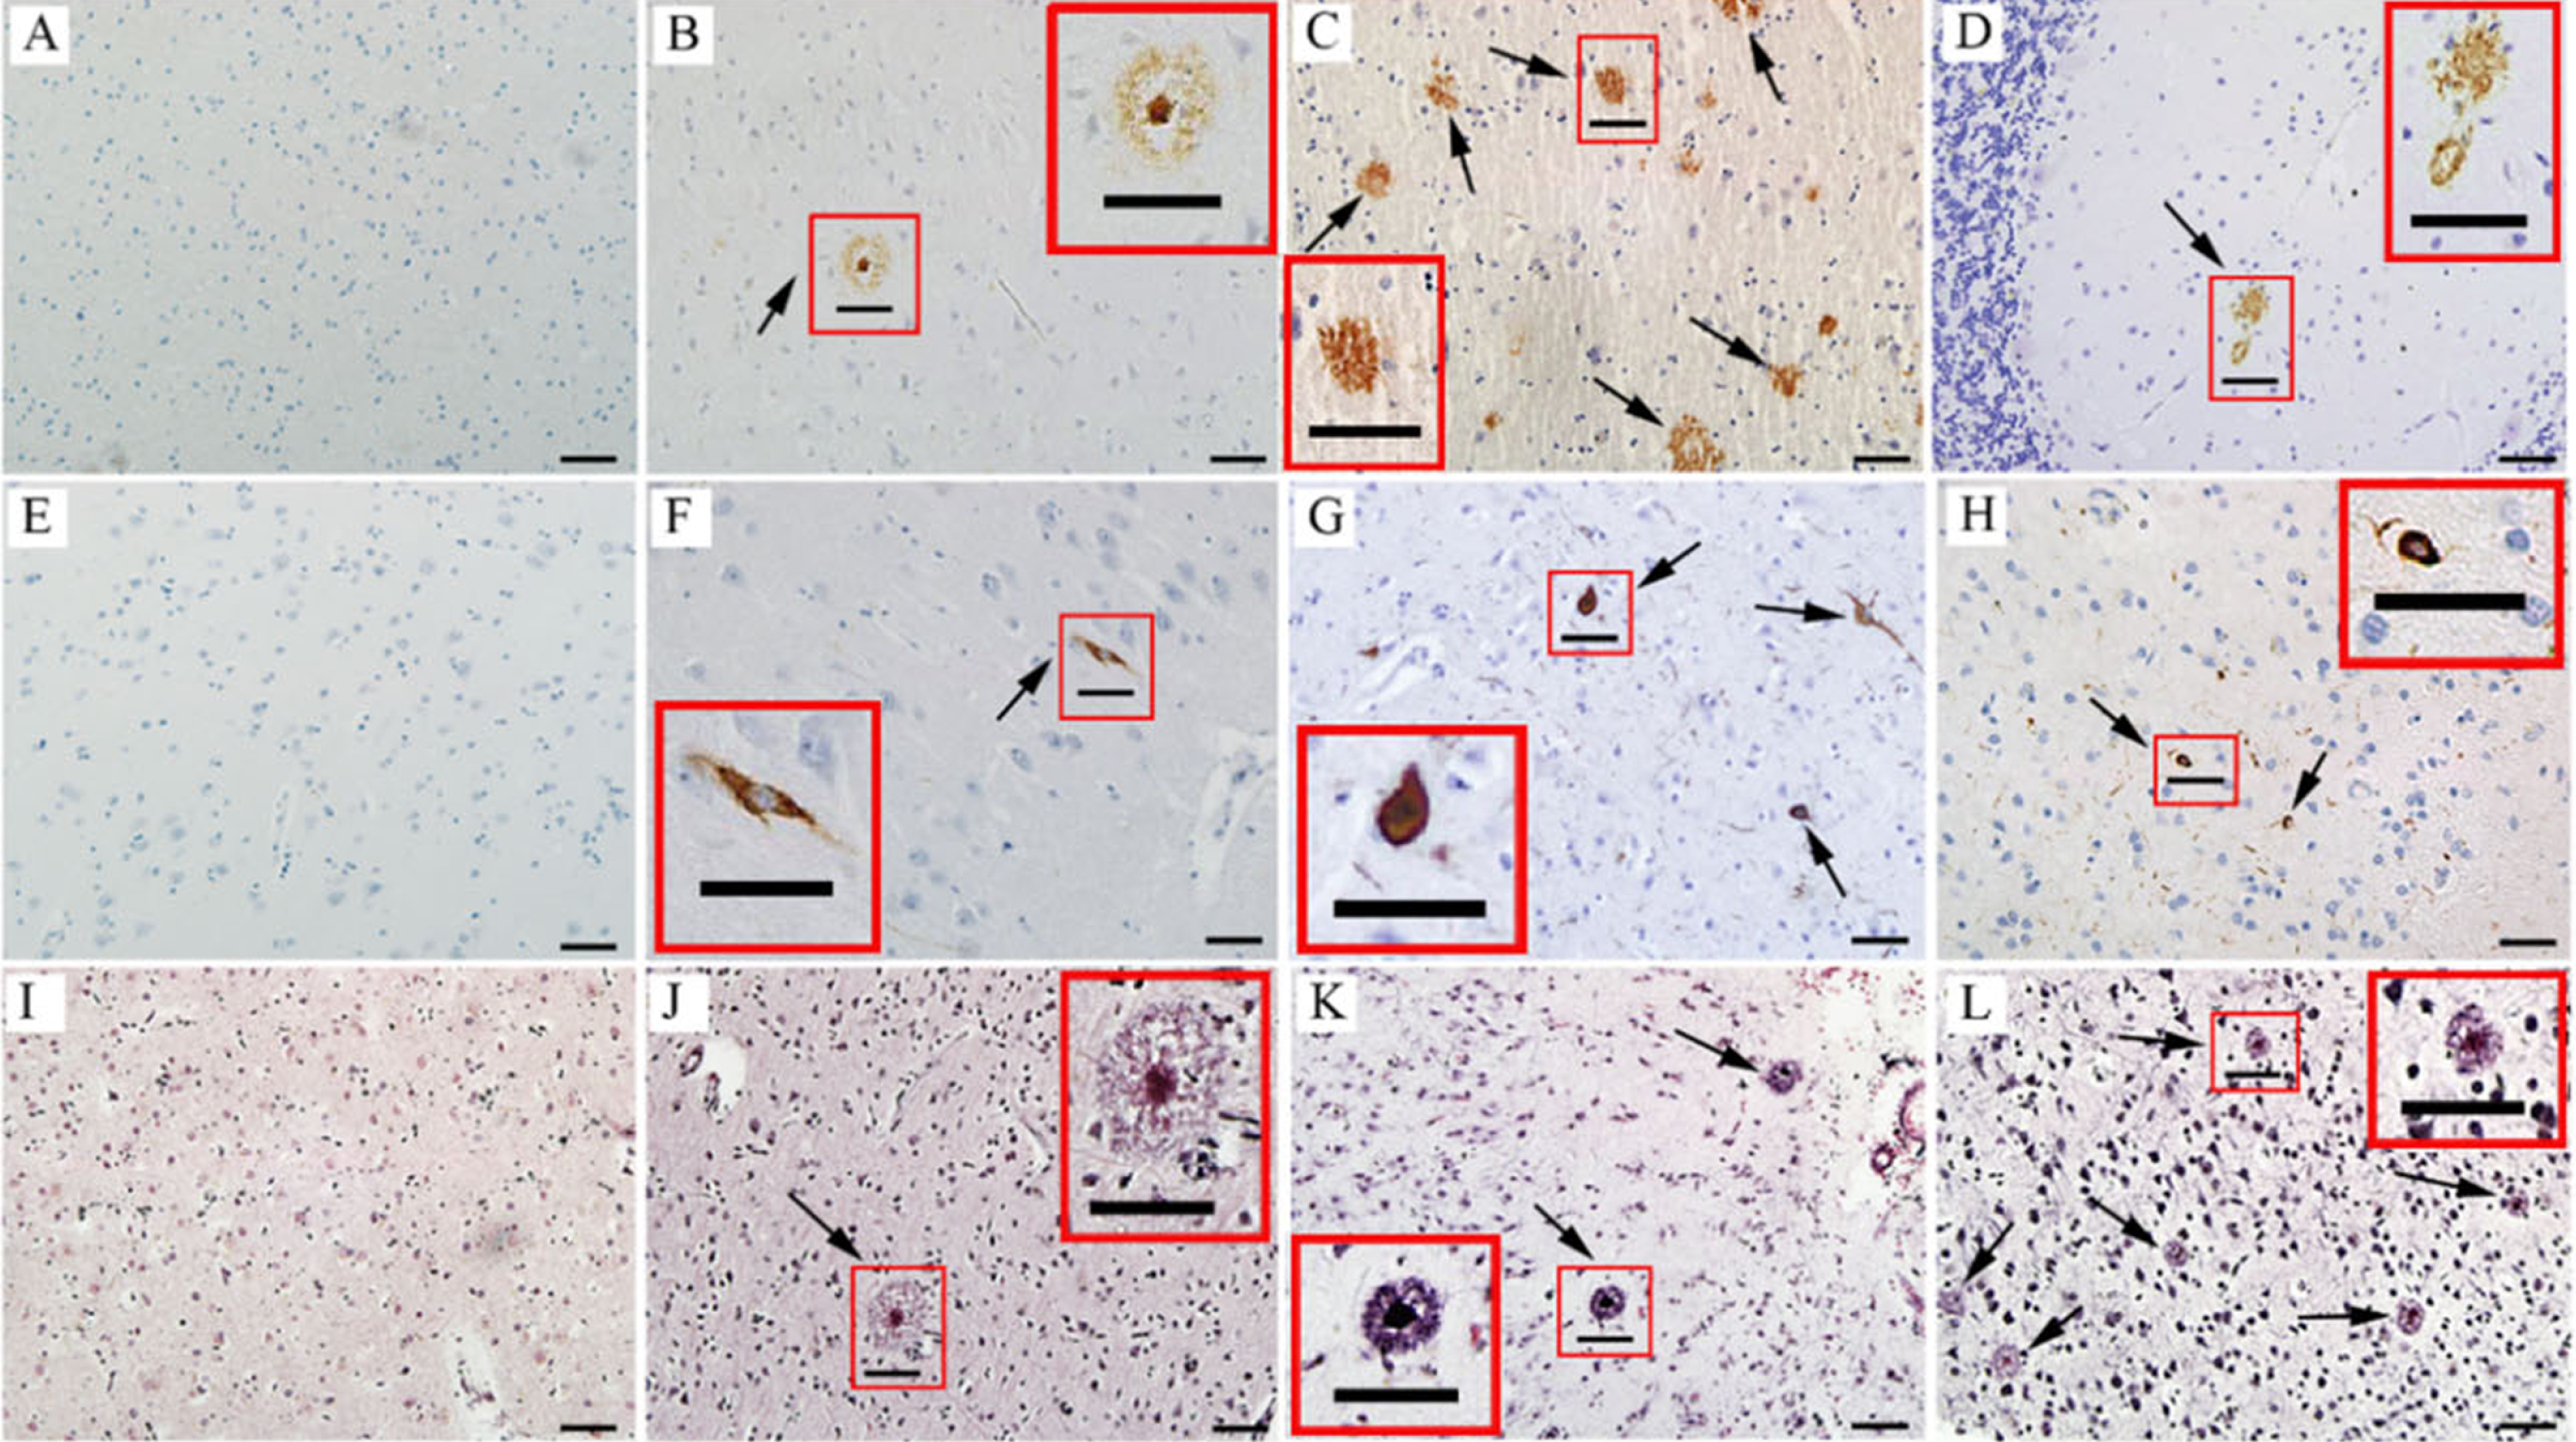
Neuropathologic assessment of ABC score for AD. A-D) Immunohistochemical detection of Aβ plaques, the arrows in B-D indicate Aβ plaques. A) An example of A0 in inferior parietal lobule; B) An example of A1 in middle frontal gyrus. C) An example of A2 in basal ganglia; D) An example of A3 in cerebellum. E-H) Immunohistochemical detection of neurofibrillary degeneration, the arrows in F-H indicate NFTs. E) An example of B0 in hippocampus; F) An example of B1 in hippocampus; G) An example of B2 in middle temporal gyrus; H) An example of B3 in striate cortex. I-L) Detection of neurotic plaques using modified Bielschowsky stain, the arrows in J-L indicate neurotic plaques. I) An example of C0 in inferior parietal lobule; J) An example of C1 (1 to 5 neuritic plaques per 1 mm2) in inferior parietal lobule; K) An example of C2 (> 6 but <20 neuritic plaques per 1 mm2) in inferior parietal lobule; L) An example of C3 (> 20 neuritic plaques per 1 mm2) in inferior parietal lobule. Scale bars are 50μm. Insets in the panels are enlarged views of boxed areas in the images.
Untargeted metabolic features of postmortem hippocampus
We identified 227 metabolite features in ESI- mode and 365 metabolite features in ESI+mode. Partial metabolites occurred in both ESI+and ESI- mode, the repeated metabolites with higher MS2 score were retained while the repeated metabolites with lower score were eliminated. A total of 550 metabolite features were selected for subsequent analyses. The PCA mode in Fig. 2A shows the characteristics of every sample. The QC samples (shown as purple dots) were center clustered in the PCA mode indicating a good instrumental reproducibility and stability of this metabolic study. The PCA model for “AD versus NC” is shown in Fig. 2B, the NC group are relatively clustered. OPLS-DA model for “AD versus NC” is shown in Fig. 2C, AD samples and NC samples are obviously separated. Permutation test of OPLS-DA model for group AD versus NC is shown in Fig. 2D. The value of R2Y(cum) (shown as green dots) in original model is relatively close to 1, indicating the model matches the real situation of samples. The Q2(cum) value (shown as blue dots) of the permutation test is less than the Q2(cum) value of the original model, the intercept of the regression line of Q2(cum) with the vertical axis is less than zero, in addition, the Q2(cum) value increases gradually with the correlation coefficient increasing, indicating that the original model has a good robustness and no over fitting of the OPLS-DA mode.
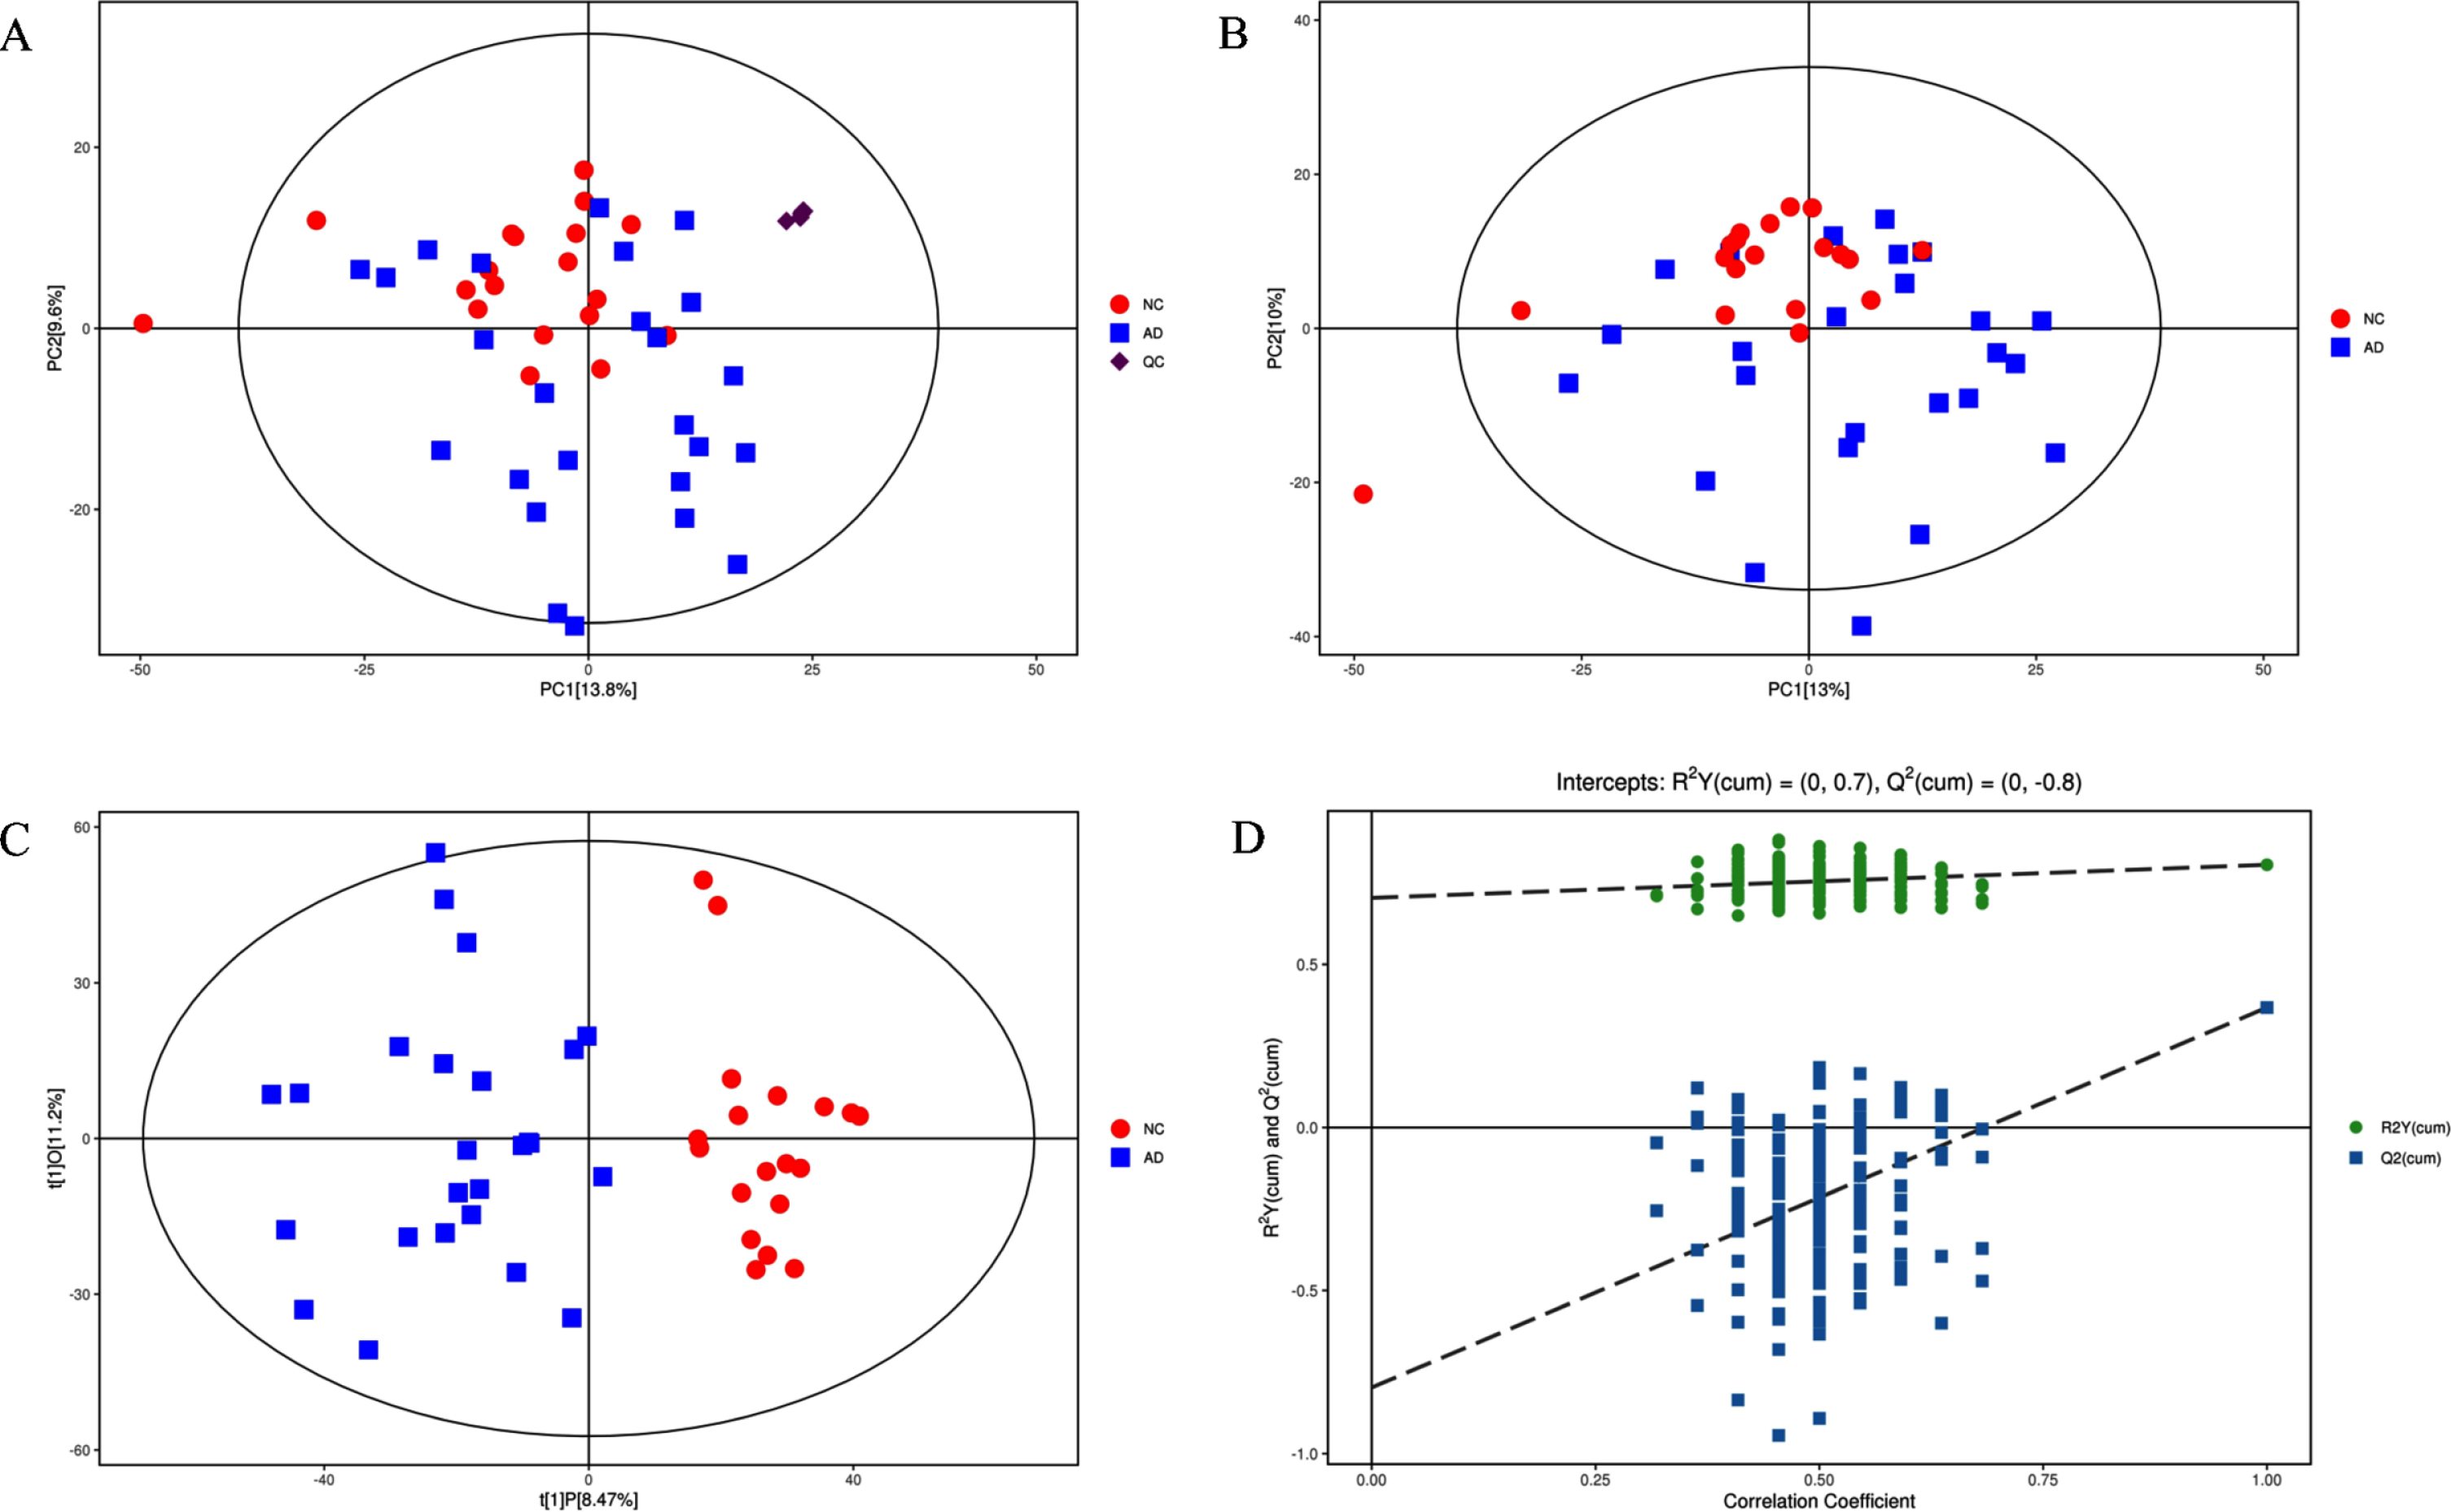
A) Score scatter plot of PCA model for “Total with QC”. B) Score scatter plot of PCA model for “AD versus NC”. C) Score scatter plot of OPLS-DA model for “AD versus NC”. D) Permutation test of OPLS-DA model for group “AD versus NC”.
Characteristics of differential metabolites and dysregulated metabolic pathways in AD group
Our results found a total of 78 differential metabolite features with VIP > 1 and p < 0.05. The heatmap of hierarchical clustering analysis in Fig. 3A shows the specific expression characteristics of these metabolites in every sample. Chrod plot analysis (shown as Fig. 3B) was performed to illustrate the super classes of differential metabolites and the lines between metabolites represent the correlation coefficient of corresponding metabolites, the size of the dot represents the value of log (fold change), different color represent different super chasses [34]. From the chord plot analysis, the significantly altered metabolites are mainly classified as nucleosides, nucleotides, and analogues, organic acids and derivatives, lipids and lipid-like molecules as well as organoheterocyclic compounds. The metabolic pathways cloud plot in Fig. 3C shows several metabolic pathways dysregulated in AD group. Color gradient represent different p values and the deeper color represents lower p value. The larger circle represents higher impact score. Four metabolic pathways, including valine, leucine and isoleucine biosynthesis, phenylalanine metabolism, purine metabolism and biotin metabolism, are with high impact score and low p value, which may play an important role in AD metabolism. The Kyoto Encyclopedia of Genes and Genomes (KEGG) website provides map of metabolic pathways and corresponding regulatory proteins. Fig. 3D shows an overview of the downregulated (shown as blue dots) and upregulated (shown as red blots) metabolites in the KEGG metabolic pathways. From Fig. 3D, we found the dysregulated metabolites are widely distributed and numerous metabolic pathways are involved, so we considered that a pervasive metabolic disorder occurs in hippocampus with AD pathology changes.

A) Heatmap of hierarchical clustering analysis for group “AD versus NC”. B) Chrod plot analysis for group “AD versus NC”. C) Pathway analysis for group “AD versus NC”. D) KEGG metabolic pathways with red/blue dots representing the differentially expressed compounds.
Multiple dysregulated metabolites are potential AD markers or drug targets
We listed the downregulated metabolites (AD versus NC < 0.83) in Table 3 and upregulated metabolites (AD versus NC > 1.2) in Table 4. Multiple metabolites listed in the two tables have the potential to be AD markers or drug targets. Acetylcholine (ACh), a kind of cholinergic neurotransmitter, is widely considered a culprit resulting in AD symptom with its decreasing and many drugs are designed to upregulate its level [35–38]. ACh was found decreased in our study, as shown in Table 3, 0.49-fold in AD postmortem samples. Our study further verified the loss of ACh is tightly associated with AD pathology. Inosine was found decreased in AD group. Inosine is a metabolite involved in purine metabolism, and there is a study stating that inosine protects against memory impairment of AD [39]. Guanosine is also decreased in AD, and it regulates the glutamatergic system and the cellular redox status, exerting neuroprotective function and improving AD symptoms [40, 41]. Citicoline is a kind of nootropic agent and reported to be effective in ameliorating AD in animal models and humans [42, 43], however, citicoline was found downregulated in the AD group, which means another neuroprotective metabolite was decreased. From the downregulated metabolites listed above, we found the loss of neuroprotective metabolites may be an important cause for AD formation. L-methionine was found increased in the AD group; one study indicates that an L-methionine-enriched diet contributes to high level of phosphorylated tau and Aβ peptides, accompanied with memory impairment [44]. Homocysteine thiolactone shows neurotoxic properties [45, 46] and was found upregulated in our study. The accumulation of metabolites with neurotoxicity may be an important pathogenic factor for AD. The metabolites increased or decreased in AD could be a repository for potential AD markers and drug targets.
Phenylalanine metabolism is dysregulated in AD group
Untargeted metabolomics shows that the phenylalanine metabolism is involved in AD pathology. Targeted metabolomics quantified the content of phenylalanine (Fig. 4A), phenylpyruvic acid (Fig. 4C), and N-acetyl-L-phenylalanine (Fig. 4B) in brain tissues, all of the three metabolites are upregulated in AD group. Figure 4D shows expression of IL-4I1 is upregulated in AD samples, while expression of GOT1 was found no obvious change in AD samples. These two enzymes are involved in catalysis of phenylalanine into phenylpyruvic acid. Fig. 4E is adopted from KEGG and demonstrates the distribution of dysregulated metabolites and enzymes in the phenylalanine metabolism. Abnormal accumulation of phenylalanine, phenylpyruvic acid, and N-acetyl-L-phenylalanine in AD samples and abnormal expression of enzyme regulating phenylalanine metabolism indicating that dysregulated phenylalanine metabolism is associated with AD pathology.
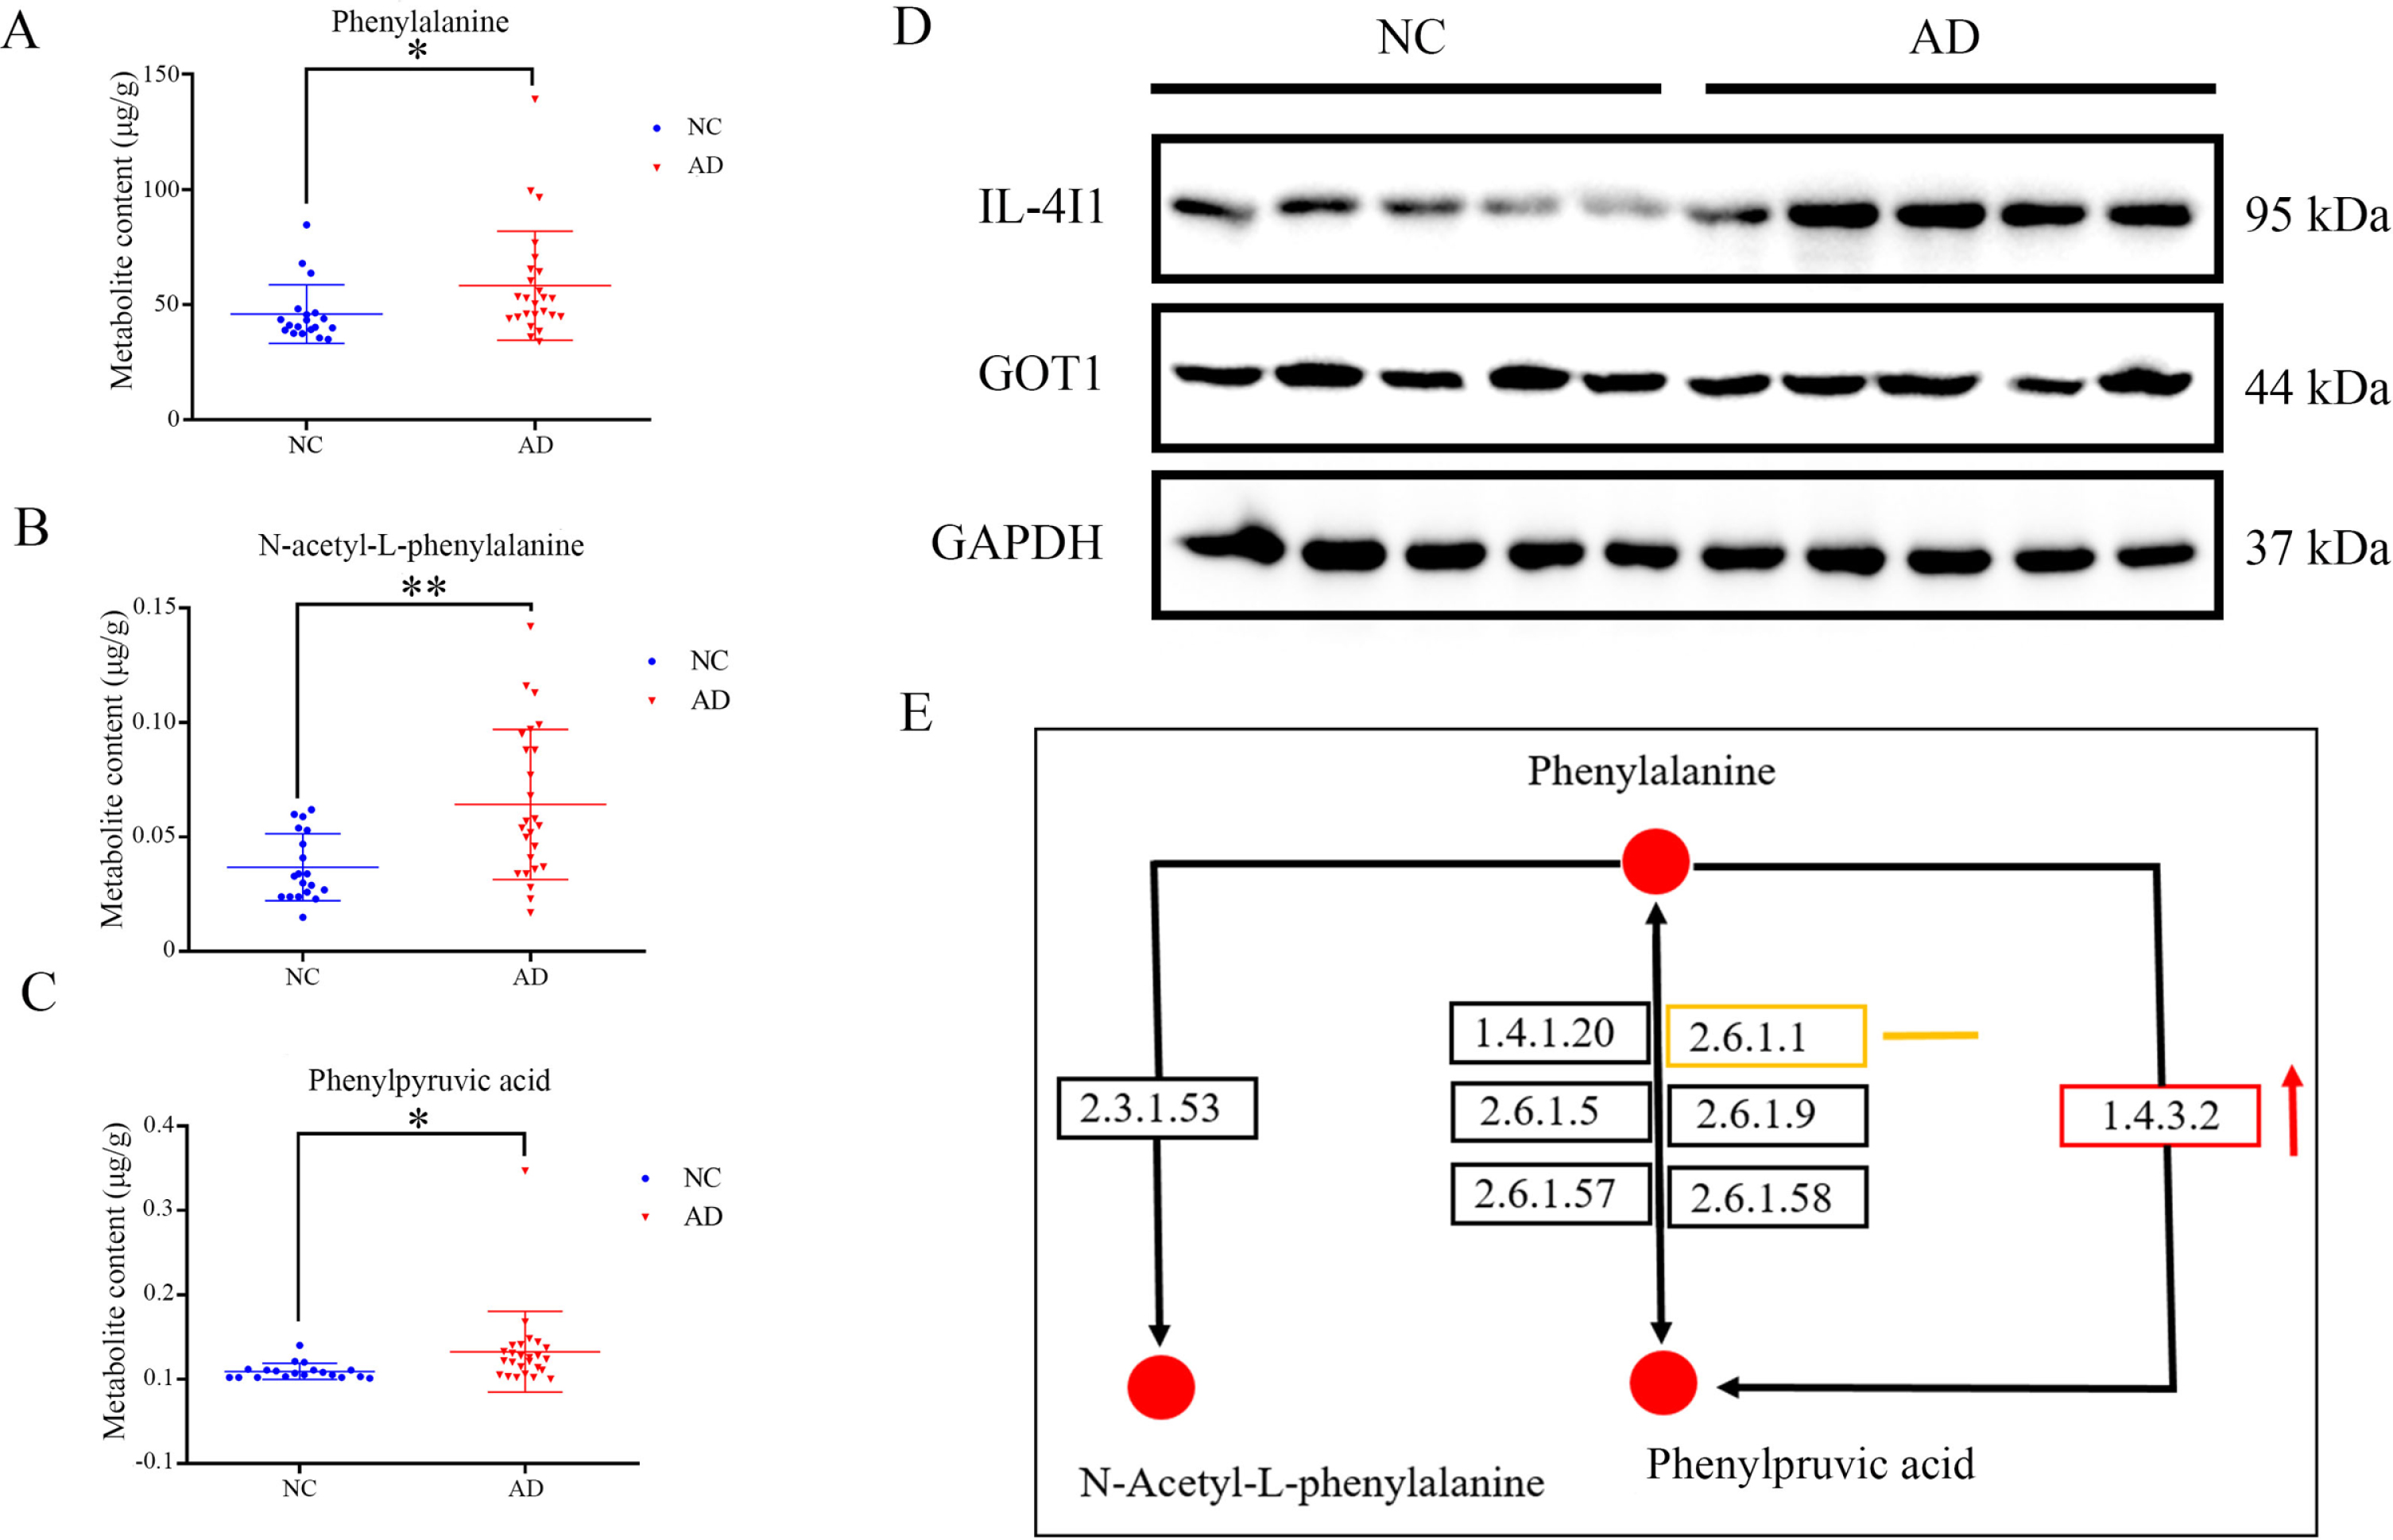
Metabolites content of phenylalanine A), N-acetyl-L-phenylalanine B) and phenylpyruvic acid C) in NC and AD group. D) Expression of IL-4I1 and GOT1 in NC and AD group. E) A schematic diagram shows the location of quantified metabolites and detected two enzymes in the phenylalanine metabolism pathway (originated from KEGG website). Red dots indicate upregulated metabolites, orange line indicates the detected enzyme GOT1 shows no obvious change, red arrow indicates the upregulation of enzyme IL-4I1.
DISCUSSION
Energy is produced through metabolism and is indispensable for biological activities. As one of the most energy consuming organ, brain function maintenance needs a stable metabolic environment. In addition, metabolites can be direct components of proteins or DNA. Metabolites can also exert regulatory functions in some certain signaling pathways [47]. Therefore, comprehensive metabolomics of brain tissues will provide important information for understanding AD mechanisms. To our knowledge, our study is the first to explore the relationship of ABC score assessed AD samples with metabolic changes using LC-MS/MS based metabolomics. Quantification of phenylalanine, phenylpyruvic acid, and N-acetyl-L-phenylalanine gives us a direct insight of the dysregulated phenylalanine metabolism in postmortem brain tissues of AD group.
The cholinergic system was reported to be involved in learning [48] as well as memory formation process [49], and the cholinergic neurons have a wide distribution in brain [50]. Lack of cholinergic neurotransmitter can cause cognition impairment [51]. ACh, a kind of cholinergic neurotransmitter, transmits signals from presynaptic membrane to postsynaptic membrane and is considered to be downregulated in AD [35]. In our study, ACh was found decreased in AD group; this result further validated the decreased level of ACh is one culprit resulting in AD. From another perspective, the decreased level of ACh in turn verified the rationality of ABC score for assessment of AD.
Valine, leucine, and isoleucine biosynthesis is among the dysregulated metabolic pathways found in AD group. Evidence from AD subjects and animal models both found this dysregulated amino acid metabolism is association of with AD [52–54]. The neuroprotective role of adenosine and inosine in AD have been extensively studied. There is study analyzing gene expression of the purine metabolism associated messenger RNA expression in different brain regions. In combination with LC-MS/MS based metabolomics, altered levels of dGMP, glycine, xanthosine, inosine diphosphate, guanine, and deoxyguanosine were found implicated in purine metabolic pathway, stage- and region-dependent deregulation of purine metabolism is associated with AD [55]. In the present study, inosine, adenine, guanosine, 3’-AMP, and 5-Aminoimidazole ribonucleotide listed in Table 3 are all participators of purine metabolism. We demonstrate that multiple metabolic pathways dysregulations are associated with AD pathology.
Potential drug targets can be found through analyzing dysregulated metabolites. Take ACh as an example: loss of ACh plays an important role in AD symptoms formation. The current treatment for remission of AD symptoms is based on enhancing cholinergic signaling mediated by ACh and ACh receptor family [56]. The traditional drug design mechanism is dependent on inhibition of acetylcholinesterase activity to elevate ACh level in the brain [57]. Elimination of toxic metabolites and preserving neuroprotective metabolites may be promising strategy for drug design.
In our study, we found the content of many metabolites are in accordance with former reports such as ACh [35, 56]. Interestingly, the same metabolite content in plasma may be different with brain tissues, for example, phenylalanine was found decreased in plasma of AD [58] but increased in brain tissues in our detection. This phenomenon may be due to the upregulated absorption of phenylalanine in AD brain tissues, which lead to phenylalanine decrease in plasma of AD. For AD diagnosis in clinical work, the cognitive function detection, imageological examination, clinical symptoms, and markers from biofluids (such as cerebrospinal fluid, blood, urine, saliva) are all of important reference value. The reported metabolic changes in biofluids have provided basic clues for AD biomarker searching [58–60]. Future work trying to use the non-invasive methods to collect samples (such as blood, urine, saliva), and compare it with the metabolomics of the brain, will provide the metabolic differences as well as the similarities between brain tissues and biofluids, which may find important and practical metabolic biomarkers of AD, and contribute to clinical AD diagnosis.
The defects of postmortem brains for metabolic analysis is that the data of some labile metabolites may not reveal the real metabolism condition presumably for autolytic activities [61]. Individual differences and various impact factors including age, postmortem interval, corpse storage temperature, and manner can be responsible for metabolic differences. The individual differences are reasonable resulted from multiple factors. However, postmortem brain tissues play an irreplaceable role in understanding or verifying complex mechanisms in neurophysiology or neurological diseases. The detected metabolites in NC group and AD group will provide important reference value for AD research. Analysis of differentially expressed metabolites with their corresponding enzymes may provide more reliable and exquisite clues for metabolism research. Of note, the enzyme activity can also be impacted by multiple factors such as temperature, pH, and ionic concentration. The expression of enzyme is not identical to the enzyme activity. IL-4I1 has unique L-amino acid oxidases properties, having highest specific activity with phenylalanine. The enzyme activity of IL-4I1 can be affected by pH [62], while the optimal enzyme activity of GOT1 can be affected by temperature and pH [63]. Comprehensive consideration of multiple factors impacting the metabolic activity will contribute to understanding of metabolic perturbations in AD.
In summary, our study is the first trying to explore the potential metabolic perturbations in ABC score assessed AD samples. Phenylalanine metabolism pathway was found aberrant in AD group, and it may provide new clues for AD mechanisms exploration. Widespread metabolic perturbations such as purine metabolism and amino acid metabolism are considered to be potential causes for AD pathological changes formation. Loss of some metabolites beneficial for normal brain function maintenance and accumulation of neurotoxic metabolites may be important factors for AD onset and progress. Some metabolites involved in the dysregulated metabolic pathways would be potential biomarkers or drug targets for AD.
Footnotes
ACKNOWLEDGMENTS
The authors would like to thank Ms. Yunli Ling and Ms. Yuanyuan Xu for preparing the mounted paraffin sections. Tissue provided by: National Developmental and Functional Human Brain Bank, Chinese Academy of Medical Sciences and Peking Union Medical College, Beijing, China. This study was supported by the Institute of Basic Medical Sciences, Chinese Academy of Medical Sciences, Neuroscience Center, and the China Human Brain Banking Consortium. This study was supported by grants from the National Natural Science Foundation of China (NSFC #81771205, #91632113), the Natural Science Foundation and Major Basic Research Program of Shanghai (16JC1420500, 16JC1420502), and the CAMS Innovation Fund for Medical Sciences (CIFMS #2017-I2M-3-008).