
Abstract
Background:
Montreal Cognitive Assessment (MoCA) and Mini-Mental State Examination (MMSE) are neuropsychological tests commonly used by physicians for screening cognitive dysfunction of Alzheimer’s disease (AD). Due to different imperfect reference standards, the performance of MoCA and MMSE do not reach consensus. It is necessary to evaluate the consistence and differentiation of MoCA and MMSE in the absence of a gold standard for AD.
Objective:
We aimed to assess the accuracy of MoCA and MMSE in screening AD without a gold standard reference test.
Methods:
Studies were identified from PubMed, Web of Science, CNKI, Chinese Wanfang Database, China Science and Technology Journal Database, and Cochrane Library. Our search was limited to studies published in English and Chinese before August 2021. A hierarchical Bayesian latent class model was performed in meta-analysis when the gold standard was absent.
Results:
A total of 67 studies comprising 5,554 individuals evaluated for MoCA and 76,862 for MMSE were included in this meta-analysis. The pooled sensitivity was 0.934 (95% CI 0.905 to 0.954) for MoCA and 0.883 (95% CI 0.859 to 0.903) for MMSE, while the pooled specificity was 0.899 (95% CI 0.859 to 0.928) for MoCA and 0.903 (95% CI 0.879 to 0.923) for MMSE. MoCA was useful to rule out dementia associated with AD with lower negative likelihood ratio (LR-) (0.074, 95% CI 0.051 to 0.108). MoCA showed better performance with higher diagnostic odds ratio (DOR) (124.903, 95% CI 67.459 to 231.260).
Conclusion:
MoCA had better performance than MMSE in screening dementia associated with AD from patients with mild cognitive impairment or healthy controls.
Keywords
INTRODUCTION
Alzheimer’s disease (AD), the most common cause of dementia, is a progressive neurodegenerative condition characterized by cognitive impairment, memory loss, behavioral abnormality, and social disorders [1, 2]. At present, over 50 million people around the world suffer from dementia, and this number is predicted to rise to 152 million by 2050 in low- and middle-income countries with an aging population [1]. AD affects both individuals and their families with huge social, economic, and health burdens; therefore, a great concern has been raised in the global public health field [1, 2]. Moreover, AD is an irreversible and incurable condition [1, 3]. Thus, early-stage screening and the accurate identification of AD are of significant importance in clinical practice.
Screening, assessing, and diagnosing AD is a stepwise process in primary care, and screening cognitive impairment in clinical practice settings can increase recognition of AD dementia [3, 4]. Cognitive screening tests are a relatively inexpensive neuropsychological measurement that has been recommended as an important component of diagnostic tests in detecting dementia associated with AD [5]. Cognitive screening tests such as the Montreal Cognitive Assessment (MoCA) [6] and Mini-Mental State Examination (MMSE) [7] are commonly used by physicians for screening of cognitive impairment in AD patients [8–10]. Early detection with a positive screening of MMSE and MoCA is the first step in facilitating a full diagnosis and early appropriate clinical interventions [4, 10]. At present, dozens of validation studies showed MoCA was superior to MMSE in detecting cognitive impairment of mild AD by the international reference standards [11–13].
In fact, full diagnostic reference standards for AD are mainly based on clinical diagnosis and biomarkers, which are recommended by the National Institute of Neurological and Communicative Diseases and Stroke/Alzheimer’s Disease and Related Disorders Association (NINCDS-ADRDA) [5], National Institute on Aging-Alzheimer’s Association (NIA-AA) [14], International Working Group (IWG) [15], and Diagnostic and Statistical Manual of Mental Disorders (DSM) [16]. Currently, the NIA-AA research framework defines AD in vivo by biomarkers [14], which is more accurate than clinical observations and usually regarded as the “gold standard” by some researchers. However, none of the biomarkers is as sensitive as the direct examination of tissue at autopsy [14]. Researchers reported that the overall accuracy of clinical diagnosis, biomarkers, neuroimaging, and genetic testing in diagnosing AD are never 100% accurate when confirmed by autopsy validation [17–21]. Khan and Alkon [17] found that the sensitivity and specificity of clinical diagnosis were 78% and 20% and biomarkers were 97% and 100%, respectively. Additionally, the sensitivity of NINCDS-ADRDA clinical criteria ranged from 76% to 93%, and the specificity ranged from 55% to 91%, compared with neuropathological verification [19]. Until recently, the best standard to define AD is by longitudinal follow-up with biomarkers in living people and by postmortem examination based on clinical symptoms [14, 22]. Nevertheless, current biomarkers used in AD research are either expensive or invasive and are difficult to obtain in the preliminary preclinical screening [14]. A brain autopsy is also an unavailable option for the living people. Thus, validation studies of MoCA and MMSE in detecting dementia associated with AD were always based on imperfect reference standards. There is evidence that ignoring the imperfect reference standard could result in substantial bias in pooled estimations to evaluate the accuracy of tests in meta-analysis [23, 24]. This type of bias is called imperfect gold standard bias in the field of statistics [23]. Clinical research without biomarkers remains a significant challenge [14]. An accurate screening test is an essential prelude to early discovery and intervention. Therefore, it is necessary to evaluate the accuracy of MoCA and MMSE in the absence of a gold standard to assess the imperfect gold standard bias in meta-analysis. In addition, characteristics of subjects (i.e., sex, age, education) in published studies could affect different positivity thresholds for cognitive screening tests [25, 26]. Various positivity thresholds then become another source of inconsistency in diagnostic performance [27]. The hierarchical summary receiver operating characteristic (HSROC) model is a recommended method to assess the variation when there are different positivity cutoff values in the included diagnostic accuracy studies [27]. Dendukuri et al. developed a hierarchical Bayesian latent-class approach based on the HSROC model to control the imperfect gold standard bias with a hope to produce unbiased pooled outcomes in the absence of a gold standard [24].
So far, several reviews and meta-analyses have studied the performance of the MoCA and MMSE in screening mild cognitive impairment (MCI) or all-cause dementia [28–32]. Pinto et al. showed the pooled area under the curve (AUCs) varied from 0.87 to 0.99 for MoCA, and 0.67 to 0.99 for MMSE in screening AD in the elderly [28]. Two meta-analyses used the HSROC model to evaluate the accuracy of MMSE at various cutoff points for all-cause dementia and subtypes (Alzheimer’s disease dementia, Lewy body dementia, vascular dementia, and frontotemporal dementia) with international reference standards [30, 31]. Currently, outcomes of cognitive screening tests in published meta-analyses vary tremendously due to different reference standards. To our knowledge, there is no review and meta-analysis in the literature on the accuracy of MoCA and MMSE in detecting cognitive impairment of AD in the absence of a gold standard.
In this study, we performed a meta-analysis with the hierarchical Bayesian latent-class model for all available eligible studies to evaluate the performance of MoCA and MMSE for AD screening. We aimed to compare the accuracy of MoCA and MMSE in screening for AD from MCI or normal cognitive function in the absence of a gold standard. It is significant to verify the conclusions of the published studies using statistical methods to pool sensitivity and specificity in a meta-analysis without a gold standard reference.
METHODS
Data collection and search strategy
We conducted this meta-analysis following the Preferred Reporting Items for Systematic Reviews and Meta-analyses extension for Diagnostic Test Accuracy Studies (PRISMA-DTA) guidelines [33] (see Supplementary Table 1). A comprehensive search strategy combining the key words and Medical Subject Heading (MeSH) terms was utilized to identify relevant studies in PubMed, Web of Science, China National Knowledge Infrastructure, Chinese Wanfang Database, China Science and Technology Journal Database, and Cochrane Library. Our search was limited to studies published in English and Chinese before July 15, 2021. Key words used were “Alzheimer’s disease”, “Montreal Cognitive Assessment”, “Mini-Mental State Examination”, “AD”, “MOCA”, “MMSE”, “Sensitivity and Specificity”. Reference lists of previous reviews and meta-analyses were identified and reviewed to reveal other potentially relevant studies. The strategy used for searching PubMed database can be found in Supplementary Table 2.
Inclusion and exclusion criteria
We selected studies based on the following criteria: 1) patients with AD and MCI, and healthy controls (HC); 2) validation study using the MoCA and MMSE as cognitive screening tests (both with a total score of 30); 3) constructed validity of the above cognitive screening tests compared to the reference standard (recommendations from NIA-AA, NINCDS-ADRDA and IWG, the DSM criteria and other approved criteria); 4) reported the results in English or Chinese with sufficient information to reconstruct a 2×2 contingency table. The exclusion criteria were: 1) the study included patients with cognitive impairment caused by other diseases (post-stroke, Parkinson’s disease, cerebral infarction, and vascular dementia), other systemic diseases (e.g., thyroid dysfunction, severe anemia, syphilis, HIV, or abnormalities in vitamin B12), major psychiatric disorders (e.g., psychotic disorder, bipolar disorder, substance abuse), psychotropic drugs (antidepressant, antipsychotics, hypnotics, etc.) and severe or unstable medical condition; 2) the publication provided insufficient information to construct a contingency table. The detailed reasons for exclusion are listed in the flow diagrams (Fig. 1). Two authors (F.J.L. and Z.J.) independently screened selected eligible studies for inclusion.
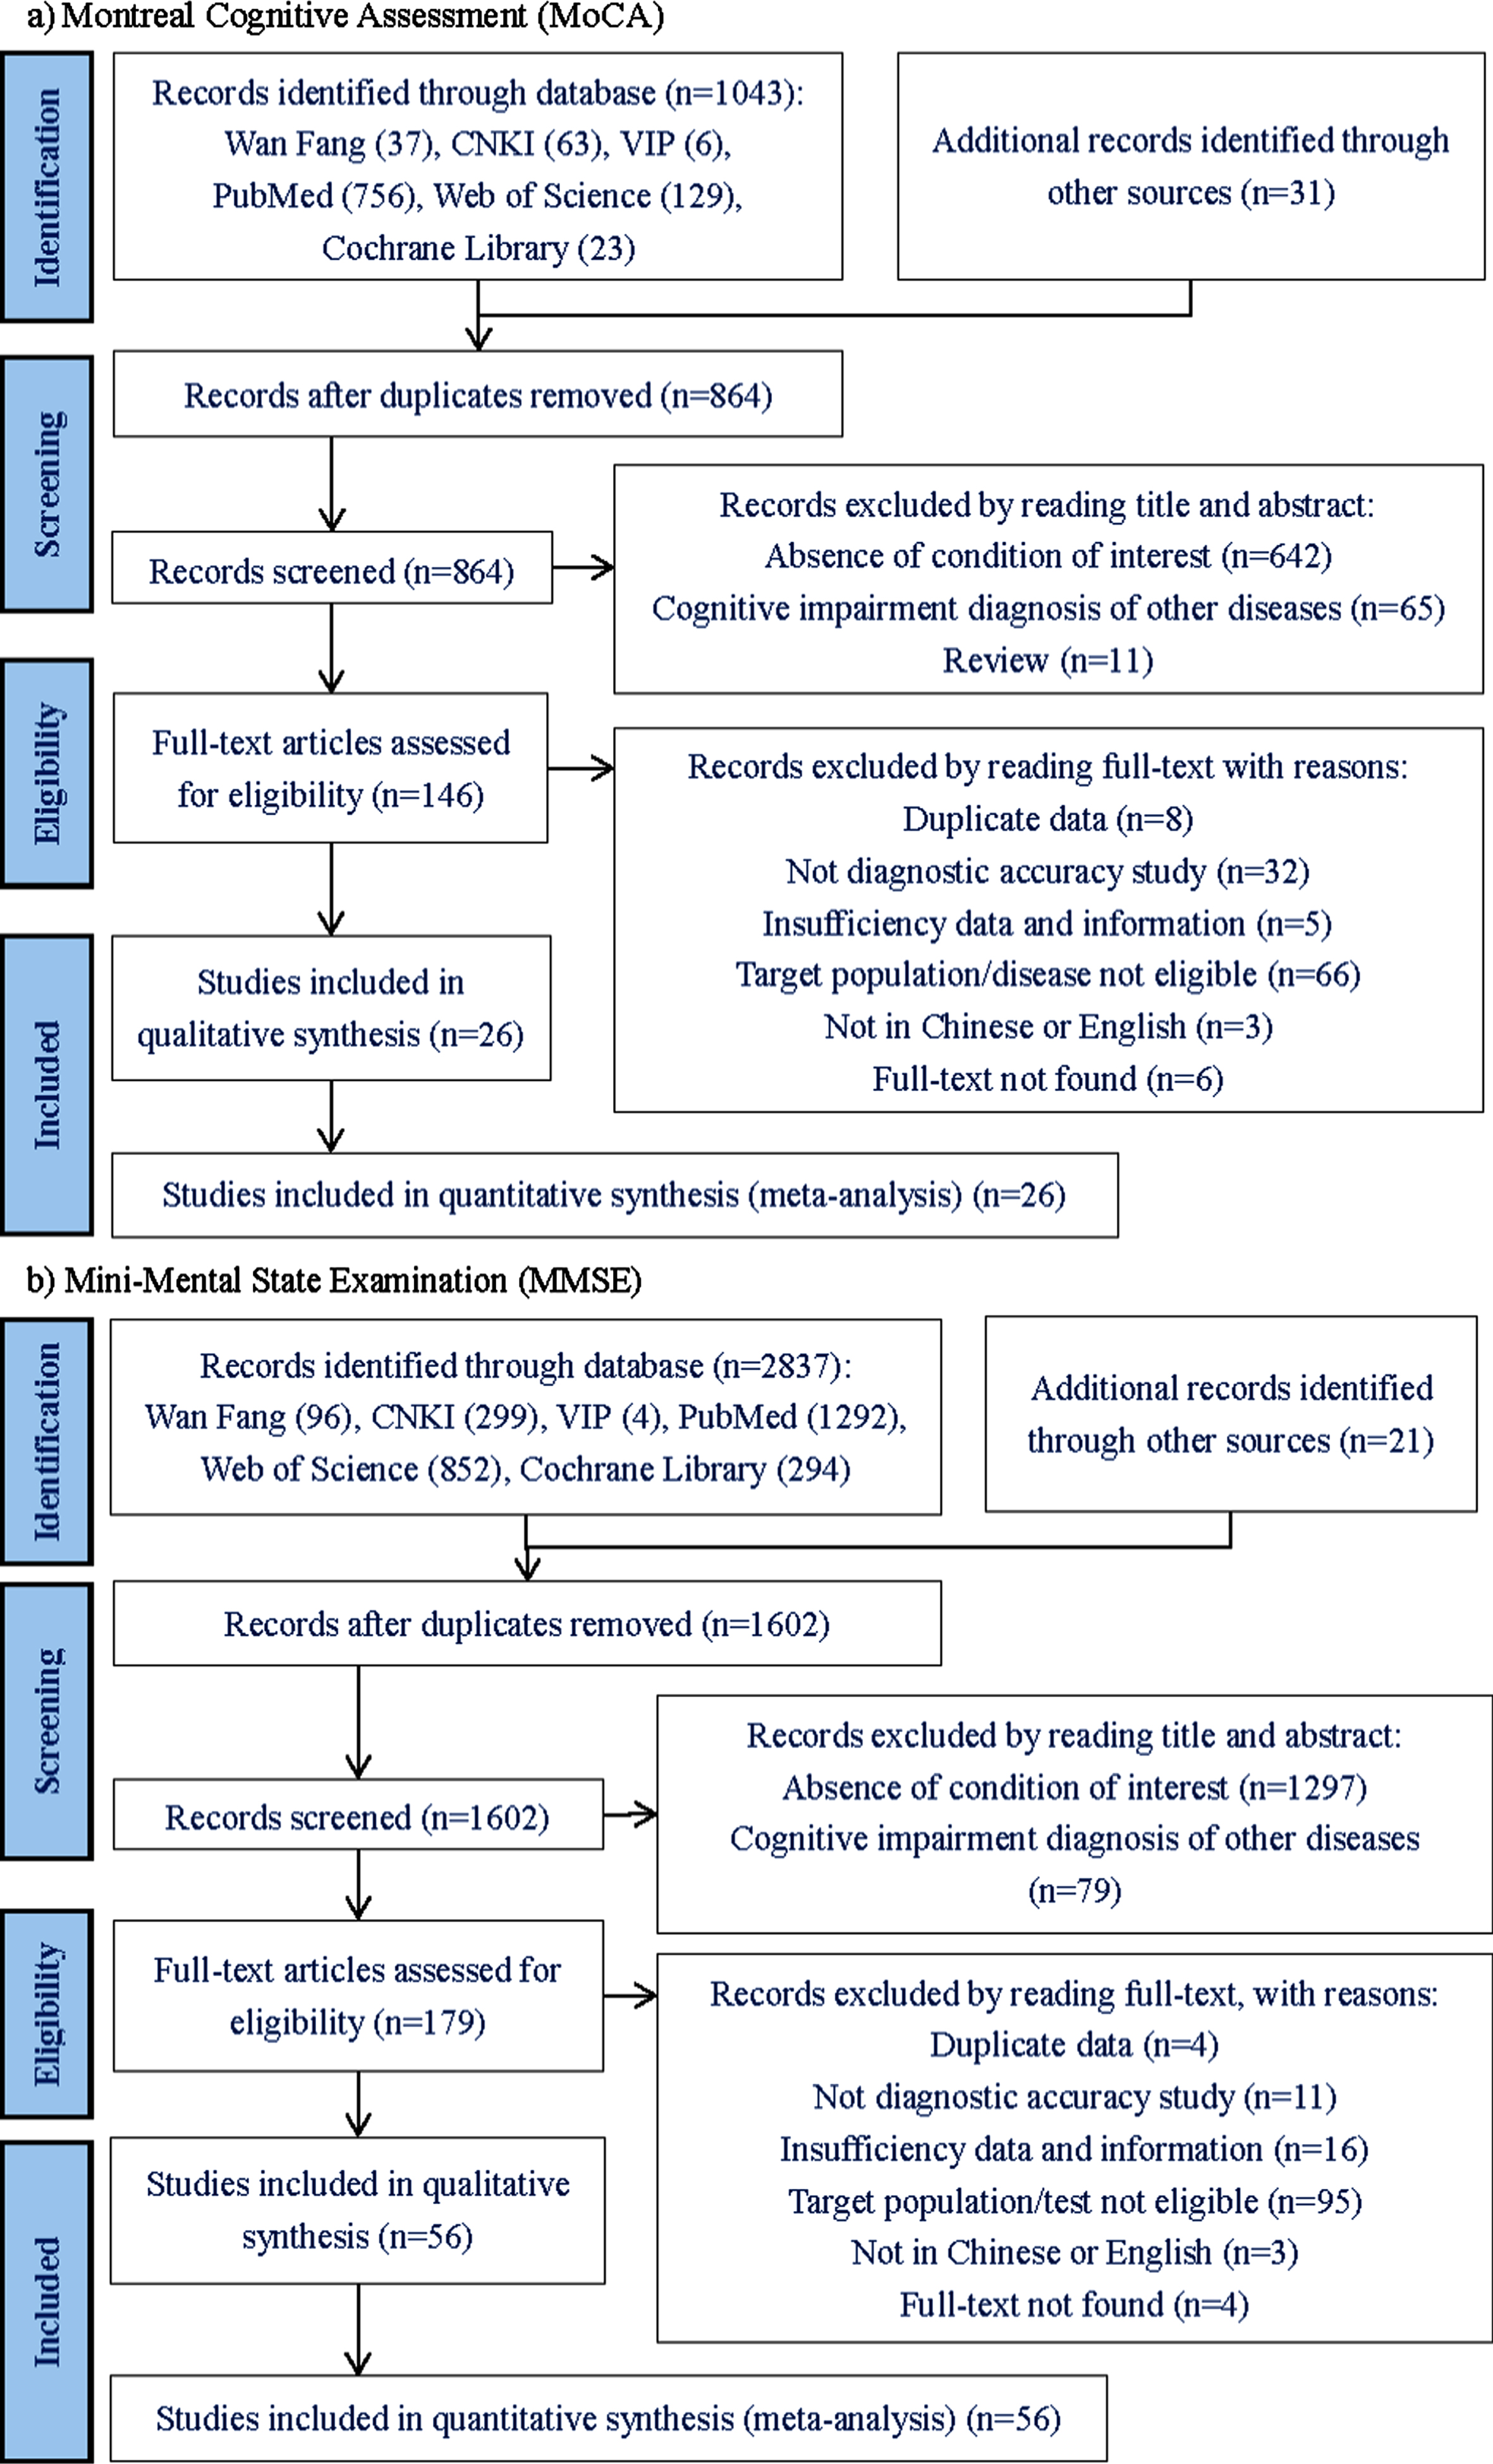
PRISMA Flow chart of study selection. MoCA (a) and MMSE (b).
Data extraction
Data from each selected study were extracted independently by two authors (F.J.L. and Z.J.). Discrepancies in opinion were resolved by discussion with two additional reviewers (X.N.W. and H.P.Z). If there were different validation groups in the same study, we included all of them. If multiple reference standards were provided in the article, we extracted all of them for our analysis. If more than one cutoff were reported in a study, we selected the optimal value with the best balance of sensitivity and specificity.
Sensitivity, specificity, numbers of true positive (TP), false negative (FN), false positive (FP), and true negative (TN) values were collected from the eligible study. Descriptive information for patient characteristics (sample size, age, gender, and education status) were extracted for analysis. We also listed the study information including title, first author, year of publication, country of study, cognitive type, reference standard, and cutoff values. When needed, we contacted the corresponding author online to ask for missing information. An article was dropped from our analysis if there was no response from the author.
Quality assessment
Two authors (F.J.L. and Z.J.) independently assessed the risk of bias and applicability of the diagnostic accuracy studies using the Quality Assessment of Diagnostic Accuracy Studies 2 (QUADAS-2) checklist [34]. We focused on four domains: patient selection, index test, reference standard, and flow and timing. Risk of bias and concern of applicability for each domain were categorized as “low”, “high”, or “unclear”. Any disagreement was resolved by discussion with two additional reviewers (X.N.W. and H.P.Z).
Statistical analysis
With available information extracted from the eligible studies, we converted the results of two cognitive screening tests into dichotomous (AD versus non-AD). The TP, FP, FN, and TN values in contingency tables were directly obtained or calculated indirectly according to the sensitivity and specificity. We used the HSROC model of Rutter and Gatsonis [27] to evaluate variation in diagnostic accuracy and cutoff values. The pooled sensitivity, specificity, diagnostic odds ratio (DOR), positive and negative likelihood ratio (LR+, LR-) and their associated 95% confidence intervals (CIs) were jointly estimated by a hierarchical Bayesian latent class model [24] in the absence of a gold standard. HSROC curves were drawn to show the diagnostic effects under different cut-off values.
LRs, including LR+ and LR-, were generated by sensitivity and specificity. It is a ratio of the probability that a test result is correct to the probability that the test is incorrect [35, 36]. We used LR statistics to summarize the properties of cognitive screening tests with higher LR+ meaning “rule in disease” and lower LR- meaning “rule out disease” in clinical research [35, 36]. Furthermore, the post-test probability can be calculated by LR and pre-test probability using Bayes theorem [35, 36]. We assessed that the pre-test probability of AD was 35% according to the reported characteristics and prevalence of all included studies [37, 38]. The results were displayed in Fagan plot.
Heterogeneity was evaluated using Cochran’s Q test or inconsistency index (I2), with p < 0.05 or I2 > 50% indicating significant heterogeneity [39]. Meta-regression analyses were performed to explore potential sources of heterogeneity. Deeks’ analysis was used to assess publication bias, with p < 0.05 suggesting that publication bias might exist [40].
All results of meta-analysis were performed by R (version 3.6.3), Stata (version 14.0) and the Cochrane Collaboration Review Manager (version 5.4) statistical software.
RESULTS
Study identification and characteristics
A total of 67 studies with at least one of the two cognitive screening tests (MoCA and MMSE) conducted across more than 20 countries were included in this meta-analysis, with 29 datasets from 26 studies for MoCA (Fig. 1a) and 67 datasets from 56 studies for MMSE (Fig. 1b). Of these, 16 were from China, 9 from Brazil, 6 from Korea, 6 from the United States, and 5 from Spain. The sample size ranged from 31 to 17,555 with a total of 76,862 individuals for MMSE and 5,554 for MoCA included in our final analysis. The detailed characteristics of the eligible studies were summarized in Table 1.
Characteristics of included studies
CN, China; HK, Hong Kong; TW, Taiwan; SG, Singapore; PT, Portugal; KR, Korea; ES, Spain; TN, Tunisia; CH, Switzerland; CZ, Czech; US, America; BR, Brazil; CA, Canada; GR, Greece; IN, India; IR, Iran; IT, Italy; JP, Japan; LK, Sri Lanka; PL, Poland; TR, Turkey; UK, United Kingdom; GER, Germany; TP, true positive; FN, false negative; FP, false positive; TN, true negative; AD, Alzheimer’s disease; MCI, mild cognitive impairment; HC, health counterparts; U, According to the articles, the content of this section is unclear.
Quality of included studies
Results for risk of bias are shown according to the QUADAS-2 (Fig. 2 for MoCA, and Fig. 3 for MMSE). The overall methodological quality of included studies was considered moderate (Fig. 4).

Risk assessment of included studies of MoCA using QUADAS-2.

Risk assessment of included studies of MMSE using QUADAS-2.

Summary risks of bias and applicability concerns. The overall methodological quality of included studies was moderate.
Results of meta-analysis
Summary estimates from the meta-analysis are presented in Table 2. The pooled sensitivity was 0.934 (95% CI 0.905 to 0.954) for MoCA and 0.883 (95% CI 0.859 to 0.903) for MMSE, while the pooled specificity was 0.899 (95% CI 0.859 to 0.928) for MoCA and 0.903 (95% CI 0.879 to 0.923) for MMSE. MoCA showed higher sensitivity (93.4%) than MMSE, while the two tests presented a fairly high specificity (around 90%).
Results of meta-analysis and Bayes analysis
As for LR, the LR+ was 9.220 (95% CI 6.541 to 12.996) for MoCA and 9.135 (95% CI 7.293 to 11.441) for MMSE, while the LR- was 0.074 (95% CI 0.051 to 0.108) for MoCA and 0.130 (95% CI 0.107 to 0.157) for MMSE. The overall DOR was 124.903 (95% CI 67.459 to 231.260) for MoCA, and 70.430 (95% CI 50.001 to 97.260) for MMSE. MoCA had better performance than MMSE with a much higher DOR value.
The HSROC curve presented summary points, 95% confidence region and 95% prediction region (Fig. 5), which intuitively illustrated the performance of the two cognitive screening tests in detecting dementia associated with AD. The forest plots revealed the sensitivity and specificity of MoCA and MMSE (Fig. 6).
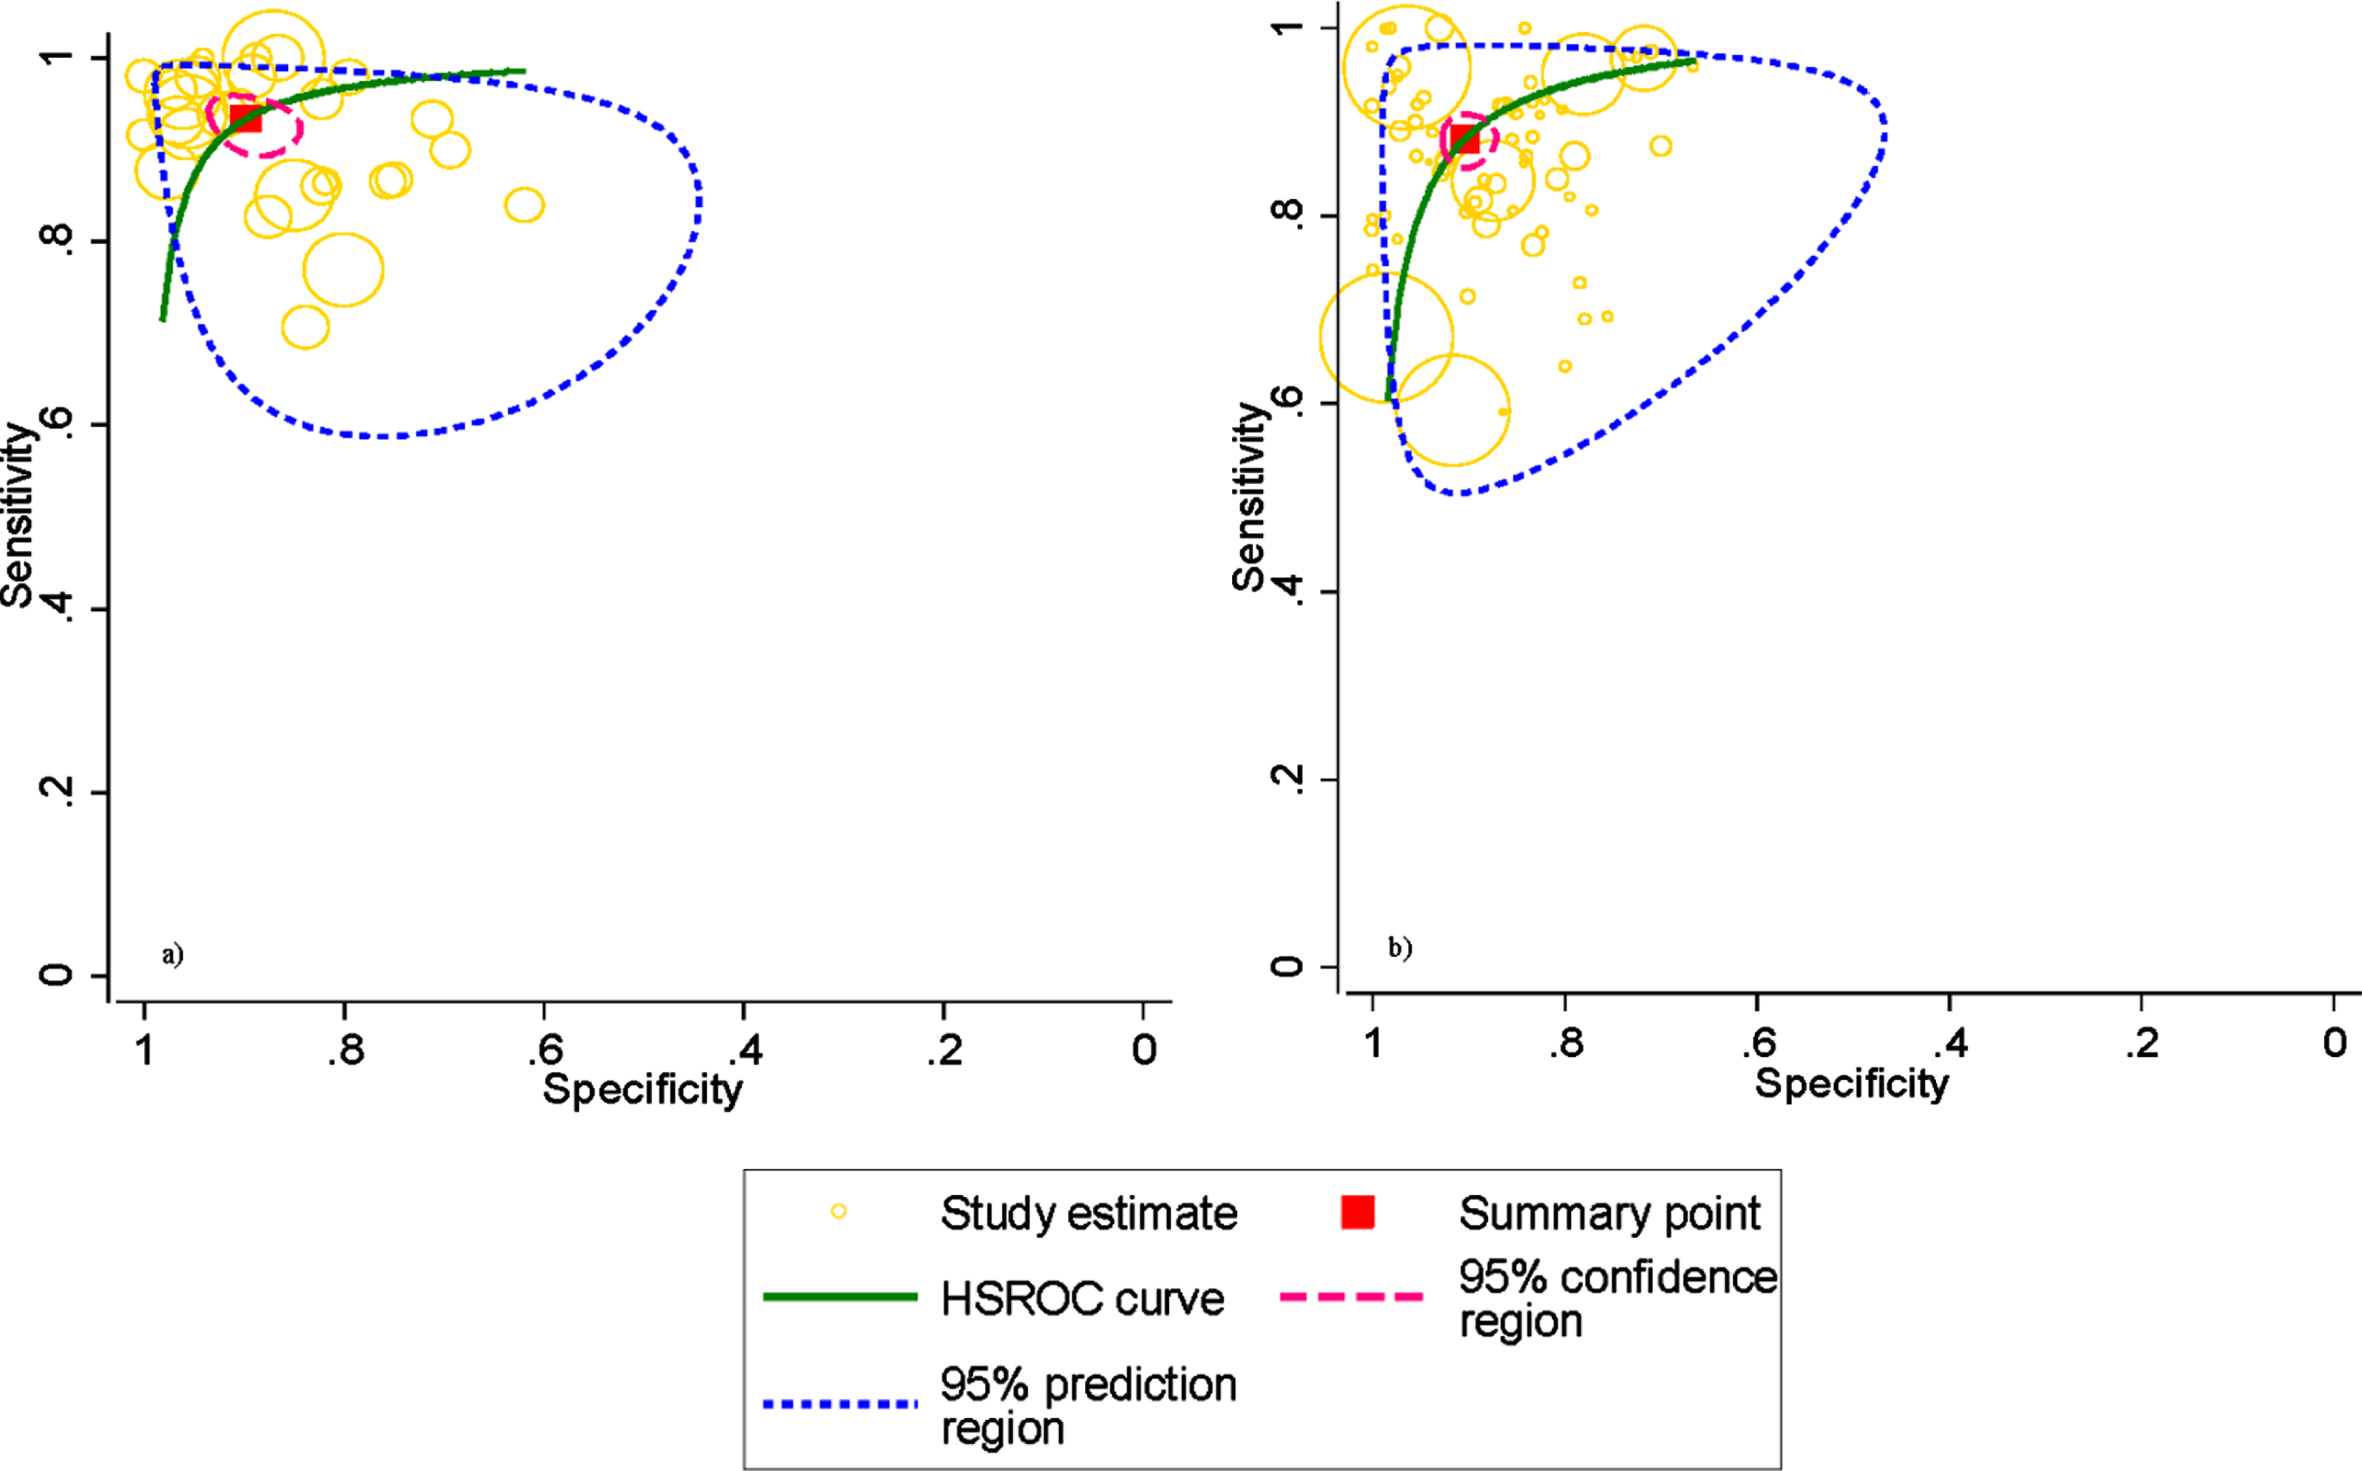
HSROC curves for diagnosing AD. MoCA (a); MMSE (b). Pooled sensitivities and specificities in detecting AD are given by red solid box. HSROC curves, the 95% confidence region (pink dotted line) as well as the 95% prediction region (blue dotted line) are also given.

Forest plots for sensitivity and specificity. MoCA (a), MMSE (b).
Results of Bayes analysis
Clinical utilization of the two tests for detecting cognitive impairment of AD was evaluated using the LRs. Post-test probability was calculated based on the Bayes’ theorem. We assessed pre-test probability of 35%, which was reported in the statistical analysis section, and the corresponding post-test probability has been shown using Fagan’s nomograms (Fig. 7). The Fagan plots suggest that MoCA (Fig. 7a) and MMSE (Fig. 7b) are equally informative with an 83% post-test probability of AD following a “positive” test result. However, MoCA was more useful to rule-out the screening with a 4% post-test probability of AD following a “negative” MoCA result, as compared to the MMSE (7%).
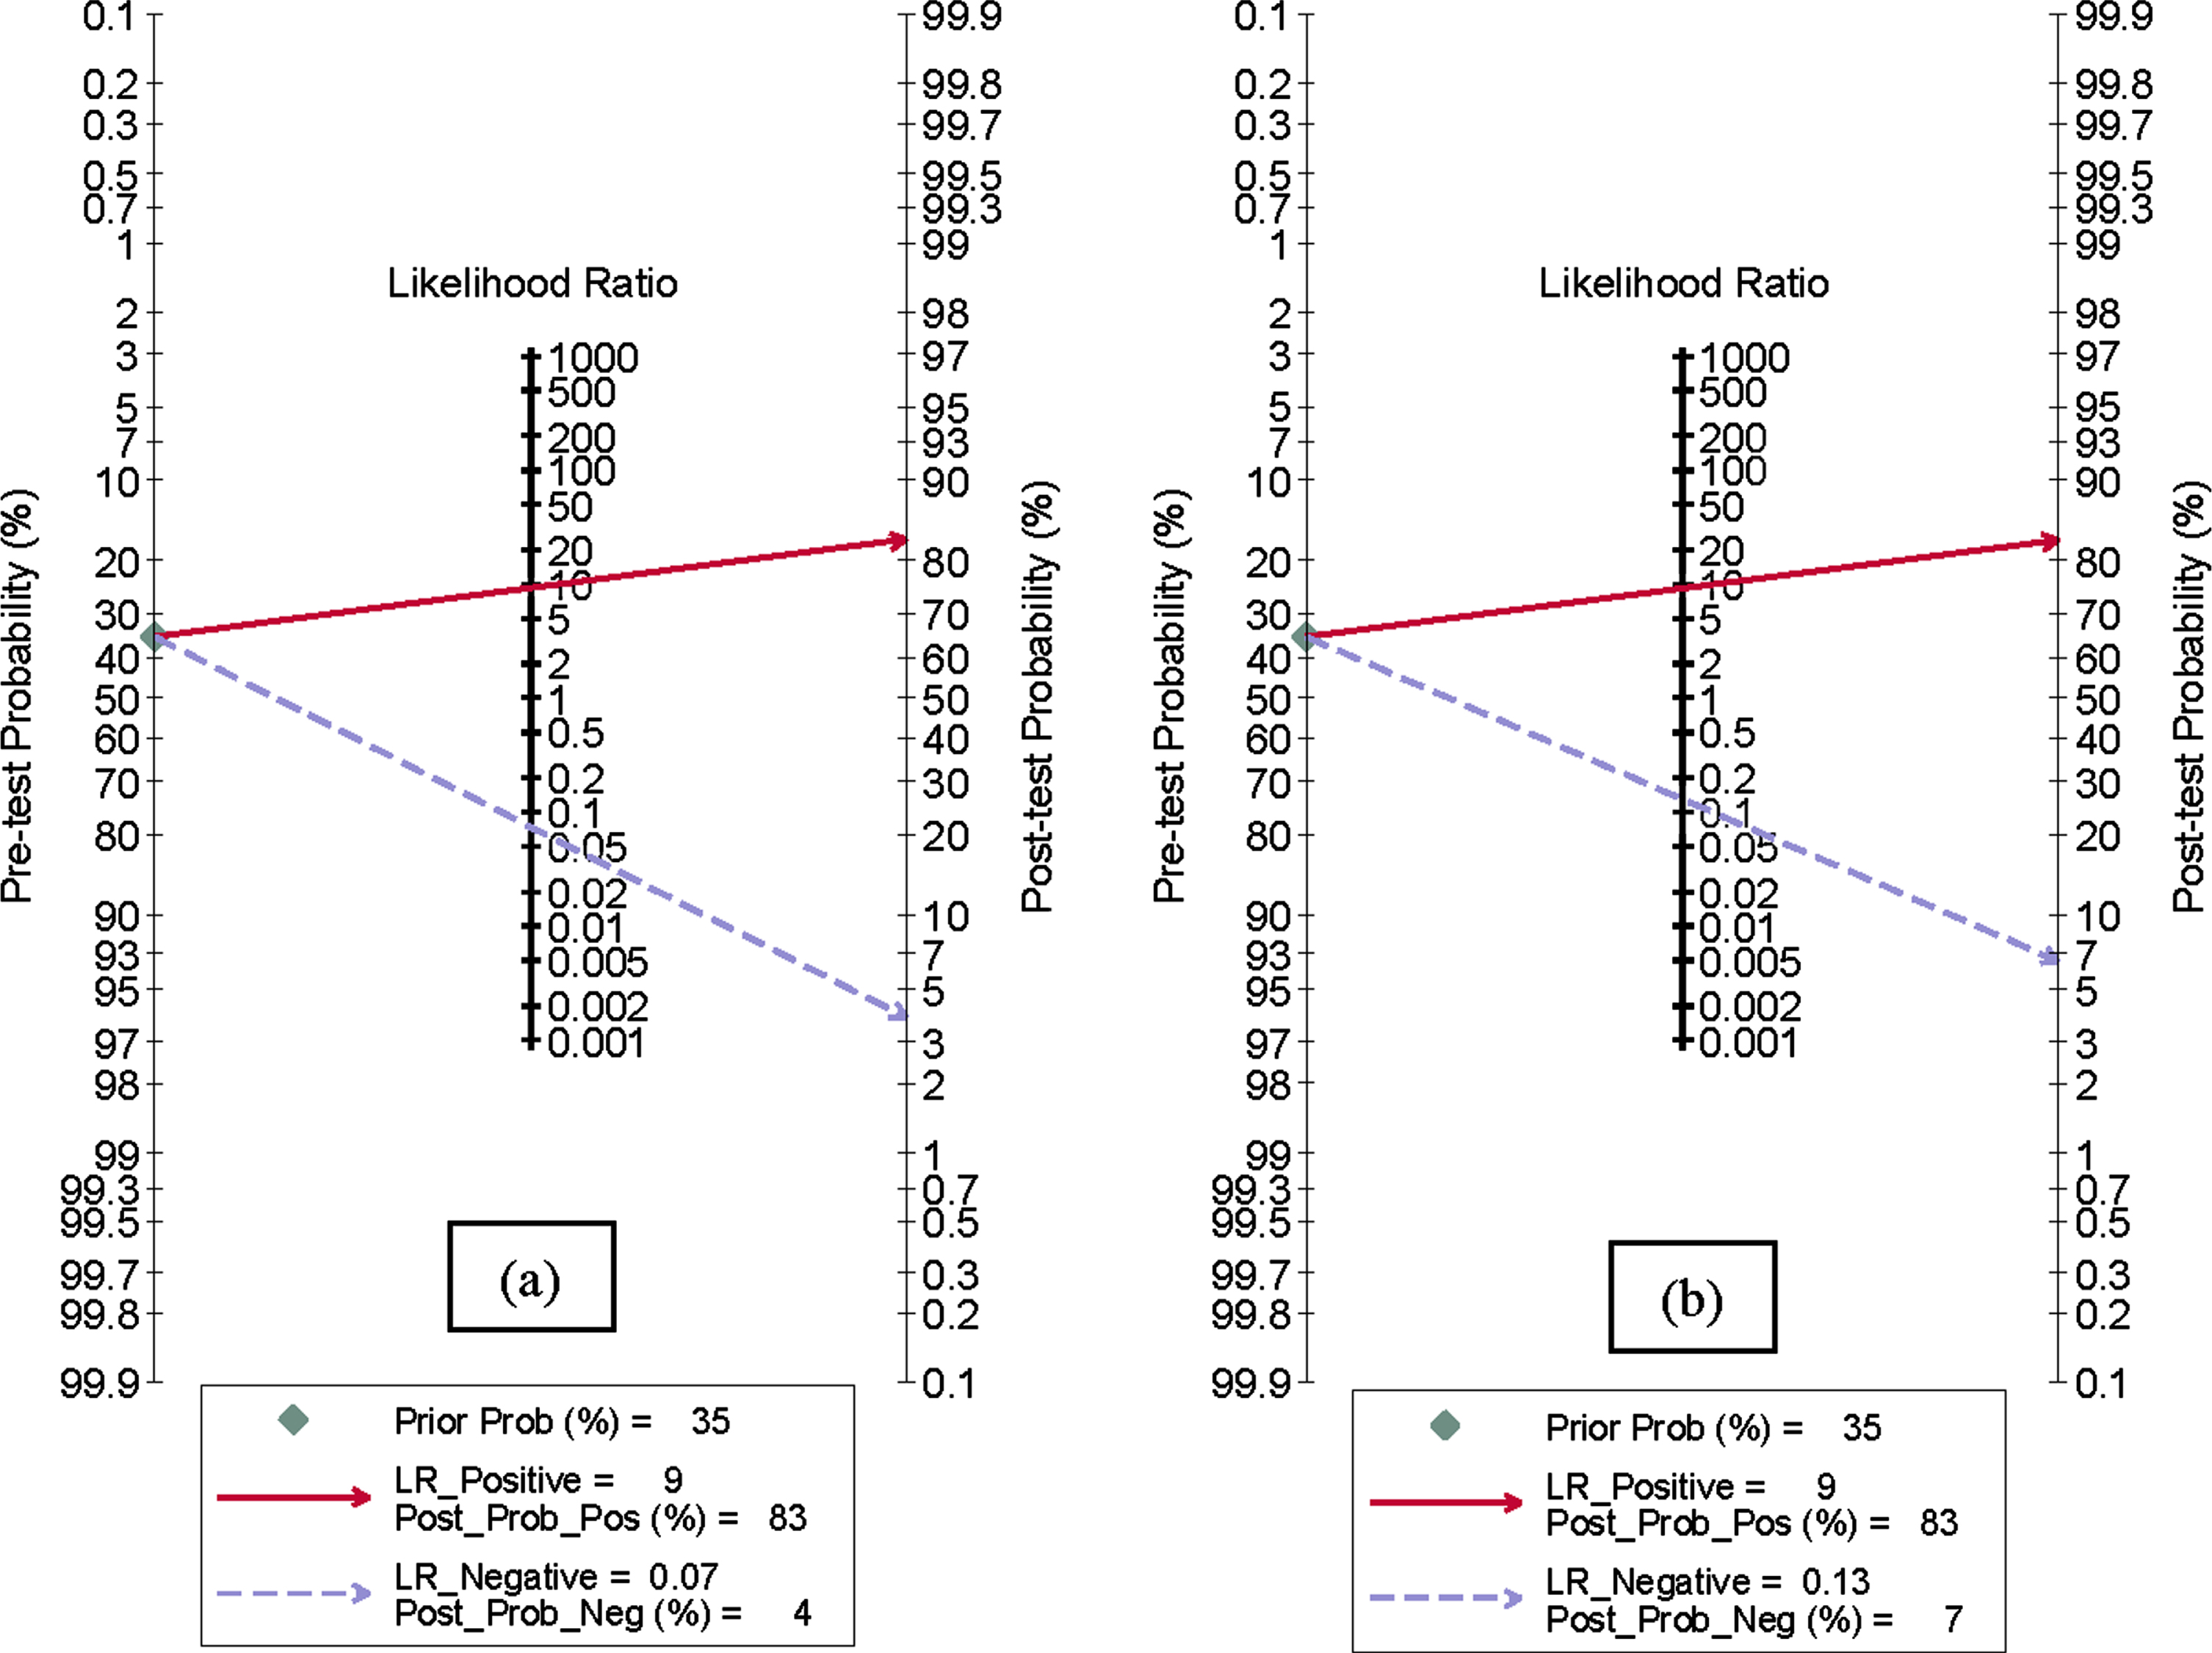
Fagan plot analysis to evaluate the diagnostic accuracy of cognitive screening tests in detecting Alzheimer’s disease. An axis on the left represents the prior log-odds (pre-test probability), an axis in the middle represents the log likelihood ratio (LR) and an axis on the right represents the posterior log-odds (post-test probability).
Results of heterogeneity exploration and publication bias
The Q-test demonstrated heterogeneity (p < 0.01) and the Higgins I2 statistics (I2 > 50%) demonstrated considerable heterogeneity among studies in terms of sensitivity and specificity of the two cognitive screening tests (Fig. 6), with 88.29% sensitivity and 87.38% specificity for MoCA (Fig. 6a), and 98.57% sensitivity and 98.44% specificity for MMSE (Fig. 6b).
Meta-regression analyses were performed to discuss the sources of heterogeneity. Seven dimensions including publication year (before 2010 versus after 2010), number of patients (more than or equal to 200 patients versus less than 200 patients), country or region (studies from Asia versus other continents), population type (whether MCI patients were included or not), average age of population (over 70 years old versus less than or equal to 70 years old), average education level of population (more than 12 years versus less than or equal to 12 years), and reference standard (only one reference standard versus multiple reference standards) were analyzed in our meta-regression. Meta-regression results show the seven dimensions mainly lead to the heterogeneity and are independently associated with sensitivity and specificity of MoCA (p < 0.05, see Supplementary Table 3) and MMSE (p < 0.05, see Supplementary Table 4). Results of meta-regression analyses are presented by figures as well (see Supplementary Figure 1).
Results of Deeks’ funnel plot and Deeks’ asymmetry test (Fig. 8) suggest that the likelihood of publication bias in the included studies is low for MoCA (p = 0.90, Fig. 8a) and MMSE (p = 0.25, Fig. 8b).
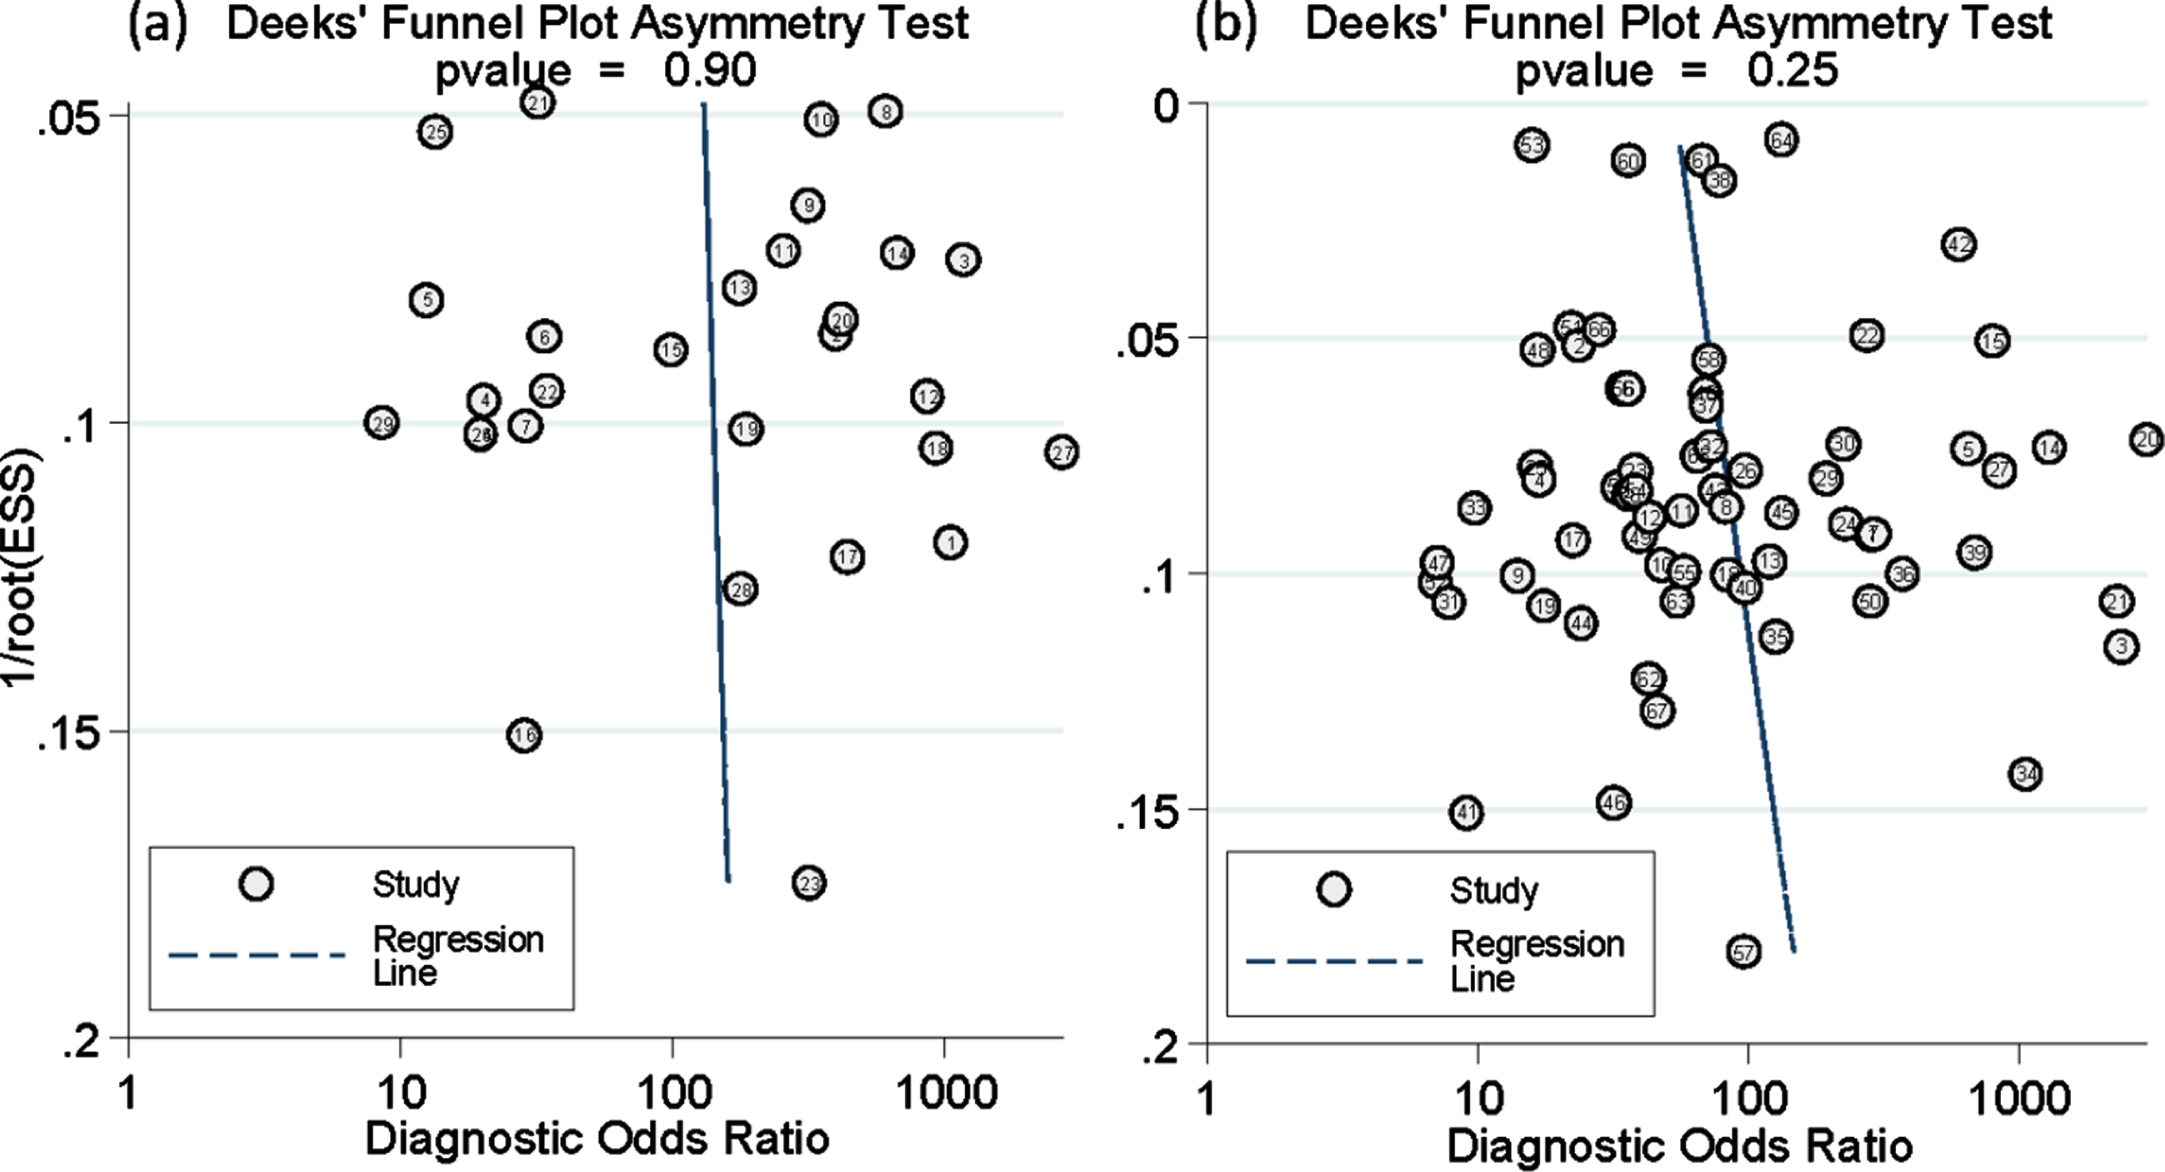
Deeks’ funnel plot. (a) Deeks’ funnel plot for MoCA. A p value of 0.90 indicates absence of publication bias. (b) Deeks’ funnel plot for MMSE. A p value of 0.25 indicates absence of publication bias. ESS, effective sample size.
DISCUSSION
In this study, we conducted a meta-analysis to evaluate the accuracy of MoCA and MMSE in distinguishing AD from MCI or HC in the absence of a gold standard. Our meta-analysis revealed MoCA had better performance with a pooled sensitivity of 93.4%, a pooled specificity of 89.9%, LR+ of 9.220, LR- of 0.074, and DOR of 124.903. MMSE showed slightly inferior performance with a pooled sensitivity of 88.3%, a pooled specificity of 90.3%, LR+ of 9.135, LR- of 0.130, and DOR of 70.430, respectively. Results of our study are consistent with findings of a previous systematic review that MoCA performs better and is more sensitive than MMSE in discriminating AD from MCI or HC [28]. Similarly, Creavin et al. [30] used a HSROC model and reported the sensitivity and specificity of MMSE in detecting cognitive dysfunction of all-cause dementia were 0.85 (95% CI 0.74 to 0.92) and 0.90 (95% CI 0.82 to 0.95), respectively. However, several systematic reviews, including Creavin’s study, had insufficient data of AD dementia subtype when evaluating the accuracy of the MMSE, and did not assess the accuracy of MoCA [30, 31]. Our meta-analysis investigated the pooled accuracy of MMSE and MoCA for AD screening simultaneously and we addressed the limitations of previous studies. MoCA proved to be more sensitive and superior to MMSE in tracking AD in most primary studies [6, 46–48]. Nevertheless, one study suggested that the performance of MMSE was equivalent to that of MoCA [51]. The discrepancy might be attributed to the different cutoff value for positivity and the population classification criteria caused by different age, education, and stages of cognitive impairment. Moreover, Mellor and Tsiakiri reported the effects of social and demographic factors including sex, age, and education on the accuracy of MMSE and MoCA to detect dementia associated with AD, which could result in different positivity thresholds for cognitive screening tests [25, 26].
This study demonstrated that MoCA and MMSE were equally informative to “rule-in” dementia associated with AD following a positive result, and MoCA was more useful to “rule-out” dementia associated with AD following a “negative” result. To date, lack of a gold standard is acknowledged as a vitally important problem in assessing the accuracy of disease screening tests. Different reference standards were used in the process of diagnosis due to the absence of a gold standard, which might result in heterogeneity among studies [23, 24]. Our study is the first study to perform a meta-analysis assessing the accuracy of MoCA and MMSE tests for screening of AD simultaneously, and to overcome limitations of traditional approach by using the most advanced and rigorous hierarchical Bayesian latent-class model. This statistical method takes into account not only within- and between-study variability, but also different cut-off points across studies to justify the imperfect reference standard bias [24].
In a hierarchical Bayesian latent-class model, the true disease status (AD versus non-AD) can be treated as a dichotomous latent variable, and a hierarchical structure with two levels (a within-study level for a specific study and a common between-study level for all studies) account for variability in the distribution of screening results in each study and variation in using difference positivity thresholds across studies. An assumption that the screening results of MoCA and MMSE tests are conditionally independent given the true disease status is set in this hierarchical latent-class model. We used the Bayesian method to estimate the parameters of interest for this model. Since it is difficult to find analytical solution for the marginal posterior distributions of specified parameters, we used the Monte Carlo Markov Chain (MCMC) with Gibbs sampling techniques to obtain the posterior estimators for parameters of interest. The advantage of this statistical method is it allowed for variation in cutoff values, different reference standards can be modeled, and imperfect gold standard bias can be investigated. However, conditional independence between two cognitive screening tests is a strong assumption in this analysis, thus it is hard to check the validity [23]. In reality, the cognitive screening tests results may be correlated due to common items in scales. In this study, we did not consider the conditional dependence among test results. Further studies need to assess the performance of tests without a gold standard when the results of cognitive screening tests have conditional dependence.
De Roeck et al. [101] reported that MoCA is a promising screening tool, but the specificity to detect the cognitive impairment of early AD is low. Ashford and Schmitt stated that MMSE provided a poor estimate of patient severity early in the AD time-course and late in the course due to ceiling and floor effects [102]. In this study, we did not conduct subgroup analysis of the severity of AD due to the limitations of data information. Hence, we could not verify the findings of the prior studies in which a screening test was suitable for the different stages of AD. Test items had better psychometric characteristics and were important to improve the measurement of severity and progression with respect to the time-course of AD [102]. Factor-structure items of the cognitive impairment were vital to identify the severity of AD based on a “time-index” model and item response theory [102, 103]. However, we focused on the overall accuracy of cognitive screening tests in this study. A further meta-analysis is needed to define the contribution of each item of cognitive screening tests in estimating the severity on the disability continuum of AD.
Moderate risk of bias occurred for index tests in methodological quality based on the QUADAS-2 criteria, as the sensitivity and specificity values we extracted corresponded to the optimal cut-off points in most studies. The heterogeneity among studies was large, likely because the collected results were from different versions of cognitive screening tests, and some of these tests were translated into many different languages, such as the Persian [12, 82], Georgian [11], Chinese [49], Sinhala [55], Korean [42], Brazilian [13], Iranian [77], and Greek [69, 83]. We also included a telephone version MMSE, which was strongly correlated with the in-person MMSE [66]. Computerized assessments have also been created to assess cognition or memory in recent years [104]. Moving from the MoCA to a computerized test and evaluating its screening accuracy are important issues in the detection of dementia associated with AD [61, 105]. Further studies are needed to address this new approach. Moreover, participants with different age or education levels in the included studies might also contribute to some levels of clinical heterogeneity. Furthermore, results of meta-regression suggested that publication year, number of patients, country or region, population type, average age of population, average education of population, and reference standard were also sources of heterogeneity. These seven dimensions were independently significantly associated with the accuracy of the two cognitive screening tests.
To make our findings more representative of participants recruited from around the world, we searched publications in English and Chinese from multiple source databases. We also comprehensively searched the original literatures and reference citations of reviews from each database so that the possibility of publication bias was relatively small, which is one strengths of this meta-analysis. Another strength is a large number of primary studies were included. Nonetheless, there were some limitations in this meta-analysis. First, heterogeneity between included studies was inevitable. We used meta-regression to discuss the sources of heterogeneity from a limited seven dimensions due to the little information from the primary studies. Second, this study did not consider the effect of potential covariates including age, sex, education, Apolipoprotein E (APOE) genotypes, and race on the accuracy of MoCA and MMSE in screening AD in the primary studies. Subgroup analysis on age and education of individuals showed certain influence of these two factors on sensitivity and specificity of MoCA and MMSE in screening AD. Third, this study did not conduct subgroup sensitivity analysis for the severity of AD, and the test items of MoCA and MMSE for the severity on the disability continuum of AD were not assessed due to insufficient data in primary studies. Our review only assessed the performance of the two cognitive screening tests in screening AD from MCI or HC but did not evaluate their classification ability in screening MCI from HC, or AD patients of different periods and dementia associated with other diseases. However, subgroup analysis was conducted to evaluate the accuracy of MoCA and MMSE in screening AD from different populations. Fourth, reliable biomarkers are essential to increase diagnostic accuracy, allowing for earlier diagnosis and better participant selection [22]. Therefore, it is possible that subjects with very mild impairment were misclassified as normal using MMSE and MoCA. However, we did not combine biomarker information to recheck these subjects due to insufficient data in the primary studies. This limitation might have affected the estimations of pooled sensitivity and specificity in screening AD.
Conclusions
In conclusion, the present study found that MoCA had a higher screening capacity in discriminating AD from MCI or HC. Moreover, MoCA was more useful to “rule-out” AD. Further studies with higher quality and lower heterogeneity are needed to confirm these findings.
Footnotes
ACKNOWLEDGMENTS
This study was funded by National Natural Science Foundation of China (Grant No. 81903408), and Young Core Personal Project & Beijing Outstanding Talent Training Project (2018000020124G136).
The funder/ sponsor had no role in the design and conduct of the study, collection, management, analysis, and interpretation of the data; preparation, review, or approval of the manuscript; and decision to submit the manuscript for publication.
We thank Professor Henry Xiang, MD, MPH, PhD, MBA at the Ohio State University College of Medicine and Mrs. Megan Armstrong at the Abigail Research at Nationwide Children’s Hospital, Ohio, USA for editing the final version of the manuscript.