
Abstract
Background:
The Tg4-42 mouse model for sporadic Alzheimer’s disease (AD) has unique features, as the neuronal expression of wild type N-truncated Aβ4–42 induces an AD-typical neurological phenotype in the absence of plaques. It is one of the few models developing neuron death in the CA1 region of the hippocampus. As such, it could serve as a powerful tool for preclinical drug testing and identification of the underlying molecular pathways that drive the pathology of AD.
Objective:
The aim of this study was to use a differential co-expression analysis approach for analyzing a small RNA sequencing dataset from a well-established murine model in order to identify potentially new players in the etiology of AD.
Methods:
To investigate small nucleolar RNAs in the hippocampus of Tg4-42 mice, we used RNA-Seq data from this particular tissue and, instead of analyzing the data at single gene level, employed differential co-expression analysis, which takes the comparison to gene pair level and thus affords a new angle to the interpretation of these data.
Results:
We identified two clusters of differentially correlated small RNAs, including Snord55, Snord57, Snord49a, Snord12, Snord38a, Snord99, Snord87, Mir1981, Mir106b, Mir30d, Mir598, and Mir99b. Interestingly, some of them have been reported to be functionally relevant in AD pathogenesis, as AD biomarkers, regulating tau phosphorylation, TGF-β receptor function or Aβ metabolism.
Conclusion:
The majority of snoRNAs for which our results suggest a potential role in the etiology of AD were so far not conspicuously implicated in the context of AD pathogenesis and could thus point towards interesting new avenues of research in this field.
INTRODUCTION
While an increasingly large number of studies are focusing on miRNAs and their putative involvement in the etiology of Alzheimer’s disease (AD) and/or their potential as biomarkers for AD (reviewed in [1–5]), almost nothing is known about small nucleolar RNAs (snoRNAs) in this context. These are small RNA molecules of 60–300 nucleotides in length, predominantly found in the nucleolus, which play a role in the posttranscriptional modification of other RNAs, e.g., ribosomal RNAs. Most snoRNAs belong to either the group of box C/D snoRNAs or box H/ACA snoRNAs (reviewed in [6]). These groups are defined by conserved signature-sequence elements and characteristic secondary structures [7, 8]. C/D as well as H/ACA RNAs are important for protein translation, rRNA acetylation, mRNA abundance, splicing as well as translational efficiency, genome stability, and/or other cellular processes [9]. While H/ACA RNAs are involved in pseudo-uridinylation or the conversion of uridine to pseudo-uridine, C/D RNAs predominantly mediate 2′-O-ribose methylation [10].
In this study, we investigated small RNA NGS data of the hippocampi of Tg4-42 mice [11], specifically focusing on snoRNAs. The Tg4-42 mouse line is one of only few mouse models developing an AD-typical neurological phenotype starting with synaptic hyperexcitability [12–14] and loss of glucose metabolism [15] followed by behavioral deficits, severe neuron loss, gliosis, and metabolic changes of the glutamate/4-aminobutyrate-glutamine axis [14, 16–18]. It is well established that N-truncated Aβ4–42 is highly abundant in the brain of AD patients [19, 20] and even represents a major species in plaques of affected individuals [21, 22]. Previously, we have compared the transcriptomes of the 5XFAD model, which shows early plaque formation, intraneuronal Aβ aggregation, neuron loss, and behavioral deficits [23], and the Tg4-42 model with intraneuronal N-truncated Aβ4–42 accumulation, neuron loss as well as behavioral deficits, without plaque formation [24]. Using deep sequencing, differentially expressed genes (DEGS) were identified. While many DEGs were identified in 5XFAD or in Tg4-42 mice, 36 DEGs were found in both mouse models indicating common disease pathways associated with behavioral deficits and neuron loss [24].
While 5XFAD and all other commonly used murine models are associated with familial forms of AD, Tg4-42 mice express wild type N-truncated Aβ4–42 without any mutations under the control of the murine neuron-specific Thy1-promoter and are thusly ideal for modelling sporadic forms of AD. Therefore, in this study we opted for Tg4-42.
Using a differential co-expression analysis ap-proach, our aim was to identify differences in the networks of small RNAs between Tg-42 and wild type (WT) hippocampi, which could point to hitherto unknown molecular players in the pathogenesis of AD. Along with several miRNAs, this led to the identification of nine snoRNAs, which seem to play a role in the molecular basis of the AD phenotype and were hitherto not known to be involved in the etiology of this disorder.
MATERIALS AND METHODS
NGS-dataset of small RNAs in mouse hippocampus
In order to elucidate the influence of small RNAs involved in neuron loss and associated memory decline in AD, we used 3-month-old and 8-month-old Tg4-42 mice, which correspond to time points before and after onset of hippocampal neuron loss and memory deficits in the Tg4-42 model [14]. We based our analyses on our previously reported NGS-datasets of small RNAs [11] for eight WT and eight Tg4-42 mouse hippocampi, respectively. Each of the two groups (WT and Tg4-42) contained samples from four young (three months of age) and four aged (eight months of age) animals.
Differential expression analysis
During quality control of the mapped data, we excluded RNAs with less than 10 read-counts across all samples and collapsed technical replicates after heatmap inspection as previously reported [11]. In our previous work, we employed DESeq2 [25], that compares expression values of an individual gene at different conditions, where dysregulated miRNAs were determined by the level of log2 fold change and its significance after hypothesis testing. In this work, however, instead of single gene level analysis, we employed differential co-expression analysis with DGCA [26] that takes the comparison to the level of gene-gene pairs (see below). With that, we constructed a differential co-expression network where we assume that there are changes in the regulatory relationship between two connected small RNAs at different conditions and that they are likely to be regulated through the same mechanism or share similar functions. Dysregulated small RNAs are those with high centrality within the network that indicates its importance to the network integrity.
Differential co-expression and network analysis for miRNA and snoRNA
In order to establish a correlation network, we used DGCA, an R-package that performs differential correlation analysis for two conditions [26]. We carried out all possible comparisons with ddcorAll functions using Pearson correlation. DGCA calculates correlation coefficients for each small RNA pair and transforms them into z-scores while p-values are calculated by permutation. Pairs with an adjusted p-value < 0.05 (using the Benjamini-Hochberg method) and a differential z-score of more than three have been selected for further analyses.
With this approach, we compared the eight WT with the eight Tg4-42 samples, using a variance-stabilized expression matrix, containing both snoRNAs and miRNAs. A network was established using the z-score differential coefficient. We determined centrality values for each type of small RNAs with respect to the other type. That is, betweenness centrality reflects how many times a snoRNA is part of the shortest paths between all pairs of miRNAs in the network, and vice versa. We then performed a clustering analysis of centrality values using the Heatmap function in ComplexHeatmap [27], setting the row_km parameter at 2, thus splitting the heatmap in two clusters by k-means clustering [28].
Functional enrichment analysis of small RNAs
Small RNAs with a high centrality and their interaction partners were further analyzed using clusterProfiler R package [29]. clusterProfiler provides an interface for gene ontology [30] and pathway enrichment analysis such as KEGG [31]. It uses a hypergeometric model to test for enrichment of biological functions in a given gene list. Interaction information was extracted from the RNAInter database [32], which comprises RNA-associated interactions based on computational prediction and/or experimental validation as well as from other databases such as miRDB [33]. We extracted the potential RNA interactors of the small RNAs with prediction score higher than 0.7. This score is calculated based on experimental confidence (number of publications supported), scientific community confidence (number of citations of the supporting publications) and types of tissues/cells (number of tissue and cell types the interaction being observed in). For snoRNAs, snoDB was used to obtain a curated list of snoRNA interacting genes [34].
RESULTS
In order to find age-independent significant alterations between WT and Tg4-42 mice, we performed a differential correlation analysis comparing groups of eight WT and eight Tg4-42 individuals, which in each case comprised four young (three months of age) and four old (eight months of age) animals. We used a variance-stabilized expression matrix, containing both snoRNAs and miRNAs and generated a correlation network representation as shown in Fig. 1. The network consists of 68 gene pairs with significant correlations in at least one of the conditions (WT or Tg4-42) with a differential z-score, i.e. difference in correlation between the two conditions, higher than 3 or lower than –3.
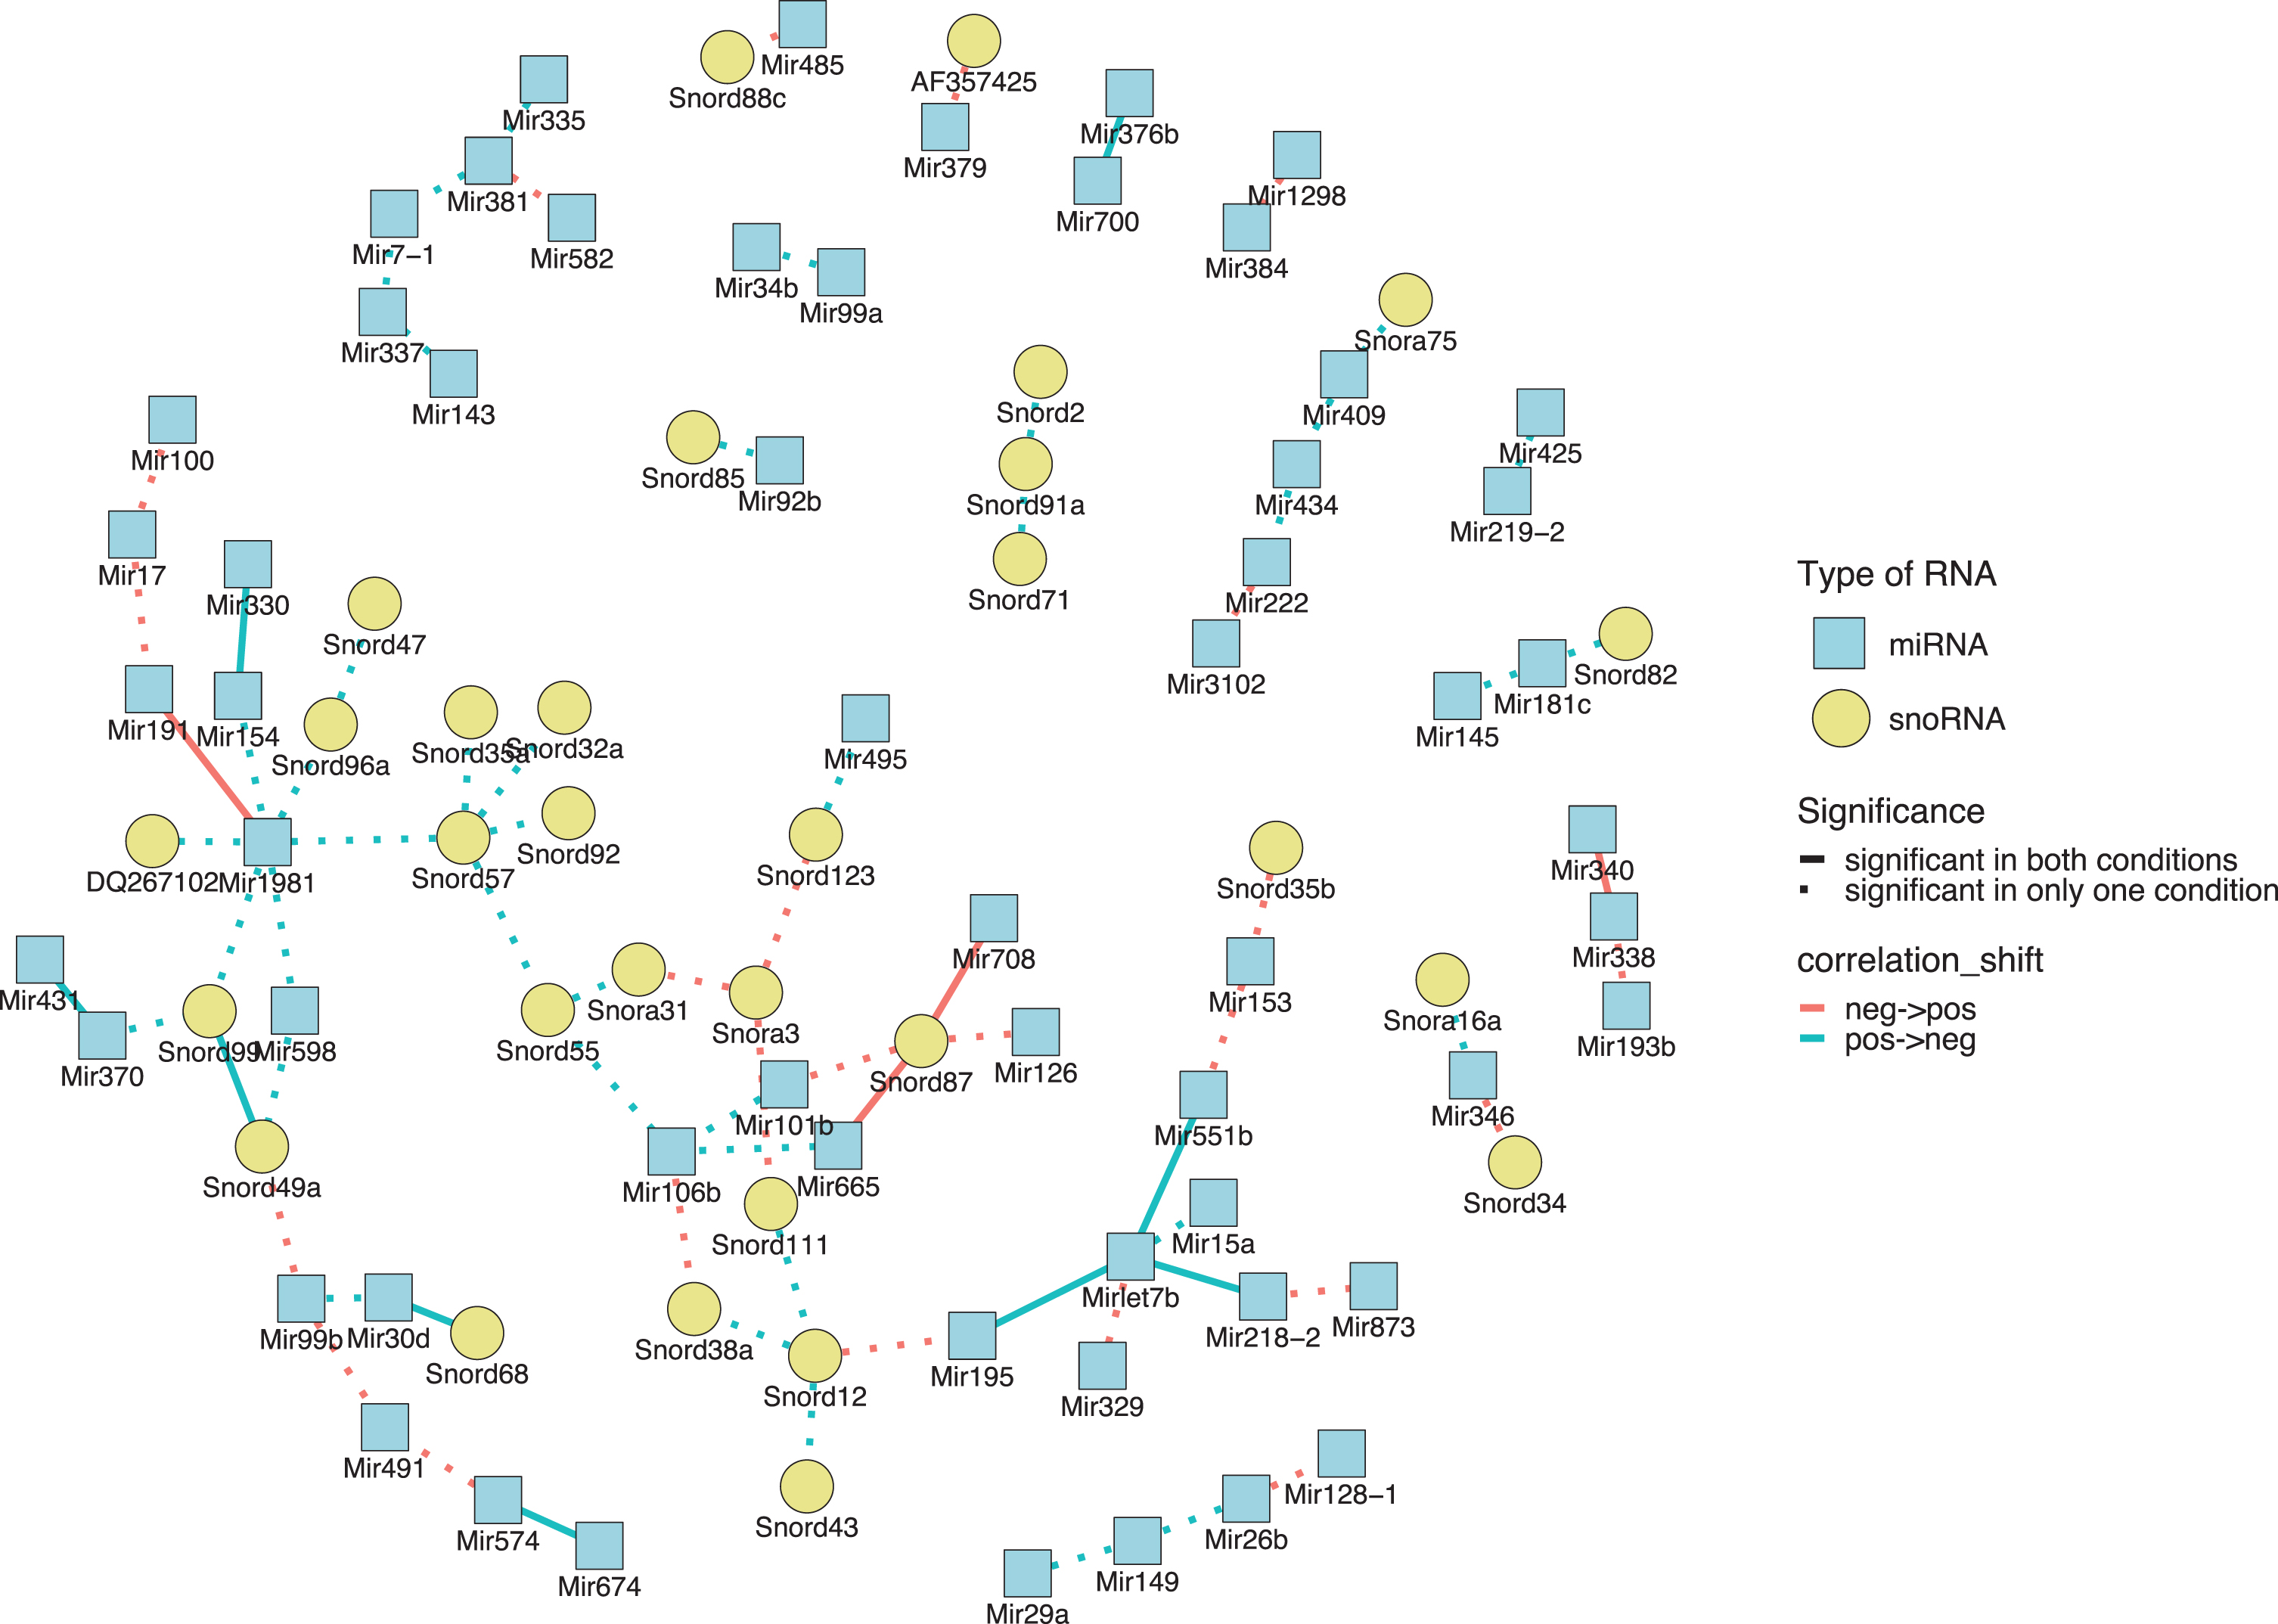
Correlation network of significantly differentially correlated gene pairs when comparing WT and Tg4-42 mice. The type of RNA is represented by the shape and color of the nodes: miRNAs are depicted as blue squares and snoRNAs as yellow circles. The type of correlation shift is represented by the color of the connecting lines: red indicates the shift from a negative correlation in WT to a positive correlation in Tg4-42, the opposite is indicated by blue connecting lines. Solid lines connect small RNA pairs that were found significant in both, WT and Tg4-42, dotted lines indicate significance in only one, WT or Tg4-42.
To identify similar regulation patterns, we then performed k-means clustering with all pairs of small RNA in the network and thus identified two clusters of small RNA pairs, based on a correlation shift between WT and Tg4-42. Cluster 1 comprises pairs with a shift from positive to negative correlation, while the pairs forming cluster 2 show the opposite behavior (Fig. 2; see Supplementary Table 1 for specific values).

Heatmap showing the 2 clusters of differentially correlated small RNAs. The yellow to blue color scale represents the degree of positive (blue) or negative (yellow) correlation between the pairs of small RNAs in WT (“WT_cor”) and Tg4-42 (“Tg4_cor”). The green shaded annotation column on the left denotes the centralities of the small RNAs in the corresponding positions on the right. Small RNAs with centrality > 0.1 (see also Table 1) are shown in boldface italics.
We also determined centrality values for the individual small RNAs included in our correlation network with respect to the other type of small RNAs (Supplementary Table 2 for miRNAs, Supplementary Table 3 for snoRNAs). By identifying all the shortest paths within one small RNA type and then counting how many times each node of another type falls on one path, this measure identifies small RNAs that can be seen to act as quasi bridges between small RNAs of the other type. As such, betweenness centrality values indicate the influence of a node on the interaction between other nodes in the network. In total we observed seven snoRNAs and five miRNAs with a centrality value higher than 0.1 (Table 1), and we could observe that 22 small RNA-pairs in Cluster 1 and nine pairs in Cluster 2 contain at least one partner with a high centrality (> 0.1), yet only in nine pairs from Cluster 1 and two from Cluster 2 both partners had a centrality above 0.1 (Fig. 2). Interestingly, the majority of these pairs (21 of 31) contain at least one snoRNA and, on average, the seven snoRNAs had a higher centrality as compared to the five miRNAs. Since the relatively high centrality values connected with individual RNAs point towards a more prominent functional role of these molecules in the investigated context, we performed a literature search focusing on all the small RNAs with a centrality higher than 0.1 that we observed in this study. This yielded results only for three miRNAs and one snoRNA (Table 1), so that to the best of our knowledge, with the exception of Snord49a, all other snoRNAs we describe here are hitherto completely unknown in the context of AD.
Interestingly, one miRNA (Mir1981) correlates significantly with five of the other small RNAs, four times highly positive in the hippocampi of WT and strongly negative in the hippocampi of Tg4-42 animals (Fig. 2). What is more, three of the negative correlations of Mir1981 in Tg4-42 mice involve small RNAs (Mir598, Snord57, Snord99) that showed centrality values, which were also comparatively high (Fig. 2, Table 1).
Another interesting observation we made among the small RNA pairs with low centrality values of both partners concerns pairs containing Mir222 (centrality 0) and Mir 346 (centrality 0.003). These show a flip between positive and negative correlation values, possibly depending on the differently correlated small RNA in the respective combinations (Fig. 2): Mir222-Mir3102, and Mir346-Snord34 show a correlation of nigh on –0.96 in WT and a correlation value of -0.06 in Tg4-42 animals, while Mir222 is positively correlated (0.68) with Mir434 in WT, yet negatively (–0.83) in Tg4-42 samples and the same can be seen for the correlation between Mir346 and Snora16a (correlation 0.94 in WT and –0.22 in Tg4-42).
Small RNAs with centrality > 0.1
Finally, we observed Mir181c (centrality 0), which shows a positive correlation of 0.27 with Mir145 yet a negative correlation of –0.33 with Snord82, both in Tg4-42 hippocampi (Fig. 2).
To learn more about the possible functional implications of our findings, we performed functional enrichment analyses on the identified small RNAs with high centrality values. This led to an enrichment (-log10[padjust] = 2.24697) of the GO terms “sensory perception of sound” and “sensory perception of mechanical stimulus” for Mir106b, Mir30d, and Mir99b). Since the number of snoRNA annotations is still quite limited, we expanded this analysis to the predicted target genes of the small RNAs. After filtering for a prediction score higher than 0.7 (see Methods section), a total of 376 potential interactors for miRNAs and 21 for snoRNAs were left (Supplementary Tables 4 and 5). These were submitted to GO enrichment analysis and KEGG pathway enrichment analysis. For the analysed miRNA-interactors, numerous GO terms were found to be enriched (see Supplementary Table 6) and the top 20 are shown in Fig. 3A. For snoRNA-interactors, no significant enrichments were observed. In Fig. 3B, the results for KEGG pathway enrichment are presented. Among all terms, “FoxO signaling pathway” is the most prominently enriched pathway for miRNA-interactors while “Glycosaminoglycan biosynthesis -heparan sulfate / heparin” is the only term enriched for snoRNA-interactors.

A) GO enrichment results for interactors of miRNAs with centrality > 0.1. B) KEGG pathway enrichment results for interactors of miRNAs and snoRNAs with centrality > 0.1.
DISCUSSION
The Tg4-42 mouse model does not fully recapitulate the pathology of AD (reviewed in [19]). The transgenic mouse model Tg4-42 expresses exclusively normal wildtype human Aβ4–42 sequence, predominantly in pyramidal neurons in the CA1 area of the hippocampus, associated with synaptic hyperexcitability, reactive micro- and astroglia, reduction in glucose metabolism is detected by 18F-PET/MRI, loss of degenerating CA1 pyramidal neurons, and loss of spatial reference memory [13–15]. However, no plaques and neurofibrillary tangles are observed.
Using the large numbers of differentially expressed small RNAs between WT and Tg4-42 hippocampi in a network analysis (Fig. 1), we observed pairs of small RNAs with a pronounced AD-specific shift in correlation. Such pairs comprised one or two partners with a high centrality in the network (Fig. 2, Table 1), suggesting a more prominent role in the genesis of the Tg4-42 AD-related phenotype.
We have previously shown that CA1 neurons in the hippocampus, not other cell types like interneurons, microglia or astroglia, express Aβ4–42 [14]. Therefore, all observed changes in small RNA expression are a consequence of neuronal Aβ4–42 activity.
A synopsis of what is already known about those small RNAs for which previous AD related findings are available (Table 1) is given in Fig. 4. Mir30b [11] and Mir598 [35] have previously been discussed as potential biomarkers for AD. Functional implications are known for Mir99b and Mir106b. For Mir99b, Ye et al. found that miR-99b-5p affects neuron survival by targeting mTOR and suggested a dynamic change of miR-99b-5p levels during Aβ-associated AD pathogenesis [36].
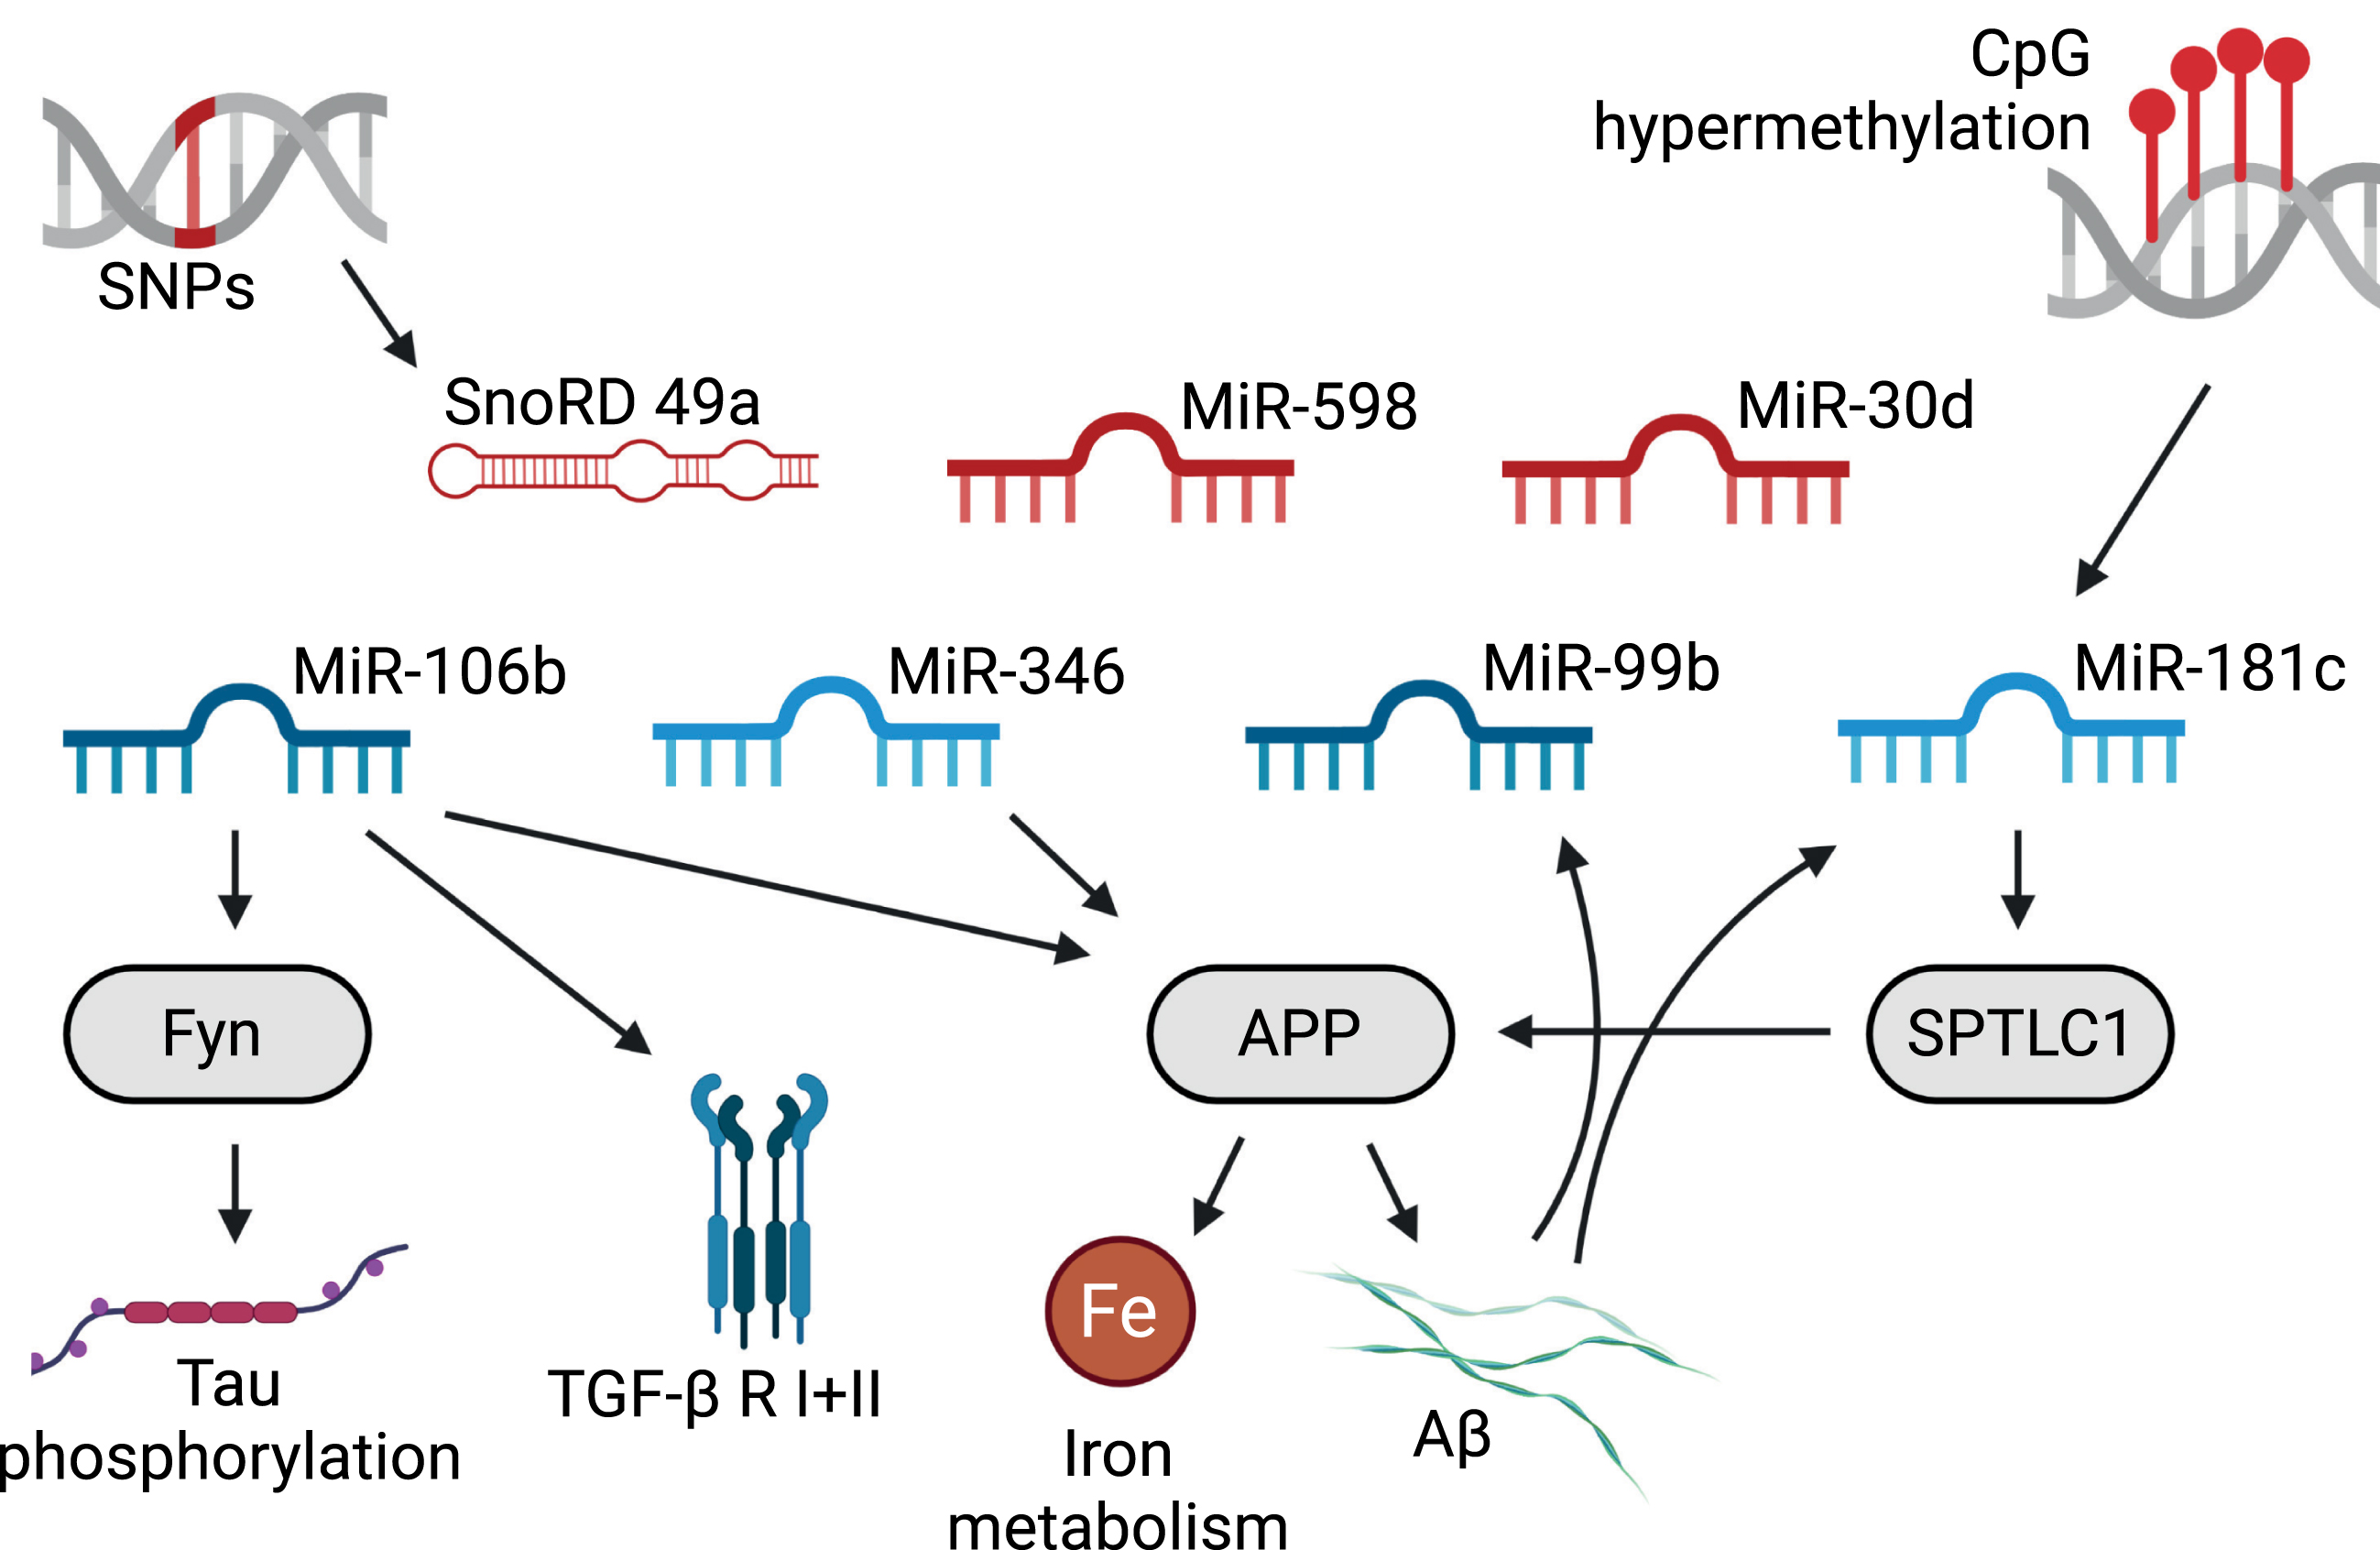
Literature based snoRNA/mirRNA associations with AD-pathogenesis. Red RNAs are discussed as AD biomarkers, light blue RNAs have low centrality values. Created with BioRender.com.
For Mir106b, Liu et al. report data that suggest that miR-106b has an inhibitory effect on Aβ1–42-induced tau phosphorylation by targeting Fyn [37]. Moreover, it is surmised to be involved in the regulation of APP expression in neuronal cell lines [38] and was found to target TβR II and thus may possibly have an influence on TGF-β signaling [39], for which a key role in the etiology of AD has long been suggested [40–42].
Mir346 was shown to play a role in the upregulation of APP in the brain and to participate in maintaining APP-related regulation of Fe homeostasis [43], which is disrupted in AD (see [44]).
Mir181 seems to be downregulated by Aβ in hippocampal cultures [45] and has been found to show altered expression in AD patients or mice [2, 46] and its inhibition rescues memory deficits in a murine AD model [47].
Interestingly, Mir1981, which correlates significantly with five of the other small RNAs, four times highly positive in the hippocampi of WT and strongly negative in those of Tg4-42 animals (Fig. 2), has so far not been implicated in the pathogenesis of AD. It has, however, been found to belong to a group of noncanonical miRNAs that are highly expressed in the brain and for which a functional role in post-mitotic neurons has been suggested [48]. Mmu-Mir1981 was also found upregulated after alcohol treatment of TLR4 knockout mice in a study of alcohol-induced neuroinflammation [49] and the critical involvement of neuroinflammatory processes in the pathogenesis of AD has long been discussed [50–52].
The only snoRNA for which previous observations provide a link to AD is Snord49a, where genome-wide significant associations between risk variants and AD have been observed [53]. Some of the others have so far only surfaced in cancer related investigations. Snord87, for example, was observed to be upregulated in hepatocellular carcinoma [54] whereas Snord55, was found to be decreased in tumor-educated platelets from patients with non-small cell lung cancer [55] and Snord12 has been shown to be associated with the survival of patients with uveal melanoma and to be part of a four-snoRNA signature for survival prediction [56]. Still, the findings pertaining to Snord55 and Snord12 are in keeping with the general observation of an inverse association between cancer and AD (for review, see [57, 58]). Interestingly, piRNA-54265, a fragment of Snord57, is being discussed as a biomarker for colorectal cancer [59]. Snord57 was also found in our analysis and if one were to assume that full-length Snord57 has a protective effect, the observation that Snord57 fragments are elevated in cancer patients could also be in agreement with an inverse correlation between AD and cancer.
With respect to Snord38A or Snord99, our literature search did also not yield conclusive evidence as to an involvement in human brain disorders, yet also little else pointing to an involvement in other diseases, seems to be known.
Still, taken together, the majority (4 out of 5) of miRNAs we found, as well as one snoRNA have already been implicated in the molecular basis of AD (see Table 1, Fig. 4). This provides substantial support for our conclusion that the small RNAs with high centrality values in our analysis are indeed involved in cellular processes that play a role in the pathogenesis of AD. Moreover, it strongly underpins the likelihood of the involvement of the six snoRNAs and one miRNA that were previously not observed in connection with AD.
All observed changes in small RNA differences are a consequence of the Aβ4–42 driven pathology in the Tg4-42 mouse model, representing downstream events. The intention of the current work was to identify small RNA changes in response to the toxic effect of Aβ4–42 in mouse brain.
Our GO-analysis points to an involvement of Mir106b, Mir30d, and Mir99b in “sensory perception of sound” and “sensory perception of mechanical stimulus”. This is interesting, as sensory impairments are part of the clinical spectrum of AD and are even being discussed as early disease markers (e.g., [60, 61]).
With respect to the putative interactors of the small RNAs we identified here, GO-analysis shows no enrichment for snoRNAs, which might be owed to the fact that still much less is known about snoRNAs as compared to miRNAs. For the miRNAs from our study the most prominent enriched GO terms by far were “positive regulation of cellular catabolic process” and “positive regulation of catabolic process”. This is of note as various catabolic processes have been found to play a role in AD aetiology and progression, such as tau catabolism (e.g., [62]) or Aβ catabolism (e.g., [63, 64]).
Our KEGG pathway analysis revealed the “FoxO signaling pathway” as the most prominently enriched pathway for miRNA interactors. Forkhead box O (FoxO) transcription factors play a role in diverse biological processes, such as cell metabolism, cell proliferation, DNA repair, autophagy, the reaction to oxidative stress, etc. (e.g., [65, 66]). More importantly, however, there is a considerable body of evidence pointing to their crucial involvement in the aetiology of age-related diseases including AD (e.g., [67–71]).
Also, the “MAPK signaling pathway” features prominently among the results of this analysis. This is noteworthy, since MAPKs are being discussed as therapeutic targets for neurodegenerative disorders for quite some time (e.g., [72, 73]). Moreover, p38 MAPK has been found to be activated at early stages of AD [74] and it was recently shown that p38 MAPK-mediated loss of nuclear RNase III enzyme Drosha underlies Aβ-induced neuronal stress in AD [75].
We found only “Glycosaminoglycan biosynthesis -heparan sulfate/heparin” enriched for snoRNA interaction partners. Still, glycosaminoglycan is known to be involved in the pathogenesis of AD by contributing to the formation of amyloid fibrils [76] so that this finding supports a link between the snoRNAs we describe and AD.
Taken together, the results of the NGS-analysis of the hippocampi of Tg4-42 mice which we present here add further evidence for Aβ-driven down-stream molecular profiles. Of note, as the model does not generate amyloid plaques, we found evidence that soluble Aβ4–42 expressed in the Tg4-42 mouse model triggers specific AD pathways known to be involved in tau-phosphorylation, TGF-β signaling and Aβ biology. This observation supports the current discussion in the AD field, that soluble amyloid peptides are instrumental in AD etiology and that tau pathology is triggered by Aβ toxicity. Moreover, we provide evidence for a functional role of snoRNAs in AD pathogenesis beyond the implication as biomarkers, which opens up new avenues of research in this context, for example the elucidation of how exactly the small RNAs resulting from our study are involved in the AD-typical neurological phenotype as presented by the Tg4-42 animals.
Footnotes
ACKNOWLEDGMENTS
This work was supported by the German Federal Ministry of Education and Research (BMBF) within the framework of the e:Med research and funding concept (grant 01ZX1908A). We thank Robert Weissmann and Stefan Weiss for bioinformatics support in primary data analysis and Corina Jensen and Christian Sperling for excellent technical assistance.