
Abstract
Background:
There is an urgent need for noninvasive, cost-effective biomarkers for Alzheimer’s disease (AD), such as blood-based biomarkers. They will not only support the clinical diagnosis of dementia but also allow for timely pharmacological and nonpharmacological interventions and evaluations.
Objective:
To identify and validate a novel blood-based microRNA biomarker for dementia of the Alzheimer’s type (DAT).
Methods:
We conducted microRNA sequencing using peripheral blood mononuclear cells isolated from a discovery cohort and validated the identified miRNAs in an independent cohort and AD postmortem tissues. miRNA correlations with AD pathology and AD clinical-radiological imaging were conducted. We also performed bioinformatics and cell-based assay to identify miRNA target genes.
Results:
We found that miR-150-5p expression was significantly upregulated in DAT compared to mild cognitive impairment and healthy subjects. Upregulation of miR-150-5p was observed in AD hippocampus. We further found that higher miR-150-5p levels were correlated with the clinical measures of DAT, including lower global cognitive scores, lower CSF Aβ42, and higher CSF total tau. Interestingly, we observed that higher miR-150-5p levels were associated with MRI brain volumes within the default mode and executive control networks, two key networks implicated in AD. Furthermore, pathway analysis identified the targets of miR-150-5p to be enriched in the Wnt signaling pathway, including programmed cell death 4 (PDCD4). We found that PDCD4 was downregulated in DAT blood and was downregulated by miR-150-5p at both the transcriptional and protein levels
Conclusion:
Our findings demonstrated that miR-150-5p is a promising clinical blood-based biomarker for DAT
INTRODUCTION
The advancement of biomarker research in Alzheimer’s disease (AD) has shifted the diagnosis of AD from a clinical syndrome to a biological construct [1]. However, the current AD biomarkers, such as cerebrospinal fluid (CSF) amyloid-β 1-42 (Aβ42) and phosphorylated tau, as well as amyloid and tau positron emission tomography (PET), are limited by either their invasiveness or cost and hence are available only in a very few academic centers [2–4]. As such, it is imperative to develop a noninvasive and inexpensive blood-based biomarker that is specific for AD pathophysiology for clinical applications in detecting AD in the general population.
microRNAs (miRNAs) are small, conserved noncoding RNAs that modulate posttranscriptional gene expression by suppressing specific target miRNAs [5, 6]. miRNAs play vital roles in the body’s essential processes, including cell proliferation, cell development, and stress responses. In the nervous system, miRNAs are widespread and regulate key functions such as neurite outgrowth, dendritic spine morphology, neuronal differentiation, and synaptic plasticity [7, 8]. There has been increasing research interest in the relationship between miRNAs and neurocognitive disorders following the discovery of miRNA dysregulation in neurocognitive disorders. Specifically, miRNA dysfunction has been shown in mild cognitive impairment (MCI) and AD, although they lack direct correlations with the clinical phenotypes [9–13]. It has been shown that dysregulation of miRNAs in AD affects Aβ42 and phosphorylated tau production and increases oxidative stress and neuroinflammation [14, 15].
CSF is an ideal source of circulating miRNA biomarkers due to its proximity to the brain [16]. However, extracting CSF from the lumbar region (lumbar puncture) is relatively invasive and may cause surgical trauma [17]. In addition, lumbar puncture is expensive and not available in all clinical settings. Some of these limitations can be overcome by blood-based biomarkers, such as whole blood, plasma, serum, or peripheral blood mononuclear cells (PBMCs). Blood miRNAs could be readily accessible biomarkers obtained using minimally invasive procedures and are inexpensive for mass screening of aging populations [18–20]. A recent systematic review including 20 studies reported 102 dysregulated miRNAs in the peripheral blood of AD patients were potential biomarkers of AD [21]. With respect to miRNA dysregulation in human AD brain tissues, the same review reported the identification of 250 miRNAs from 27 studies. When cross-referencing the miRNAs from peripheral blood and human AD brain tissues, 47 common miRNAs were found, among which 30 miRNAs were dysregulated in brain tissue with known Braak Stages. Among these 30 miRNAs, 10 were observed to be dysregulated during Braak Stage III, and their expression levels in the peripheral blood and the brain were correlated with each other (miR-30e, miR-34c, miR-107, miR-200c, miR-210, and miR-485), while others had opposing levels (miR-26b, miR-34a, miR-125b, and miR-146a) (see [21]).
Taken together, miRNAs have the potential for being incorporated into clinical practice for the diagnosis of AD and for monitoring patients receiving preventive and therapeutic interventions. However, additional studies need to be devoted to identifying correlations with the currently validated AD biomarkers to establish whether a particular miRNA can be considered a promising biomarker of AD. However, reliable miRNA-based tests to complement and support the clinical diagnosis of AD are lacking. Therefore, studies focusing on the correlations of miRNAs with current AD biomarkers are vital.
In this study, we used PBMC as a source of miRNA because 1) PBMC is a major cellular component to the blood, 2) they circulate stably in the bloodstream and can infiltrate the blood-brain barrier (BBB), 3) they can be obtained using a minimally invasive procedure, 4) their low cost, 5) their low risk of being contaminated when compared to miRNAs extracted from other body fluids, 6) their ability to respond to external and internal stimuli, and 7) they store information at the epigenetic levels [22–24]. Here, in a discovery study involving an independent cohort of individuals with dementia of the Alzheimer’s type (DAT), MCI, and healthy individuals (HS), we profiled the expression of PBMC-derived miRNAs using high-throughput miRNA-seq. We aimed to identify and validate miRNAs that are dysregulated in DAT. We further correlated the miRNA with AD clinical biomarkers and studied their target genes in biological pathways.
MATERIALS AND METHODS
Study participants
Participants with mild DAT and MCI were recruited from a tertiary neurology center (National Neuroscience Institute, Singapore) while HS were recruited from the community between 2015–2018. The diagnoses of DAT and MCI were made using the NIA-AA criteria [2, 18] and supported by a Clinical Dementia Rating [25] (CDR) score of 1 and 0.5 respectively. DAT participants were in the mild stage of dementia as reflected by the CDR score of 1 and Mini-Mental State Examination (MMSE) [26], as well as Montreal Cognitive Assessment (MoCA) [27] scores being in the mild impairment range. All individuals received a consensus diagnosis from a panel comprising cognitive neurologists, psychologists, and specialist nurses. Key exclusion criteria included serious neurological or psychiatric comorbidities, diagnosis of dementia with Lewy bodies, vascular dementia and frontotemporal dementia as well as a history of alcohol or drug abuse.
The medical history and demographic characteristics of the study participants were collected via a standardized interview. Study participants underwent a standardized assessment of their global cognition using the MMSE [26] and MoCA [27], blood test, lumbar puncture for CSF analysis [28], and a 3T-MRI scan within six months of clinical and neuropsychological evaluations. The study was approved by the SingHealth Centralized Review Board and adhered to the tenets of the Declaration of Helsinki and local clinical research regulations. A signed informed consent was also obtained from each patient.
The discovery cohort (Table 1) and independent cohort (Table 2) used similar sample sizes for each of the diagnosis groups, i.e., HS, subjects with MCI, and subjects with DAT. The diagnoses for both cohorts were made using NIA-AA criteria [2, 18]. In addition, both the discovery and independent cohorts’ average age at diagnosis are between 55 and 65 years old, which showed similar age profile. Both the discovery and the independent cohorts comprised young and old subjects, but the independent cohort included subjects from a grant investigating young onset dementia. Thus, this cohort had CSF markers of dementia. As part of the grant, these patients were largely below 65 years old from preclinical early to later stages of dementia, particularly those with DAT. The aim was thus to use this cohort with dementia biomarkers to in turn help us find novel miRNA markers for biomarker confirmed AD. As such, the independent cohort is a rare cohort within Southeast Asia which has CSF biomarkers and was thus essential as a validation cohort to assess the potential of the miRNA candidates. On the other hand, the discovery cohort was a clinical cohort having young and old patients but lacked biomarkers. Thus, we used an independent cohort to assess the correlation between miRNAs obtained from the discovery cohort with AD biomarkers and examined their validity as AD-specific markers through associations with the well-established CSF clinical biomarkers. Despite these differences, both the discovery and independent cohorts were clinically diagnosed and were matched on disease stage and severity as much as possible.
Characteristics of discovery cohort
Characteristics of discovery cohort
Values are represented as mean±SD or number (%). Demographic characteristics were compared between disease group using the χ2 test for gender, and Kruskal-Wallis with Dunn’s test for numerical variables. ***p < 0.001 for DAT versus HS; †p < 0.05 for DAT versus MCI; #p < 0.05 for MCI versus HS. HS, healthy subjects; MCI, mild cognitive impairment; DAT, dementia of the Alzheimer’s type; MMSE, Mini-Mental State Examination; MoCA, Montreal Cognitive Assessment.
Characteristics of an independent cohort
Values are represented as mean±SD or number (%). Demographic characteristics were compared between disease group using the χ2 test for gender, and Kruskal-Wallis with Dunn’s test for numerical variables. *p < 0.05, **p < 0.01, ***p < 0.001 for DAT versus HS; †††p < 0.001 for DAT versus MCI. HS, healthy subjects; MCI, mild cognitive impairment; DAT, dementia of the Alzheimer’s type; MMSE, Mini-Mental State Examination; MoCA, Montreal Cognitive Assessment; ns, not significant.
Human postmortem AD hippocampus subjects
We obtained sporadic AD and control postmortem samples from Bryan Alzheimer’s Disease Research Center (Bryan ADRC), Duke University. The postmortem study was approved by the SingHealth IRB Committee. The methods were carried out in accordance with the approved guidelines and regulations.
microRNA extraction and sequencing
Extraction of PBMCs from whole blood was performed as described by Maes et al. [29] with slight modification. Whole blood in EDTA vacutainers was centrifuged at 500× g for 10 min at 4°C. Upper layer of plasma was separated. The remaining blood were immediately mixed with equal volume of cold 1x PBS, stratified onto 1.5-fold of Ficoll-Paque Plus (Amersham Biosciences) and centrifuged at 400× g for 30 min at 4°C. After centrifugation, the interphase layer containing the PBMCs was transferred to a new 15 ml centrifuge tube, washed in 3-fold of cold 1x PBS at 500× g for 10 min at 4°C. Two wash steps were performed before resuspending cell pellets in QIAzol Lysis Reagent (Qiagen) and stored at –80°C until further use. Total RNAs including miRNA was extracted from PBMCs using miRNeasy Mini Kit (Qiagen) following manufacturer’s instructions. Concentration and quality of extracted RNAs were measured using NanoDrop1500 (Thermo Fisher Scientific). RNA integrity number (RIN) of RNAs was assessed by Bioanalyser, where RNA samples with RIN ≥8.0 and RNA ration [28s/18s]: ≥1.5 were used for library preparation and miRNA-seq.
The small RNA libraries were prepared by Beijing Genomics Institute (BGI) using the TruSeq small RNA kit (Illumina). During this analysis, all the runs were considered as independent. The sequences were assessed for quality using FASTQC. The Primer, adapter and contaminant sequences were removed using Cutadapt/TRIMMOMATIC. Read lengths shorter than 15 nucleotides were removed. The cleaned sequences were collapsed using the FastX-toolKit (fastx collapser) and reduced to unique reads. The subsequent file was processed using miRDEEP2 pipeline. The reads were mapped to the human genome (hg19) and precursor miRNA sequences for miRbase version 21. The final output of the count file summarizing the mapped miRNAs for each sample was used for further analysis.
Differentially expressed miRNAs were validated using Taqman MicroRNA Assays (Applied Biosystem). Each Assay contains miRNA-specific Taqman minor groove binder probe and PCR primers for hsa-miR-150-5p, hsa-miR-150-3p, hsa-miR-328-3p, and hsa-miR-7706 and along with U6 small nuclear RNA (U6) which served as a reference control for miRNA expression normalization. miRNA expression changes were calculated relative to U6 using the 2-ΔΔCt method.
MRI image acquisition and pre-processing
High resolution T1-weighted MPRAGE (Magnetization Prepared Rapid Gradient Echo) sequences performed on a 3T Prisma Fit System (Siemens, Erlangen, Germany) were obtained as follow: 192 continuous sagittal slices, TR/TE/TI = 2300/2.28/900 ms, flip angle = 8°, FOV = 256 × 240 mm2, matrix = 256 × 240, isotropic voxel size = 1.0 × 1.0 × 1.0 mm3, bandwidth = 200 Hz/pixel. We used the Computational Anatomy Toolbox (https://dbm.neuro.uni-jena.de/cat12/) protocol in Statistical Parametric Mapping (SPM12) (https://www.fil.ion.ucl.ac.uk/spm/), to process the T1 images for voxel-based morphometry (VBM) analysis. Specifically, all 3D T1-weighted MRI scans were normalized using an affine transformation followed by non-linear registration, corrected for bias field inhomogeneity. Images were then segmented to derive subject-level grey matter (GM) [30], white matter (WM), and CSF components [31]. The Diffeomorphic Anatomic Registration Through Exponentiated Lie algebra algorithm (DARTEL) was used to normalize the segmented scans into the standard MNI space which provides better precision in spatial normalization to the template [32]. All obtained segmented, modulated, and normalized GM and WM images were then smoothed using an 8-mm full-width-half-maximum isotropic Gaussian smoothing kernel.
MRI regions of interest derivation
We also applied multiple seed-based approaches to test the association between grey matter volume (GMV) and miRNA levels specifically in regions of interest (ROIs) belonging to the default mode network (DMN) and executive control network (ECN). We selected nine ROIs covering the DMN and ECN based on a prior study [33]. The DMN ROIs included the left and right parahippocampal cortex, medial prefrontal cortex, posterior cingulate cortex, and precuneus and the ECN ROIs included the left and right dorsolateral prefrontal cortex and the left and right posterior parietal cortex in standard space. Average GMV from these network ROIs was derived using the MarsBar toolbox in SPM12. Following derivation of miRNA levels, a median split analysis was carried out for each of the miRNAs. A binary assignment was formulated with participants less than the median level of miRNA levels were assigned as “0” and those with greater than median levels of miRNAs were assigned “1”.
CSF processing for Aβ42 and tau measurement
CSF was collected via lumbar puncture then centrifuged at 2000× g for 10 min at 4°C. The resulting supernatant was aliquoted and stored at –80°C until further analysis. CSF levels of Aβ42, total tau, and phospho-tau (T181) were measured using the INNOTEST® (Fujirebio Europe NV) according to the manufacturer’s instructions [34]. A standard protocol for collection of CSF and measurement of Aβ42, total tau, and phospho-tau (T181) was used for all participants.
Plasmid constructs
pmirGLO-PDCD4-3′UTR: A 1,236 bp DNA fragment was amplified from human PDCD4 cDNA (NCBI reference number: NM_014456.5) 3′UTR region containing four miR-150-5p predictive binding sites using primer set: 5′-CTA GCTAGCATGTTGGCTGCTGCTGTTGAGATAC-3′ and 5′-ACGGTCGACTGCCTCCCAGGTTCAAG CAATTCT-3′. The purified DNA fragment was then digested with NheI and SalI restriction enzymes and inserted into the pmirGLO vector (Promega) [12, 13]. The sequence of formed plasmid was confirmed by Sanger sequencing.
Luciferase assay
Human embryonic kidney (HEK)293T cells were cultured in 6-well plates prior transfection. Cells were cotransfected with PDCD4 3′UTR plasmid and miR-150-5p mimic or scramble control using lipofectamine 2000 (Invitrogen) according to manufacturer’s protocol. Cells were harvested 48 hours post transfection and subjected to measure respective luciferase activity with the Dual Luciferase Reporter Assay Kit (Promega) by using a GloMAX 20/20 luminometer (Promega).
mRNA reverse transcription and RT-qPCR
Total mRNAs were reverse-transcribed by iScriptTM cDNA Synthesis kit (Bio-rad) and generated cDNA was subjected to RT-qPCR using All in OneTM qPCR Mix (Genecopoeia). β-actin was used as a reference gene for mRNA expression normalization. Relative expression of the genes was calculated using the 2–ΔΔCT method relative to values of β-actin. The sequences of primers were listed in Supplementary Table 1.
Western blot analysis
Proteins were extracted from cells using RIPA lysis buffer supplemented with protease inhibitor cocktail (MedChemExpress) and phosphatase inhibitor cocktail (MedChemExpress). Protein concentrations were measured using RC-DC protein assay kit II (Bio-Rad). 20μg of protein lysates were separated by SDS-PAGE and then transferred to polyvinylidene fluoride membrane (PVDF membrane, Millipore). The membranes were blocked with 5% milk in Tris buffered saline with tween 20 (TBST) for 1 h at room temperature and incubated with a 1:1000 dilution of primary antibodies (rabbit anti-PDCD4, Merck; mouse anti-β-actin, Santa Cruz) at 4°C overnight. The membranes were then washed with TBST, followed by incubation of horseradish peroxidase-conjugated secondary antibody (1:3000, GE Healthcare). Protein bands were visualized by Pierce ECL Western Blotting Substrate (Thermofisher Scientific). Band intensity was quantified using ImageJ software.
Statistical analysis
Statistical analysis for evaluation and correlation
Evaluation of miRNA, mRNA and protein expression levels, receiver operating characteristic (ROC) curves, and Pearson correlation were analyzed with GraphPad Prism 6.0. Differences between two groups were analyzed using Student’s t-test. One-way ANOVA with Tukey’s multiple comparisons test were used to compare multiple groups. For demographic characteristics, differences between groups were analyzed using the Chi-square (χ2) test for gender, and Kruskal-Wallis with Dunn’s test for numerical variables. Differences between the groups were considered statistically significant at p < 0.05.
Voxel-based morphometry and region of interest analyses
Group differences in GMV: To examine group differences, we built a voxel-wise Analysis of Covariates (ANCOVA) general linear model with GMV as the dependent variable, binary group membership as either below or above median miRNA levels with age and gender as nuisance covariates. The GM regions which showed significant group differences based on miRNA median split were examined using a threshold of Family-wise error (FWE) correction of p < 0.05 or an uncorrected p < 0.001 and a minimum cluster size of 100 voxels [35, 36]. For each ROI, the analysis was carried out first at the FWE-corrected level. If there were no clusters showing significance at the FWE-corrected threshold, then the analysis was carried out again at the uncorrected p < 0.001 (cluster-size threshold of 100 voxels). This is a well-published threshold for voxel-based morphometry that has been used by us and others [35–37]. Significant clusters in the GM were anatomically identified using the Automated Anatomical Labelling atlas labels.
Associations between DMN and executive control network ROI GMV and miRNA levels: Pearson’s correlation analysis was used to assess the association between ROI GMV and miRNA levels. Partial Pearson’s correlation analysis was used to assess the association between ROI GMV and miRNA levels after controlling for age at visit as a covariate. Multiple comparisons correction across the nine ROIs was conducted using FWE-correction at p < 0.0055.
Statistical analysis for bioinformatics
All the miRNAs with reading counts <50 summed up for all samples for each group (HS/MCI/DAT individuals) were removed. The read counts were normalized using Quantile Normalization or the raw file was analyzed for differentially regulated miRNA using DESEQ2 pipeline (TMM Normalization) or using SAMSEQ pipeline (Quantile Normalization) or Quantile normalized data. p-values were calculated using Wilcoxon-Mann-Whitney test. The adjusted p values (FDR) were calculated using Benjamini-Hochberg approach. For hierarchical classification and K means clustering approach e1701 and caret packages were used in R.
RESULTS
miRNA sequencing revealed an expression signature that distinguished DAT from MCI and HS
We performed HiSeq2000 microRNA sequencing (miRNA-seq) of the PBMCs from an age-matched discovery cohort of 19 HS, 16 MCI, and 19 DAT individuals (Table 1). A total of 956 mature miRNAs originating from 739 unique precursors met the expression cut-off (normalized read counts >50). These samples showed similar read count distributions for individual genes and were virtually identical after quantile normalization, confirming successful normalization. To determine distinctive miRNA signatures among the HS, MCI, and DAT subjects, we performed sample clustering analysis using the hierarchical clustering approach. Four distinct clusters of miRNA expression were observed, with DAT being enriched in one of them (p = 5.88E–05 by Fisher’s exact test) but none were enriched in MCI and HS (Fig. 1A). This indicates that there is a distinct miRNA expression signature that differentiates DAT from MCI and HS subjects.

miRNA-sequencing data analysis revealed DAT is distinct from MCI and healthy subjects. A) Hierarchical clustering analysis. HS, MCI, and DAT individuals from discovery cohort were labeled with blue, grey and red letters. The MC replicates sequenced on different lanes are marked by black rectangles, suggesting that the technical error was small. The dendrogram showed four clusters: blue, yellow, grey, and red lines. DAT were enriched in the group shaded by the red rectangle. Enrichment scores were computed by Fisher’s exact test. Volcano plots were drawn by plotting -log10 (FDR) against log2 (fold change) of each miRNA in comparison between (B) DAT and HS+MCI. Wilcoxon-Mann-Whitney (WMW) p-values with Benjamini-Hochberg adjustment were used as FDR. Differentially expressed genes at <15, 30% cutoffs were colored by blue and green. The expression difference is considered significant for a p-value of 0.05 [-log10 (FDR) of 1.3, dashed horizontal line]. Expression patterns of differentially expressed (C) miR-328-3p, (D) miR-7706, and (E) miR-150-5p. Dots represented individual expression values. Data shown as means±SD.
Volcano plot analysis further supported the conclusion from the clustering analysis that there was a distinct miRNA expression signature between DAT and HS and between DAT and MCI, while miRNA expression was indistinguishable between HS and MCI (Supplementary Figure 1). Specifically, when comparing DAT with HS+MCI, miR-328-3p, and miR-7706 were found to be downregulated in DAT, whereas miR-150-5p was found to be increased in DAT (Fig. 1B). Our findings suggested a distinct miRNA expression signature differentiating DAT from MCI and HS.
miR-150-5p expression is upregulated in DAT
To validate the results obtained from the miRNA-seq, we evaluated the miRNA signatures of miR-328, miR-7706, and miR-150-5p in an independent cohort comprising 16 HS, 27 MCI, and 21 DAT (Table 2) and found that the expression of miR-150-5p was significantly upregulated by 76.9% in DAT compared to HS and by 73.3% compared to MCI individuals (Fig. 2A). This finding was consistent with earlier miRNA-seq data showing that there was a trend toward an increase in miR-150-5p in DAT (Fig. 1E). Whereas the changes in miR-328-3p and miR-7706 levels in miRNA-seq were not validated in the independent cohort (Supplementary Figure 2). We further used area under the ROC curve (AUC) analyses to evaluate the diagnostic accuracy of miR-150-5p in discriminating among the study cohorts. AUC analysis showed that miR-150-5p levels discriminated DAT from MCI and HS individuals with a good accuracy of AUC 0.86 (95% CI 0.76–0.96) and AUC 0.86 (95% CI 0.73–0.99), respectively (Fig. 2B). However, miR-150-5p levels did not discriminate MCI from HS individuals with an AUC of 0.53 (95% CI 0.33–0.72).
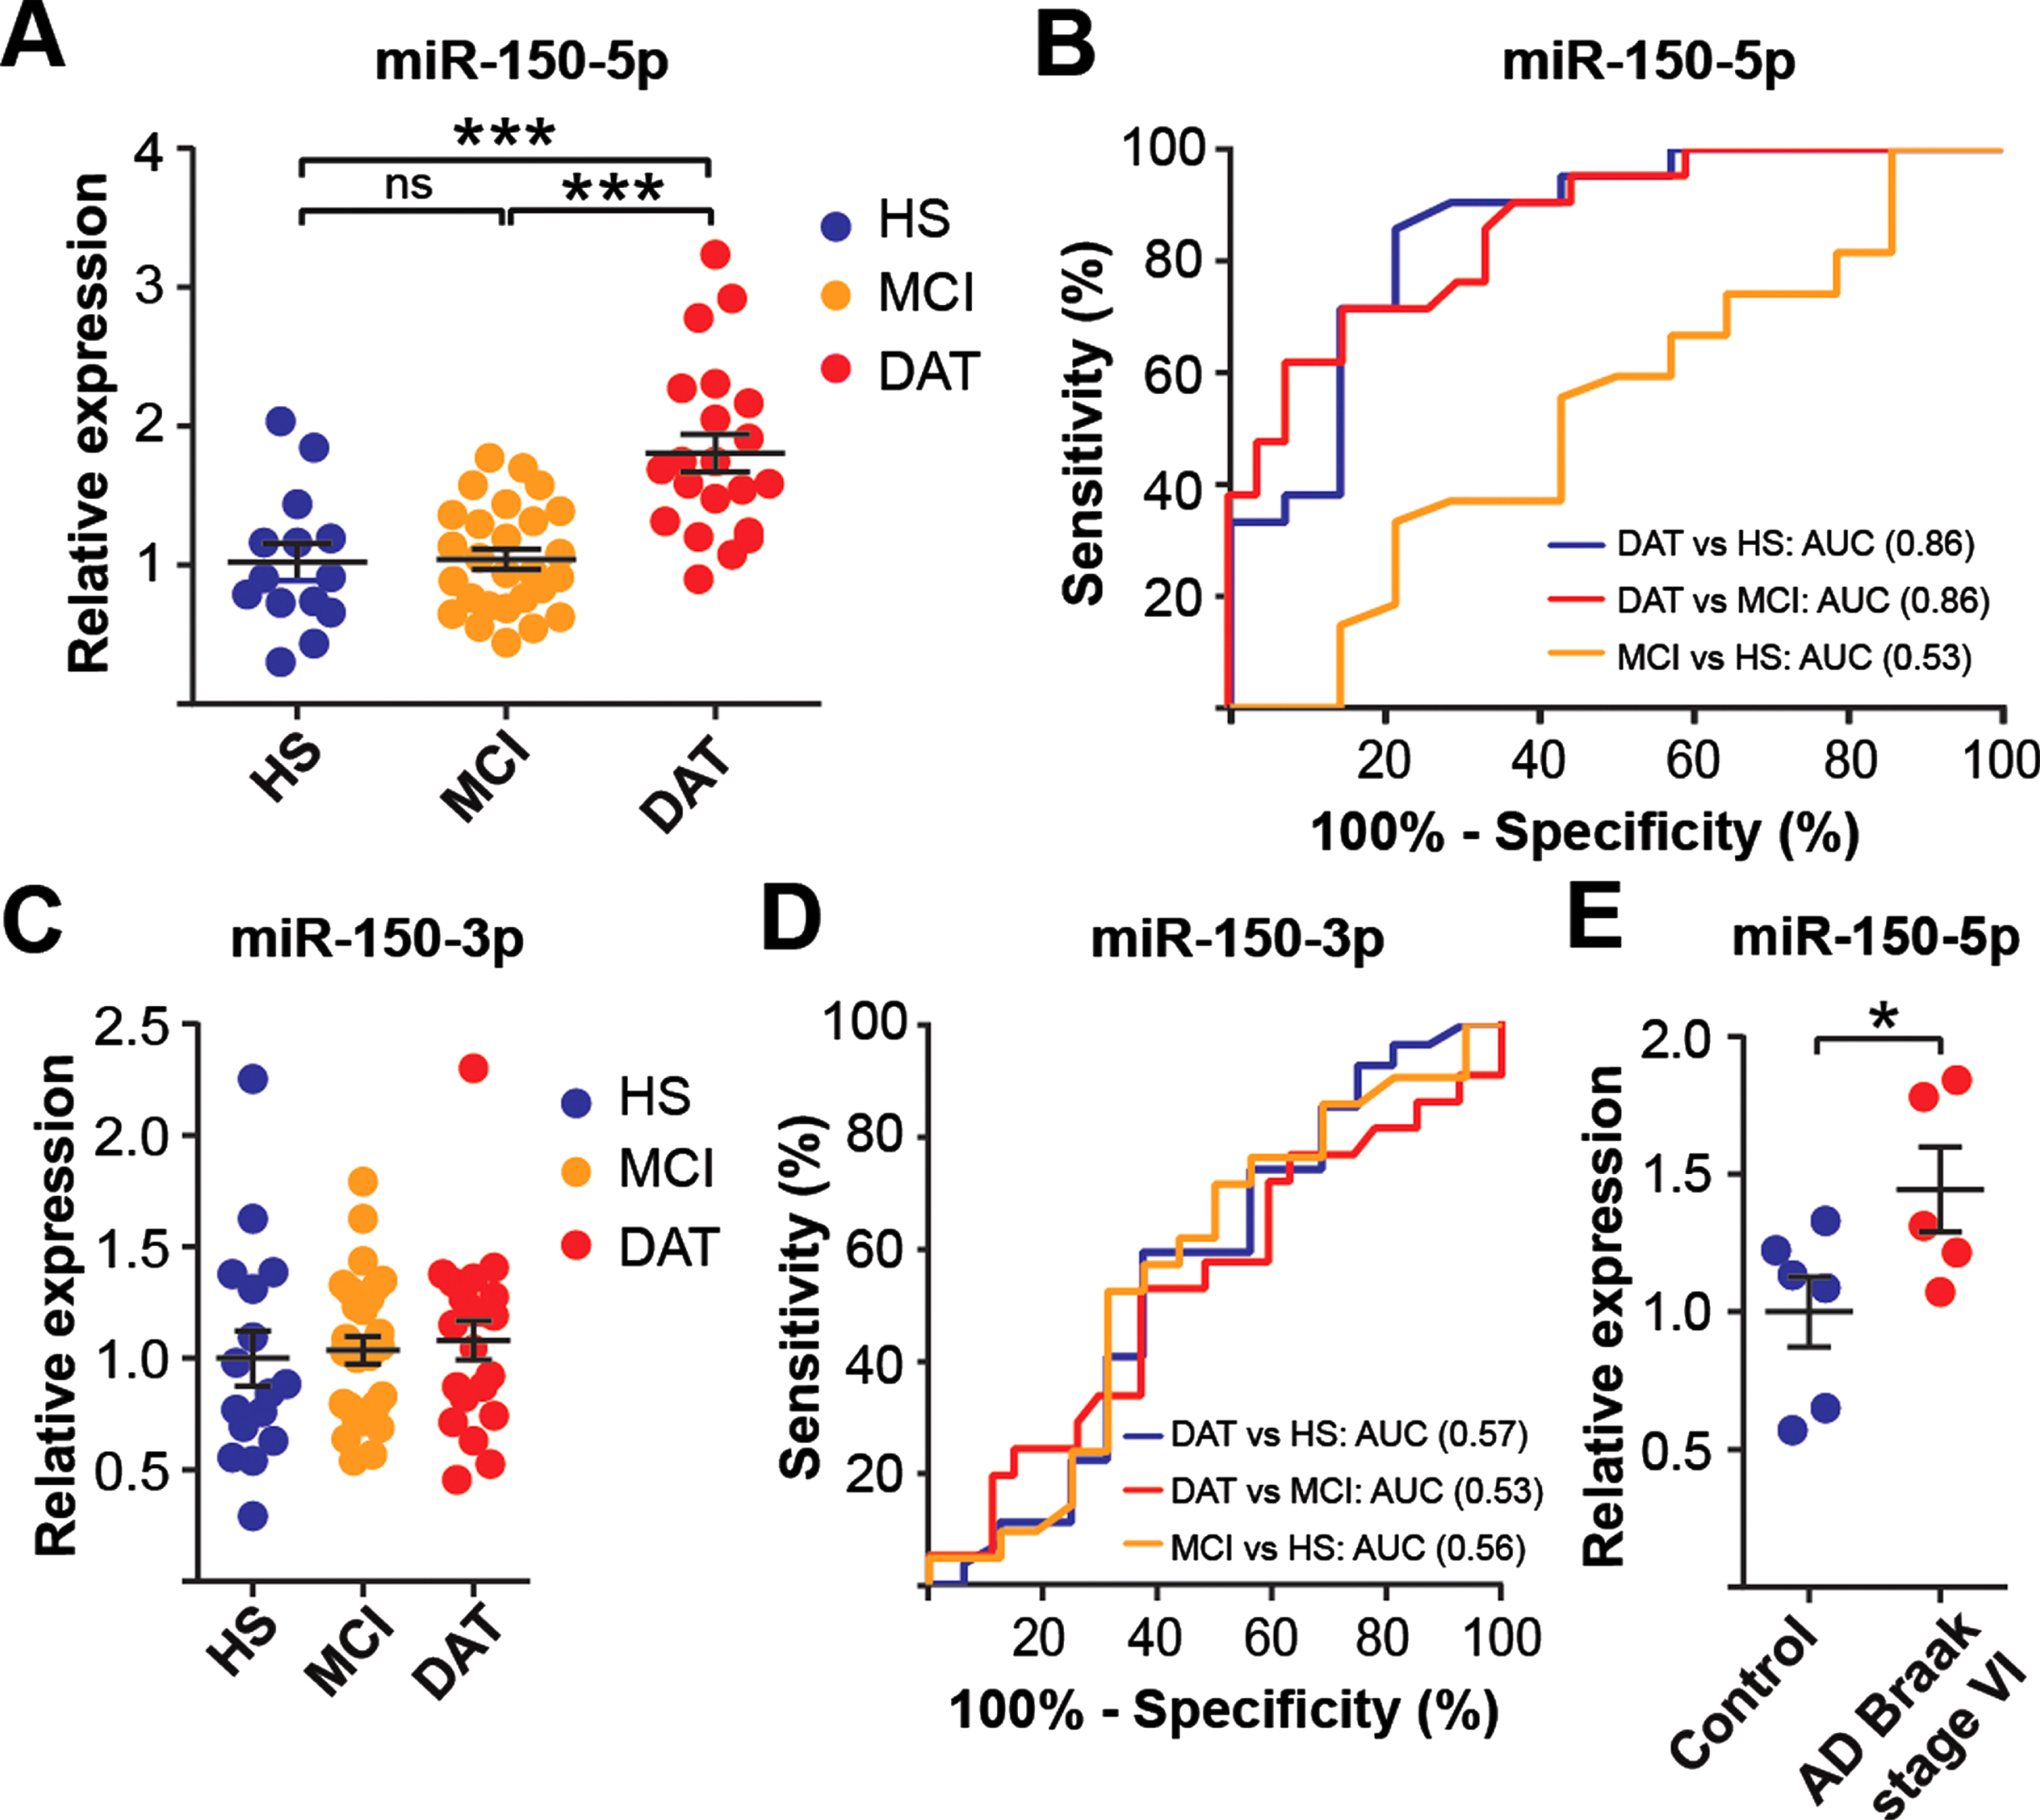
miR-150-5p levels are upregulated in DAT individuals and human AD brains. Expression levels (A) and receiving operating curve (ROC) analysis (B) of miR-150-5p in PBMCs of an independent cohort. Expression levels (C) and ROC analysis (D) of miR-150-3p in PBMCs of an independent cohort for all data sets. E) Expression level of miR-150-5p in AD hippocampus compared to control. Data are presented as the mean±SEM. One-way ANOVA with Tukey post hoc test and Student’s t-test were used to compare the differences between the disease groups. The statistical significance levels were set at *p≤0.05, ***p < 0.001; ns, no significant.
Notably, a precursor miRNA gives rise to two mature form of miRNA strands, 5′- strand and 3′- strands of miRNAs. Both strands of a miRNA pair could be functional or either one is functional. Co-existence of miRNA pair has been demonstrated and their expression may comparable or vary [38]. Therefore, we evaluated how the expression pattern of miR-150-3p altered in our study groups. miRNA-seq analysis showed that miR-150-3p was not significantly changed when compared DAT versus HS+MCI (Fig. 1B). Furthermore, RT-qPCR showed that no significant differences in miR-150-3p expression was observed among the three groups (Fig. 2C) and with AUCs less than 0.60 (Fig. 2D).
Next, we evaluated the possible sex differences associated with miR-150-5p by comparing miR-150-5p levels among HS, MCI, and DAT subjects. The chi-square test showed that no significant sex differences (p = 0.15, Table 2). In addition, we also examined the miR-150-5p expression levels by sex in each group. The results showed that miR-150-5p levels in female subjects were comparable to those of male subjects in all study groups (Supplementary Figure 3), suggesting no sex difference for the miRNAs examined in our study.
miR-150-5p levels are elevated in human postmortem AD tissue
This promising result led us to investigate whether miR-150-5p is dysregulated in the pathologically confirmed AD brain. We examined the miRNA expression pattern in human hippocampal postmortem tissues with Braak stage VI (n = 5) and age-matched HS (n = 6). RT-qPCR analysis revealed that miR-150-5p expression levels were significantly upregulated in the AD hippocampus compared to the control (Fig. 2E). Our results demonstrated that miR-150-5p is a potential blood-based biomarker for the diagnosis of AD.
Higher miR-150-5p levels are correlated with lower cognitive performance, lower CSF Aβ42, and higher CSF total tau levels
To provide enhanced insight that miR-150-5p is closely related to biological and clinical definitions of AD, we first evaluated the relationship between elevated levels of miR-150-5p and the clinical cognitive performance outcome of the patients. The MMSE and MoCA are commonly used clinical assessments for dementia [26, 27]. In both the MMSE and MoCA, the lower the score, the more severe the cognitive impairment of patients. Correlation analysis showed that the expression levels of miR-150-5p were significantly inversely correlated with both MMSE (r = –0.3968; p = 0.001, Fig. 3A) and MoCA scores (r = –0.4091; p = 0.001, Fig. 3B). Our results indicate that higher miR-150-5p expression levels in PBMCs are associated with poor cognitive outcomes of the patient, which is consistent with the clinical diagnosis.

Association between expression levels of miR-150-5p and cognitive assessment, CSF Aβ42 and total tau levels. Correlations of miR-150-5p expression levels with (A) MMSE score and (B) MoCA score, (C) CSF Aβ42 levels, and (D) CSF total tau levels are shown. Lower scores indicate cognitive decline. Lower CSF Aβ42 and higher CSF total tau levels indicate higher risk of associated with dementia of the Alzheimer’s type (DAT). Data were analyzed by a Spearman correlation test. The statistical significances were at *p < 0.05, **p < 0.01, and ***p < 0.001.
Next, we examined the correlation between miRNA expression and the AD pathology diagnosis. CSF Aβ42 levels have been previously demonstrated to be lower in patients with pathologically confirmed DAT than in HS [39]. Similarly, we found that there was a significant negative correlation between miR-150-5p expression levels and CSF Aβ42 levels (r = –0.3516, p = 0.0355, Fig. 3C). The increased miRNA expression accompanied by decreased Aβ42 is consistent with the higher expression of miR-150-5p in DAT subjects (Fig. 2A). A positive correlation between miR-150-5p levels and CSF total tau levels was observed (r = 0.3317, p = 0.0553, Fig. 3D). Higher miR-150-5p levels are associated with higher CSF total tau, indicating that higher miR-150-5p expression levels are associated with greater neurodegeneration. However, we did not observe any correlation between miR-150-5p levels and CSF p-tau (r = 0.014, p = 0.9364, Supplementary Figure 4).
Higher miR-150-5p levels are associated with lower voxelwise GMV in AD-specific brain regions
To study the correlation between miR-150-5p and AD brain atrophy patterns, we examined the influence of miR-150-5p expression levels on in vivo MRI-based brain structural measures involving the whole-brain GMV. We carried out whole-brain voxel-based morphometry analyses to assess voxelwise GM differences between individuals with low and high miR-150-5p. We found that participants with higher than median levels of miR-150-5p showed lower voxelwise GMV primarily in parietal and temporal regions involving the medial temporal lobe, posterior cingulate cortex, and precuneus (FWE corrected p < 0.05, Fig. 4A) as compared to participants with lower than median levels of miR-150-5p. To further investigate the influence of miR-150-5p on GMV, we carried out Pearson’s correlation analyses between miR-150-5p expression levels and GMV from specific ROIs comprising the DMN and the ECN, two major networks targeted in AD. We found that higher miR-150-5p levels were associated with lower GMV in the DMN regions comprising the left hippocampus (Fig. 4B), right hippocampus (Fig. 4C), medial prefrontal cortex, posterior cingulate cortex (FWE corrected p < 0.0055), and precuneus (uncorrected p = 0.007). Additionally, higher miR-150-5p levels were associated with lower GMV in the ECN regions comprising the left dorsolateral prefrontal cortex, right dorsolateral prefrontal cortex, left posterior cingulate cortex (Fig. 4D), and right posterior parietal cortex (Fig. 4E) at the FWE-corrected p < 0.0055 threshold. Our results demonstrated that miR-150-5p is able to correlate with cerebral atrophy in AD-specific regions.

High miR-150-5p levels are associated with lower voxel-wise grey matter volume in AD specific regions. A) Higher than median miRNA levels are associated with lower voxelwise grey matter volume (GMV) in temporal and parietal regions. Individuals with higher than median level of miR-150-5p showed reduced GMV in parietal and temporal regions. B, C) Higher miR-150-5p levels are associated with lower GMV in the default mode network (DMN). Increasing levels of miR-150-5p were related to lower GMV in the left and right hippocampal regions of interest comprising the DMN. D, E) Higher miR-150-5p levels are associated with lower GMV in the executive control network (ECN). Increasing levels of miR-150-5p were related to lower GMV in the left and right posterior parietal cortex regions of interest comprising the ECN.
miR-150-5p targets are involved in the Wnt signaling pathway, which is linked to AD pathobiology
To better understand the molecular mechanisms that underlie the dysregulation of miR-150-5p in AD, we performed gene enrichment analysis by identifying potential targets of miR-150-5p and investigated them using three widely used miRNA target prediction algorithms (miRDB, Insect Genome and TargetScan). A total of 120 common targets of miR-150-5p were revealed and then subjected to Gene Ontology (GO) category analysis to identify the functional roles of the miRNA targets. GO enrichment analysis showed that the miRNA negatively regulated its targets, and they were required for protein binding and were enriched in nucleocytoplasm regions (Fig. 5A). In addition, we mapped 120 predicted miRNA targets in the KEGG pathway using DAVID 6.8 to obtain better insight into the biological pathways regulated by these miRNA targets (Fig. 5B). Next, we further narrowed down 11 candidate miR-150-5p target genes based on the overlapping genes between enriched GO categories and KEGG pathways with FDR <0.06 and found that these genes were related to the AD and/or Wnt signaling pathway (Fig. 5C).
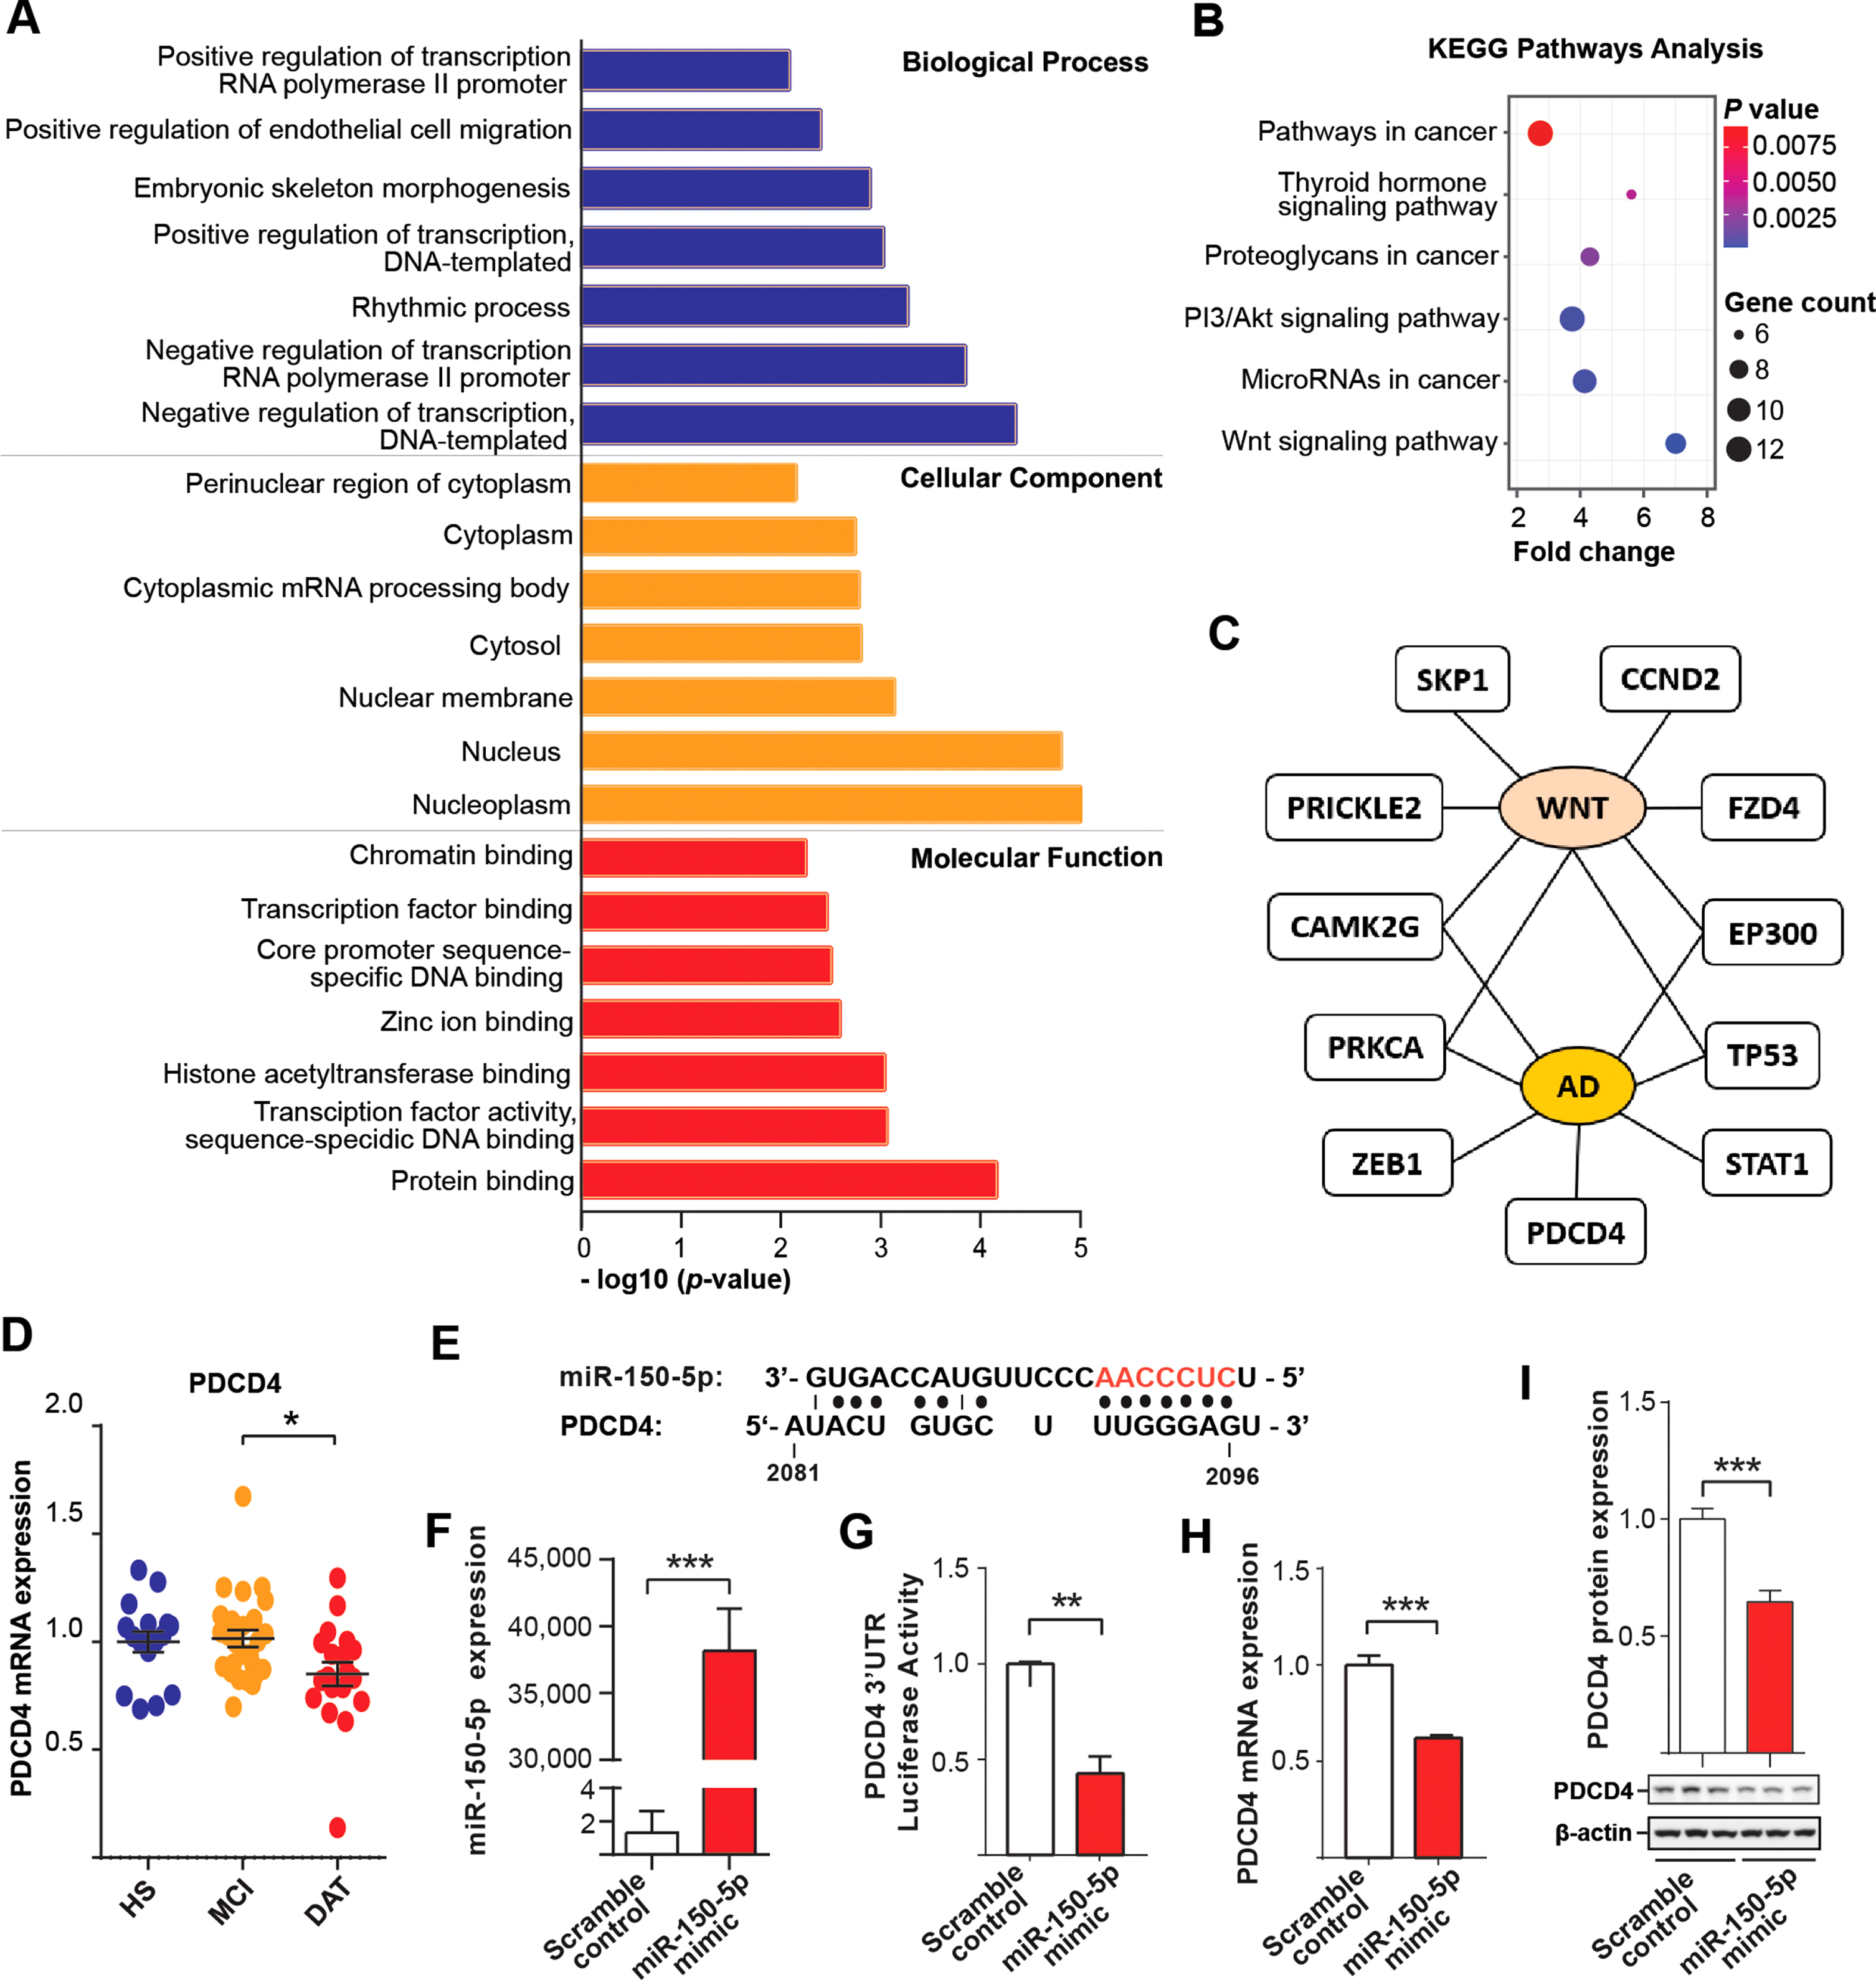
PDCD4 is the downstream target of miR-150-5p. A) Enriched GO terms for biological process, molecular function and cellular component. B) Enriched KEGG pathway analysis. Significantly enriched terms were presented with cut-off p < 0.01. C) Top 11 potential miR-150-5p targets which were implicated to AD pathology and/or Wnt signaling pathway. D) Expression levels of PDCD4 in PBMCs of an independent cohort. E) One of the four putative miR-150-5p binding sites (AACCCUC-red), position 2081–2096 at the 3′UTR of PDCD4 shown. F) Overexpression of miR-150-5p by miR-150-5p mimic. G) Luciferase assay of PDCD4 upon miR-150-5p overexpression. H-I) Overexpressed miR-150-5p downregulates PDCD4 (H) mRNA by RT-qPCR and (I) protein level by western blot. The statistical significances were set at *p < 0.05, **p < 0.01, and ***p < 0.001 by Student’s t-test and One-way ANOVA with Tukey post hoc test.
Among these 11 genes, the PDCD4 mRNA level was significantly downregulated in DAT compared to MCI, which is opposite to that of miR-150-5p (Fig. 5D). There were no statistical differences among the groups for the rest of genes (Supplementary Figure 5). Programmed cell death 4 (PDCD4) is a multifunctional tumor suppressor that regulates cell apoptosis, cell growth, protein translation and signal transduction. It has been shown to impair the PI3K/AKT signaling pathway in cellular AD models [40, 41]. In addition, we found that there were miR-150-5p putative binding sites (TTGGGAT) located in the 3′UTR of its mRNA (Fig. 5E). To further confirm that PDCD4 is the target of miR-150-5p, we conducted cell-based analysis. Coexpression of miR-150-5p mimic with the 3′UTR of PDCD4 in HEK 293T cells significantly downregulated PDCD4 at the transcription level, as shown by luciferase assays (Fig. 5F, G). We also showed that the overexpression of miR-150-5p in SH-SY5Y cells reduced PDCD4 at the mRNA level by RT-qPCR assays (Fig. 5H) and at the protein level by western blot analysis (Fig. 5I). Therefore, PDCD4 is a potential downstream target of miR-150-5p, and it may be related to miR-150-5p-associated pathogenesis in AD.
DISCUSSION
In the present study, we systematically identified miR-150-5p as a potential PBMC-based miRNA biomarker for DAT using miRNA profiling and validation studies in combination with association studies with clinical DAT measures. Enhanced miR-150-5p was detected in PBMCs of patients with DAT and AD human postmortem brain. miR-150-5p expression was closely correlated with cognitive performance, CSF Aβ42, and total tau levels, as well as the MRI AD pattern of atrophy. Our results demonstrated that higher levels of miR-150-5p were associated with degenerative effects on brain structure, especially in regions of the brain belonging to the DMN and ECN, key brain networks implicated in AD. Furthermore, our bioinformatics analysis revealed that selected targets of miR-150-5p were markedly associated with the Wnt signaling pathway, which has been implicated in AD [42]. We further showed that the expression levels of the target gene PDCD4 were downregulated in DAT. These results provide evidence that upregulation of miR-150-5p suppresses its downstream target genes. Therefore, our findings suggest that miR-150-5p has potential as a biomarker for the diagnosis of DAT.
To explore the role of PBMC-derived miRNAs in DAT, we unbiasedly profiled the miRNAs from PBMCs of 54 study participants (Fig. 1A). Additionally, we validated the aberrantly expressed miRNAs in an independent cohort of 64 study participants. As verified by RT-qPCR, miR-150-5p was upregulated in DAT versus HS subjects and DAT versus MCI subjects with an AUC of 0.86 for both comparisons (Fig. 2A, B). Contrary to our results, two independent teams previously reported decreased miR-150-5p levels in plasma exosomes and CSF of AD patients. However, these results were not validated by RT-qPCR [43, 44]. A recent study reported no expression changes of miR-150-5p in whole blood of AD [45]. This discrepancy may be due to differences in patient eligibility criteria, biofluids types, samples processing protocols, miRNA extraction and detection methods, or different proportions of miRNA shuttling in between the brain and bloodstream. Previous studies of miRNA PBMCs reported upregulation of miRNAs in AD compared to controls, such as miR-425, miR-200b, miR-200a-3p, and miR-155. A recent review reported discordant alterations in miRNA levels in various biological fluids of AD, such as miR-9, miR-15a, miR-26b, miR-34a-5p, miR-106, miR-200b, miR-502-3p, miR-3065-5p, miR-3001-3p, and miR-3613-3p [46].
Growing studies have profiled deregulated miRNAs in cortical and hippocampal region of human AD brain. Several miRNAs, including miR-101 [47], miR-153 [48], miR-339-5p [49], and miR-346 [50], were previously reported to be reduced in AD cortex, and miR-210 [51] was found to be reduced in AD hippocampus. On the other hand, the expression of miR-9, miR-30e, miR-128, miR-125b, and miR-200c was elevated in AD hippocampus [51, 52]. miR-146a was found to be increased in both cortex and hippocampus in AD brain [51, 53]. In our study, when we measured miR-150-5p in AD hippocampus, we also observed an upregulation in AD hippocampus (Fig. 2E), in agreement with miRNA profiling analysis from a previous report [23].
Notably, PBMCs are involved in the pathogenesis of AD due to their central role in neuroinflammation [54]. It has been reported that dysfunction of the BBB in AD enables shuttling of miRNAs between the brain and peripheral blood, such as brain infiltrating lymphocytes and monocytes, which represent the majority of immune cells in PBMCs [24, 55]. The presence of these cells has been demonstrated around Aβ plaques, and they are involved in Aβ clearance across the BBB through chemokines [56–58]. A recent review reported a higher correlation of transcriptomic changes (pattern of gene expression) and epigenomic changes (pattern of DNA methylation) between the CNS and blood [59]. Taken together, it is possible that changes in the PBMCs miRNAs may reflect alternation of miRNAs expression levels in the brain.
Therefore, we conducted correlation analyses of miR-150-5p levels with cognitive performance, neuroimaging, and CSF biomarkers for AD to explore whether miR-150-5p is associated with AD clinical measures. In this regard, we observed that miR-150-5p expression levels were inversely correlated with cognitive tests, including MMSE and MoCA, demonstrating that higher miR-150-5p levels were associated with lower cognitive scores (a higher disease severity) (Fig. 3A, B). Our findings also demonstrated that miR-150-5p expression levels were negatively correlated with CSF Aβ42 levels and positively correlated with CSF total tau levels (Fig. 3C, D). However, no correlation between miR-150-5p levels and CSF p-tau was observed. In addition, DAT subjects also had lower CSF Aβ42 and higher CSF total tau compared to HS and MCI. As expected, MCI had intermediate levels of both markers (Table 2). These findings further support that CSF is the gold standard of AD diagnosis, where cognitively impaired AD patients with a low CSF Aβ42 usually have a higher CSF tau [60]. Furthermore, both CSF total tau and p-tau levels in DAT were higher than that in HS and MCI, while these levels were comparable between HS and MCI. Similar findings were found for miR-150-5p level among the groups. Thus, miR-150-5p level not only differentiates DAT from HS but it also correlates with cognitive performance, CSF Aβ42 and CSF total tau, and thus has wide clinical implications.
Notably, CSF total tau and p-tau primarily behave as disease state markers in AD, reflecting degree of AD process. Total tau is a general marker of neurodegeneration and brain damage [61] since the elevation of CSF total tau not only found in AD patients, but also in other neurological disorders [62, 63]. On the other hand, p-tau has reported to be specific to AD due to the formation of neurofibrillary tau tangles, one of hallmark of AD [64, 65]. Our finding showed that miR-150-5p was elevated in DAT subject and was positively associated with total tau but not p-tau suggest that miR-150-5p may provide unique information in later stage of axonal degeneration rather than hyperphosphorylated tau proteins in AD brain. In addition, there was no correlation between miR-150-5p and CSF p-tau despite higher CSF p-tau was detected in DAT compared to HS and MCI. Moreover, a strong correlation of miR-150-5p with CSF Aβ42 and cognition has been observed. Taken together, these findings suggest that miR-150-5p may mirror the pathological state of the brain in those condition associated with cognitive deficits and axonal damages in the present of amyloid plaques.
To validate miRNAs as biomarkers of AD, there is a need to understand their relationship with in vivo markers of brain structure and AD neuropathology, such as Aβ and tau. However, there is currently limited evidence illustrating the association between miRNA levels and brain structure in AD. Thus, how miRNA levels influence and relate to in vivo measures of brain structure and function in AD is a key knowledge gap. In this regard, our findings illustrate a derogatory influence of miR-150-5p levels on both voxelwise and regional GMV in DAT (Fig. 4). Prior studies suggested that the effects of miRNA levels on neuropathological markers of AD, including Aβ and phosphorylated tau, could be related to such changes in brain structure. For instance, one study illustrated high accuracy in the diagnosis of prodromal AD using PBMC miRNA markers in accordance with Aβ deposition as observed on PET imaging [66]. The evidence also indicates that miRNAs regulate genes responsible for Aβ and phosphorylated tau upregulation, with increasing evidence suggesting that miRNAs influence Aβ production [15]. Additionally, prior studies have shown alterations of miRNA levels primarily in the GM, such as those involving the temporal lobes of the brain, which are also key regions of Aβ and phosphorylated tau deposition in AD [67–69]. Studies in postmortem human tissue illustrate that miRNA expression correlates with the presence of early AD-related pathology in GM, specifically with the density of diffuse Aβ plaques [69]. Such findings support the notion that patterns of miRNA expression in the cortical GM may contribute to and explain the underlying AD pathogenesis [69, 70].
The presence of Aβ plaques likely further initiates or potentiates downstream changes that culminate in neurofibrillary tau pathology, cell death, synapse elimination, and eventually cognitive impairment in individuals with altered miRNA levels [69]. Various miRNAs are important candidates for understanding disease progression and modulation in AD. Such events, as well as the miRNA influence on synaptic loss and synaptic damage, are possible mechanisms underlying GM loss, especially within the hippocampus, as well as cognitive decline related to AD. While our group is one of the first to show associations between brain changes and miRNA levels, much remains to be explored regarding the relationship between miRNA levels and brain structure in regions known to be affected by AD.
A single miRNA is able to regulate multiple target mRNAs, and likewise, a single target mRNA can be regulated by multiple miRNAs [71]. Using both target prediction and pathway enrichment approaches, we found that some miR-150-5p targets were enriched in the Wnt, PI3K-AKT, and thyroid hormone signaling pathways (Fig. 5B). Interestingly, these signaling pathways have been implicated in the neurodevelopment and pathogenesis of AD [42, 73]. In addition, miR-150-5p targets were enriched in the nucleus, nucleoplasm, nuclear membrane, cytosol, cytoplasmic mRNA processing body, and cytoplasm (Fig. 5C), which further demonstrated the likelihood of miRNA targets shuttling between the cytoplasm and nucleus.
Notably, miRNAs negatively regulate the expression of their targets [5, 6]. Consistently, the miR-150-5p target PDCD4 was found to be downregulated in DAT compared to MCI and HS (Fig. 5D), which reflected the most enriched GO biological process category in which miR-150-5p is a negative regulator (Fig. 5A). PDCD4 (programmed cell death 4) has been demonstrated to be an important tumor suppressor in various cancers by inducing cell apoptosis. Until recently, PDCD4 was found to be regulated by miR-21 via the PI3K/AKT signaling pathway in an in vitro model of AD [40]. In SH-SY5Y cells treated with Aβ42, PDCD4 expression was repressed by miR-21. In this study, our results validated that PDCD4 was remarkably reduced in DAT individuals. Through a luciferase assay, we identified that miR-150-5p suppressed the expression of PDCD4 at the transcriptional level. Downregulation of PDCD4 may promote translational initiation of apoptotic-related gene procaspase-3 and leads to neuronal cell death [74]. In hepatoma cells, PDCD4 knockdown induced apoptosis by upregulating cyclin-dependent kinase inhibitor p21 levels via p53 dependent and independent pathway [75, 76]. PDCD4 knockdown also induced cellular senescence and cell death independently of p53 [77]. Ectopic overexpression of p21 inhibits cell cycle progression at G1/S and G2/M phases, leading to cellular senescence in response to DNA damage. In addition, p21 induces amyloid precursor protein (APP) in senescent cells, one of hallmark of AD [78]. Our study showed that TP53 (activator of p53) was unaffected in DAT and MCI compared to HS. This leads us to suggest that PDCD4 may exhibit an anti-apoptotic role by regulating p21-mediated caspase cascade or cell cycle arrest, irrespective of p53 status in AD. To date, little is known about the biological role of PDCD4 in AD. Further investigation is required to determine the regulatory mechanisms of miR-150-5p and PDCD4 expressions.
Our study included a relatively small sample size; however, the availability of Aβ42, total tau, and p-tau in our cohort allowed us to study the correlation to AD pathology. Furthermore, we were able to replicate our findings in an independent cohort and AD hippocampus. As the participants in this study were relatively young, the findings should also be tested in older cohorts to ensure generalizability to older patients with DAT.
Conclusions
Our findings identified miR-150-5p as a potential candidate biomarker for DAT. The expression of miR-150-5p was correlated with CSF Aβ42 and total tau, AD patterns of cerebral atrophy and cognitive performance. To the best of our knowledge, this study is the first to demonstrate the role of miR-150-5p as a potential biomarker of DAT coupled with clinical measures (Fig. 6). While miR-150-5p has the potential to be developed as a clinical biomarker for DAT, future longitudinal studies with larger cohorts are needed to validate the utility of miR-150-5p in DAT.
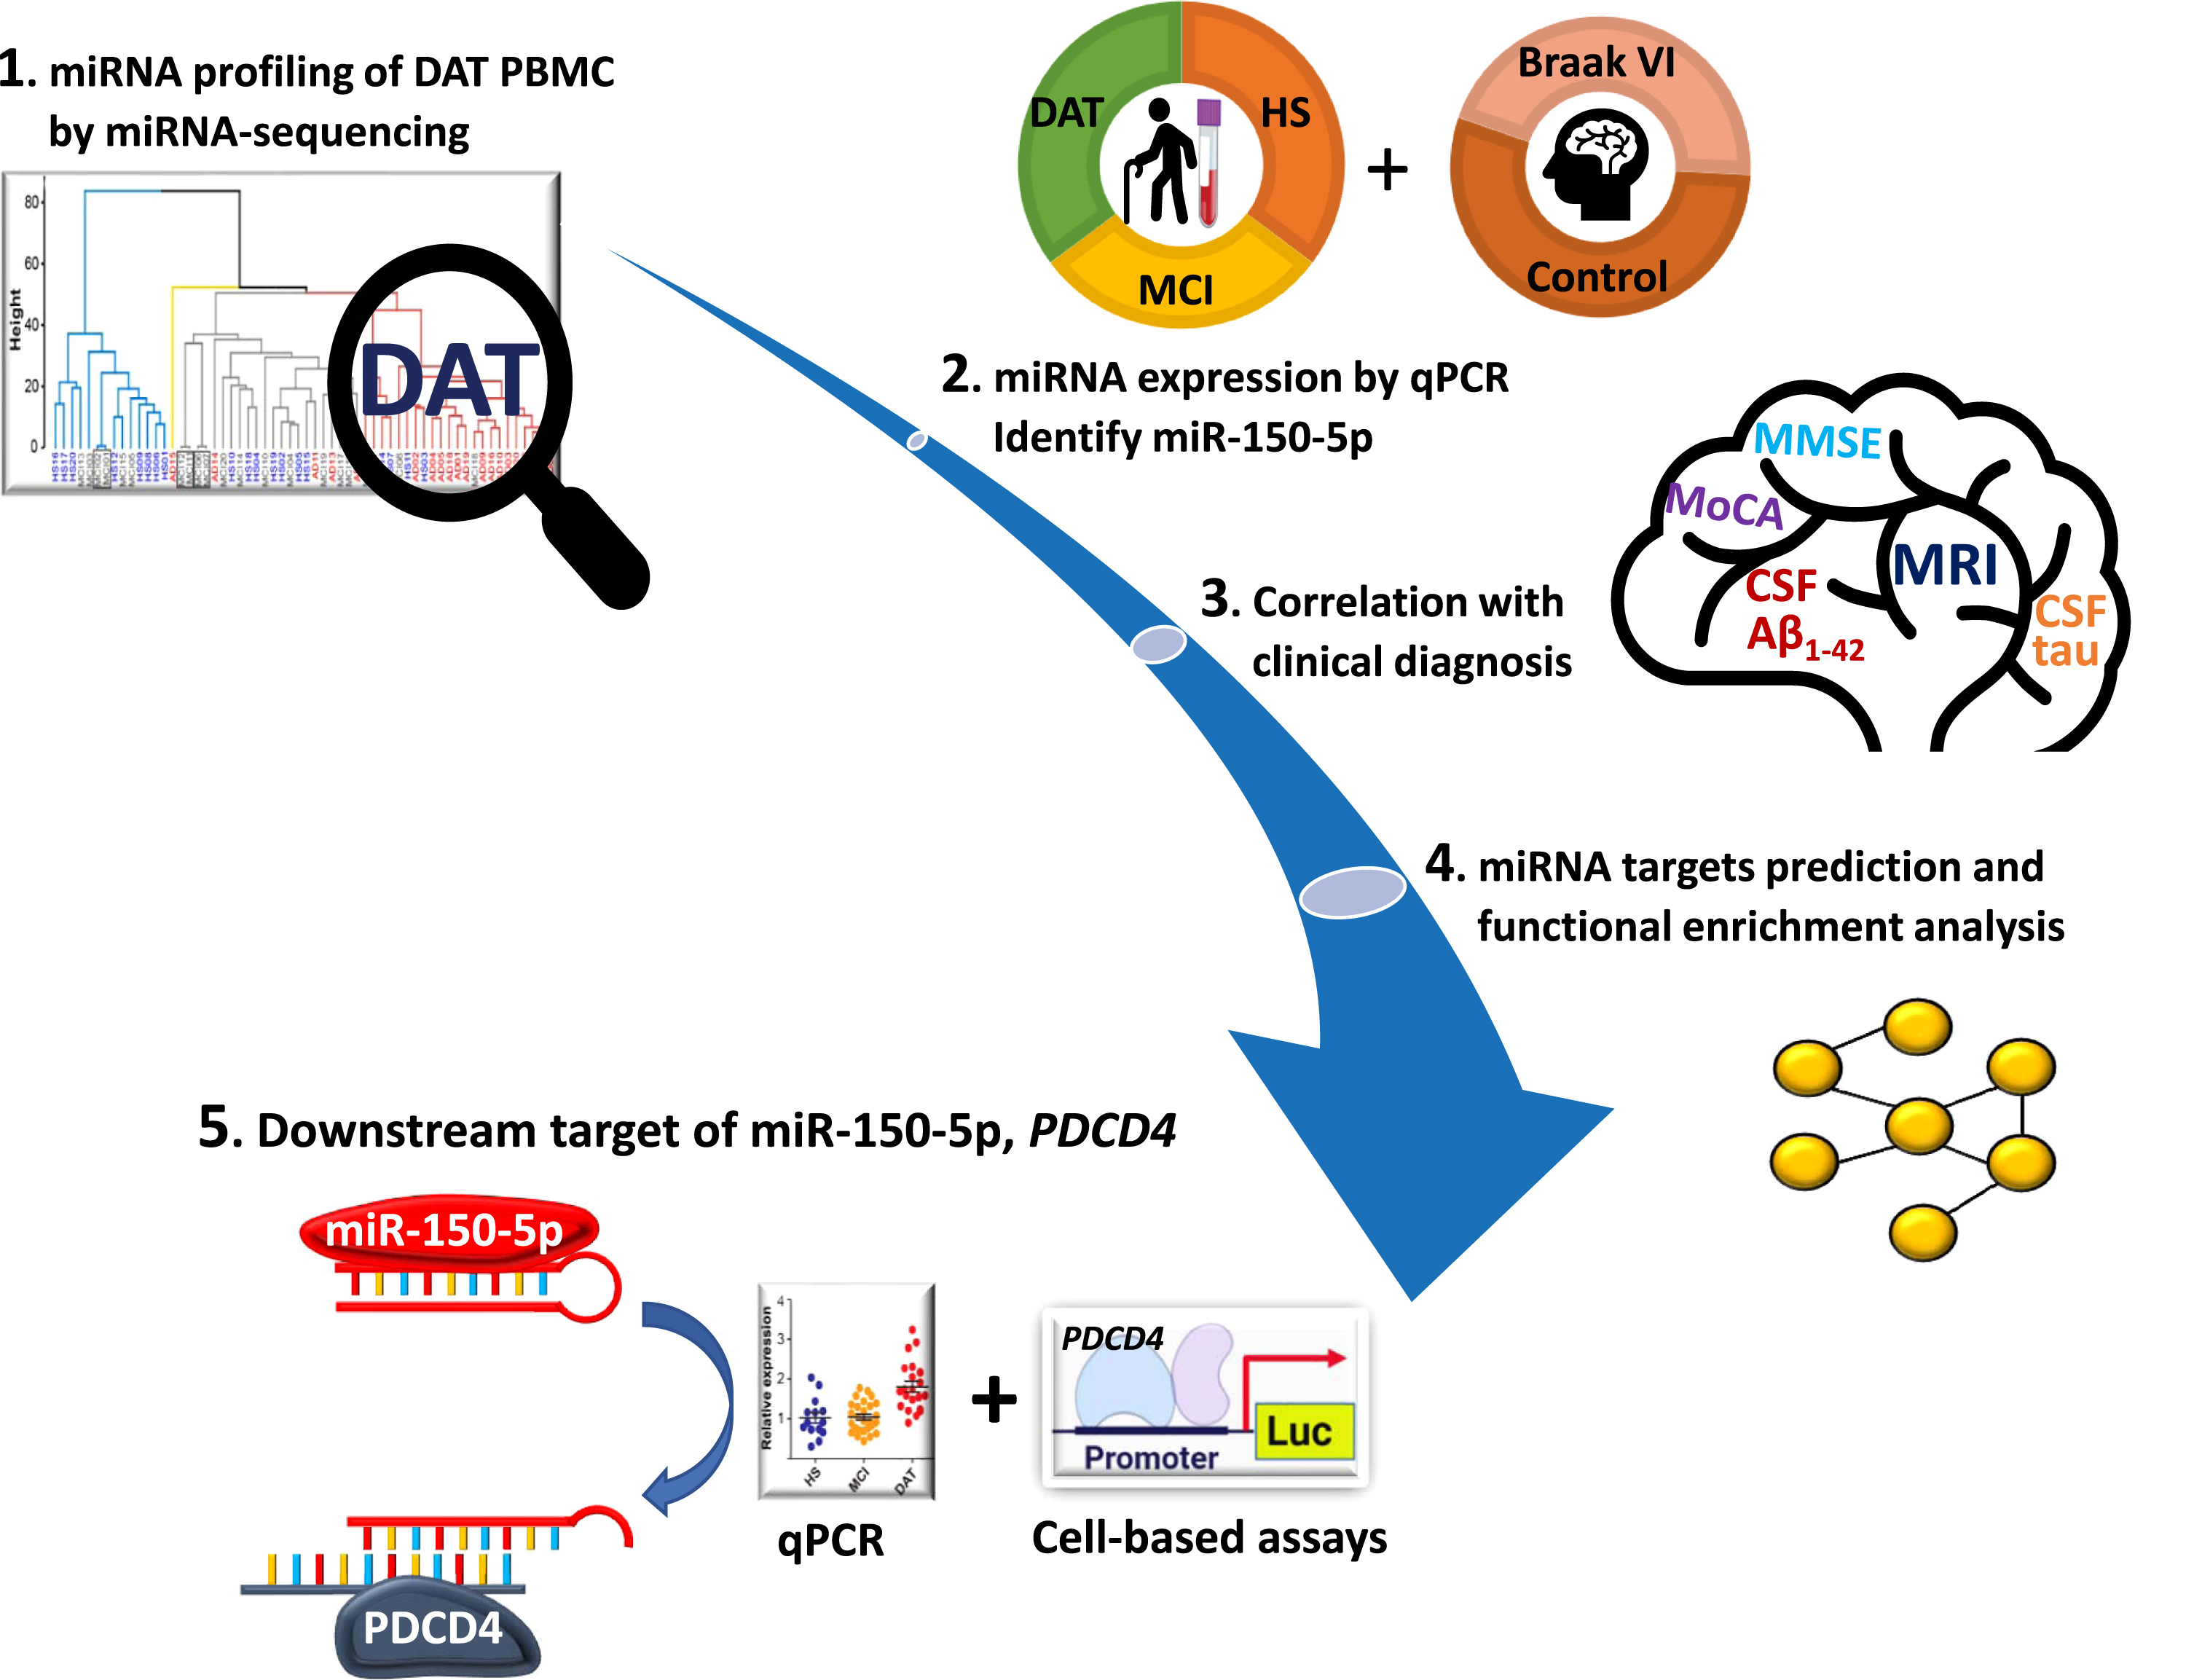
Schematic workflow for identification of miR-150-5p as a biomarker in PBMCs of DAT. The schematic diagram describes the miRNA expression profile using miRNA-seq, followed by validation of predictive miR-150-5p in PBMCs of an independent cohort. Subsequently, miR-150-5p was identified as a potential DAT biomarker by using clinical and experimental approaches.
Footnotes
ACKNOWLEDGMENTS
This research was supported by the Singapore Ministry of Health’s National Medical Research Council (NMRC) under its Centre Grant Programme-Category 2 (NMRC/CG2/005a/2022-NNI), Open Fund Individual Research Grant (NMRC/OFIRG/0074/2018) and Singapore Translational Research (STaR) Investigator Award (NMRC/STaR/0030/2018). We Thank Christina Lim for the blood samples processing.