



Abstract
Background:
Reduced signal on fluorodeoxyglucose-positron emission tomography (FDG-PET) is a valid proxy for neurodegeneration in Alzheimer’s disease (AD). Perivascular space (PVS) is believed to be associated with AD pathology and cognitive decline.
Objective:
This study aimed to investigate the associations of PVS with FDG-PET and cognitive performance based on the burden of amyloid pathology.
Methods:
We used magnetic resonance imaging (MRI) data from the Alzheimer’s Disease Neuroimaging Initiative (ADNI). MRI-visible PVS in basal ganglia (BG) and centrum semi-oval (CSO) were visually classified as: none/mild, moderate or frequent/severe. The association of PVS with brain FDG-PET was explored based on the burden of amyloid pathology, where a cerebrospinal fluid (CSF) t-tau/Aβ42 with the ratio≥0.27 was defined as high amyloid pathology. Moreover, the relationships between PVS and cognitive performance variables (ADNI-MEM and ADNI-EF) were studied.
Results:
For participants with higher tau/Aβ42 ratio, CSO-PVS severity was independently associated with lower FDG-PET. There were significant interaction effects between moderate or frequent/severe CSO-PVS and time on FDG decline in people with high amyloid pathology. The interaction between CSO-PVS and time (follow-up) was consistently associated with ADNI-MEM and ADNI-EF decline in individuals with high amyloid pathology.
Conclusion:
The study established the differential utility of PVS in BG and CSO for predicting brain metabolism. These findings suggest that CSO-PVS serves as a contributing factor to brain metabolism and cognitive decline associated with amyloid pathology.
INTRODUCTION
Alzheimer’s disease (AD), the most common form of dementia in the elderly population, is characterized by accelerated accumulation of protein aggregates and continuous neurodegeneration [1]. Amyloid deposition and tauopathy, as the representative pathological indicators of AD, contribute to brain metabolic decline and cognitive dysfunction [2]. Fluorodeoxyglucose positron emission tomography (FDG-PET) is a tracer-based scanning method to capture the topography of metabolism in the brain [3]. Reduced FDG-PET signal is considered to be a valid proxy for neurodegeneration in the recently established amyloid/tau/neurodegeneration (ATN) classification for the biological definition of AD [4]. The measure fuels the quantitative measurement of brain metabolic status, and facilitates early detection of cognitive decline [4].
The contributions of cerebral small vessel disease to neurodegeneration and cognitive decline have been noted. Perivascular space (PVS) is attracting increasing attention as a magnetic resonance imaging (MRI)-visible marker for small vessel disease in brains [5]. It forms part of a complex brain fluid drainage system, which enables fluid exchange between cerebrospinal fluid (CSF) and interstitial fluid to clear wastes and neurotoxins [6]. Enlargement of PVS can be detected in neurodegenerative disorders, such as AD and Parkinson’s disease (PD) [7, 8]. PVS has been observed in different locations in the brain, i.e., basal ganglia (BG) and centrum semi-oval (CSO), which might be differentially involved in neurodegeneration. It has been found that high degree of PVS in CSO is associated with accumulated amyloid in patients with AD-related cognitive impairment [9], while PVS in BG is likely to predict cognitive decline in PD patients [7]. Therefore, location-specific PVS serves as a potential marker to understand the onset and progression of neurodegeneration.
To date, the clinical significance of PVS in brain metabolism has not been well demonstrated. Herein, we used data from the Alzheimer’s Disease Neuroimaging Initiative (ADNI), which is an ongoing, longitudinal, multicenter project, on the one hand, to evaluate the association of PVS with brain FDG-PET; on the other hand, to assess the predictive values of PVS for cognitive performance.
MATERIALS AND METHODS
Study participants
Data used in this article were obtained from the ADNI database (http://adni.loni.usc.edu), which is easily available for download from the Laboratory of Neuroimaging (LONI) website to the research public. As such, the investigators within the ADNI contributed to the design and implementation of ADNI and/or provided data but did not participate in analysis or writing of this report. A complete listing of ADNI investigators can be found at: http://adni.loni.usc.edu/wp-content/uploads/how-to-apply/ADNI-Acknowledgement-List.pdf
Detailed information of enrollment protocols for ADNI have been described previously [10]. ADNI was launched in 2003, led by Dr. Michael W. Weiner. The primary goal of ADNI has been to combine MRI, PET, biological markers, and clinical and neuropsychological scales to assess the progression of mild cognitive impairment (MCI) and early AD. The study was approved by the institutional review boards of all participating centers across USA and Canada. Informed written consent was obtained from all participants. For up-to-date information on ADNI, see http://www.adni-info.org.
The current study considered participants from all ADNI phases, including ADNI1, ADNI2, ADNI-GO, and ADNI3. We included subjects who were classified as cognitively normal, or MCI to study the metabolic and cognitive change during disease progression. Diagnoses were made according to the ADNI criteria (Supplementary Table 1). To be eligible for inclusion, participants were required to have complete data for demographic variables (age, gender, APOE4 presence), CSF biomarkers (t-tau and Aβ42), and 3T MRI scanning records at the baseline level. In addition, subjects were not included unless they had received both a baseline FDG-PET scan and at least one follow-up scan.
CSF measurements
The protocols for collection and processing of the CSF samples are available in ADNI website (http://adni.loni.ucla.edu). CSF Aβ42 and t-tau were measured by the ADNI biomarker core team at the University of Pennsylvania using the electrochemiluminescence immunoassays on a fully automated cobas e 601 instrument. Amyloid pathology was determined by calculating the t-tau/Aβ42 ratio, with the following criteria: <0.27 for low pathology and≥0.27 for high pathology [11, 12].
MRI acquisition
MRI acquisition details are available in ADNI protocols (http://adni.loni.usc.edu). In the ADNI study, uniform 3T MRI scans were performed across several platforms (GE, Philips, or Siemens) using a standardized protocol [13]. All subjects underwent scanning methods, including axial T2 fast spin echo/turbo spin echo (FSE/TSE) with fat sat, axial T2-fluid-attenuated inversion recovery (FLAIR), and axial T2*-gradient-recalled echo sequences. All images were checked by the Mayo Clinic quality control team to ensure protocol compliance and image quality.
PVS was rated on axial T2-weighted MRI images, according to the Standards for Reporting Vascular changes on neuroimaging (STRIVE) [14]. PVS was considered to be in small, sharply delineated structures measuring less than 3 mm diameter and matching the signal intensity of CSF. PVS in BG and CSO was rated with a 4-point visual rating scale based on the number of PVS in the selected slice (0: no PVS; 1 : 1–10; 2 : 11–20; 3 : 21–40; 4: >40) [8]. The severity was classified as none/mild (grade 0-1), moderate (grade 2), or frequent/severe (grade 3-4) for subsequent analysis. For the BG, a single slice showing the anterior commissure was selected for rating; for CSO, the first slice above the level of the lateral ventricles was selected. The hemisphere with a higher score was chosen. All images were analyzed by two neuroradiologists from our institution. An inter-observer reliability test was performed, and the intraclass correlation coefficients (ICCs) for BG- and CSO-PVS were found to be 0.849 and 0.829, respectively. Total intracranial volume (TIV) (in L) was quantified on T1 sequences using an automated segmentation mode (details are available in http://adni.loni.usc.edu).
FDG-PET analysis
FDG-PET images were downloaded from the ADNI Image Data Archive (http://ida.loni.usc.edu). Briefly, the images were analyzed using a method developed at UC Berkeley. Images were spatially normalized the Montreal Neurological Institute (MNI) PET template in Statistical Parametric Mapping (SPM) software. Mean counts of the meta-analytically derived regions of interest (metaROIs) of five regions (posterior cingulate, left angular, right angular, left temporal, and right temporal gyrus) in each subject’s FDG-PET scan were extracted and calculated with SPM subroutines. Additionally, the mean of the top 50% of voxels within a hand-drawn pons/cerebellar vermis region was rated on a T1 template in MNI space. Finally, each metaROI mean of the five regions was normalized by dividing it by the mean of the pons/vermis reference region mean. The brain FDG-PET signal value was acquired by averaging the total metaROIs means of the five regions. The FDG-PET data available at each time-point for all individuals were displayed in Supplementary Table 2.
Cognitive assessment
The Mini-Mental State Examination (MMSE) score on a 30-point scale was recorded in all participants. Composite scores for memory (ADNI-MEM) and executive function (ADNI-EF) were calculated and used to represent cognitive performances [15]. Both scores were adjusted to have a mean of 0 and variance of 1 at the baseline level.
Statistical analysis
Statistical analyses were performed with the software package IBM Statistical Package for the Social Sciences (SPSS) Statistics for Windows 25.0. Baseline characteristics were compared between low (t-tau/Aβ <0.27) and high amyloid pathology (t-tau/Aβ ≥0.27) groups using the χ2 test and the Fisher’s exact test for categorical variables, and the two-sample t test or Mann-Whitney U test (depending on the distribution) for continuous variables.
Linear regression models were applied to assess the associations of BG- and CSO-PVS with baseline brain FDG-PET, with age, gender, education, diagnosis, APOE4 presence, t-tau/Aβ42 ratio and TIV as covariates. Furthermore, the relationships of PVS with baseline ADNI-MEM and ADNI-EF were explored by linear regression analysis, respectively.
Next, we tested whether PVS predicted longitudinal FDG-PET change, and cognitive decline (ADNI-MEM and ADNI-EF) using linear mixed regression models, with age, gender, education, diagnosis, APOE4 presence and t-tau/Aβ42, TIV, BG- or CSO-PVS, time (years from baseline to the time-point of FDG-PET or cognitive reassessment), and the baseline FDG-PET values or cognitive measures included as predictors, with BG- or CSO-PVS*time as interaction terms. For all models, a random intercept and slope term were included for each participant and accounted for within-subject correlation and between-subject variability. Standardized beta coefficient (β) and standard errors (SE) were calculated. The abovementioned models were established based on amyloid pathology burden.
Statistical significance was set at p < 0.05. False discovery rate (FDR) adjustment was applied to correct for multiple comparisons of the FDG-PET and cognitive variables.
RESULTS
Baseline characteristics
The baseline characteristics of the subjects were shown in Table 1. In the present study, there were 138 participants with above amyloid pathology cutoff (110 MCI patients), and 218 subjects with below the threshold (137 MCI patients).
Baseline characteristics of the included subjects in the study
ADNI, Alzheimer’s Disease Neuroimaging Initiative; BG, basal ganglia; CSO, centrum semi-oval; EF, executive function; FDG-PET, fluorodeoxyglucose positron emission tomography; MCI, mild cognitive impairment; MEM, memory; MMSE, Mini-Mental State Examination; PVS, perivascular space; TIV, total intracranial volume. Data were expressed as the mean±S.D., median (IQR) or number.
People high amyloid pathology were older (mean±SD: 73.32±6.57); received less years of education (median, quartile: 16.00, 4.00); and tended to exhibit lower cognitive scores (MMSE [median, interquartile range: 28.00, 2.00], ADNI-MEM [mean±SD: 0.29±0.62], ADNI-EF [mean±SD: 0.32±0.81]), and decreased brain FDG-PET signal (mean±SD: 1.25±0.12).
The burden of BG- and CSO-PVS were also analyzed based on amyloid pathology (Fig. 1). Participants with high amyloid pathology were more likely to have frequent/severe BG-PVS (high versus low pathology: 23.91% versus 11.93%) and CSO-PVS (high versus low pathology: 46.38% versus 32.57%) than those with low amyloid pathology (p < 0.05).
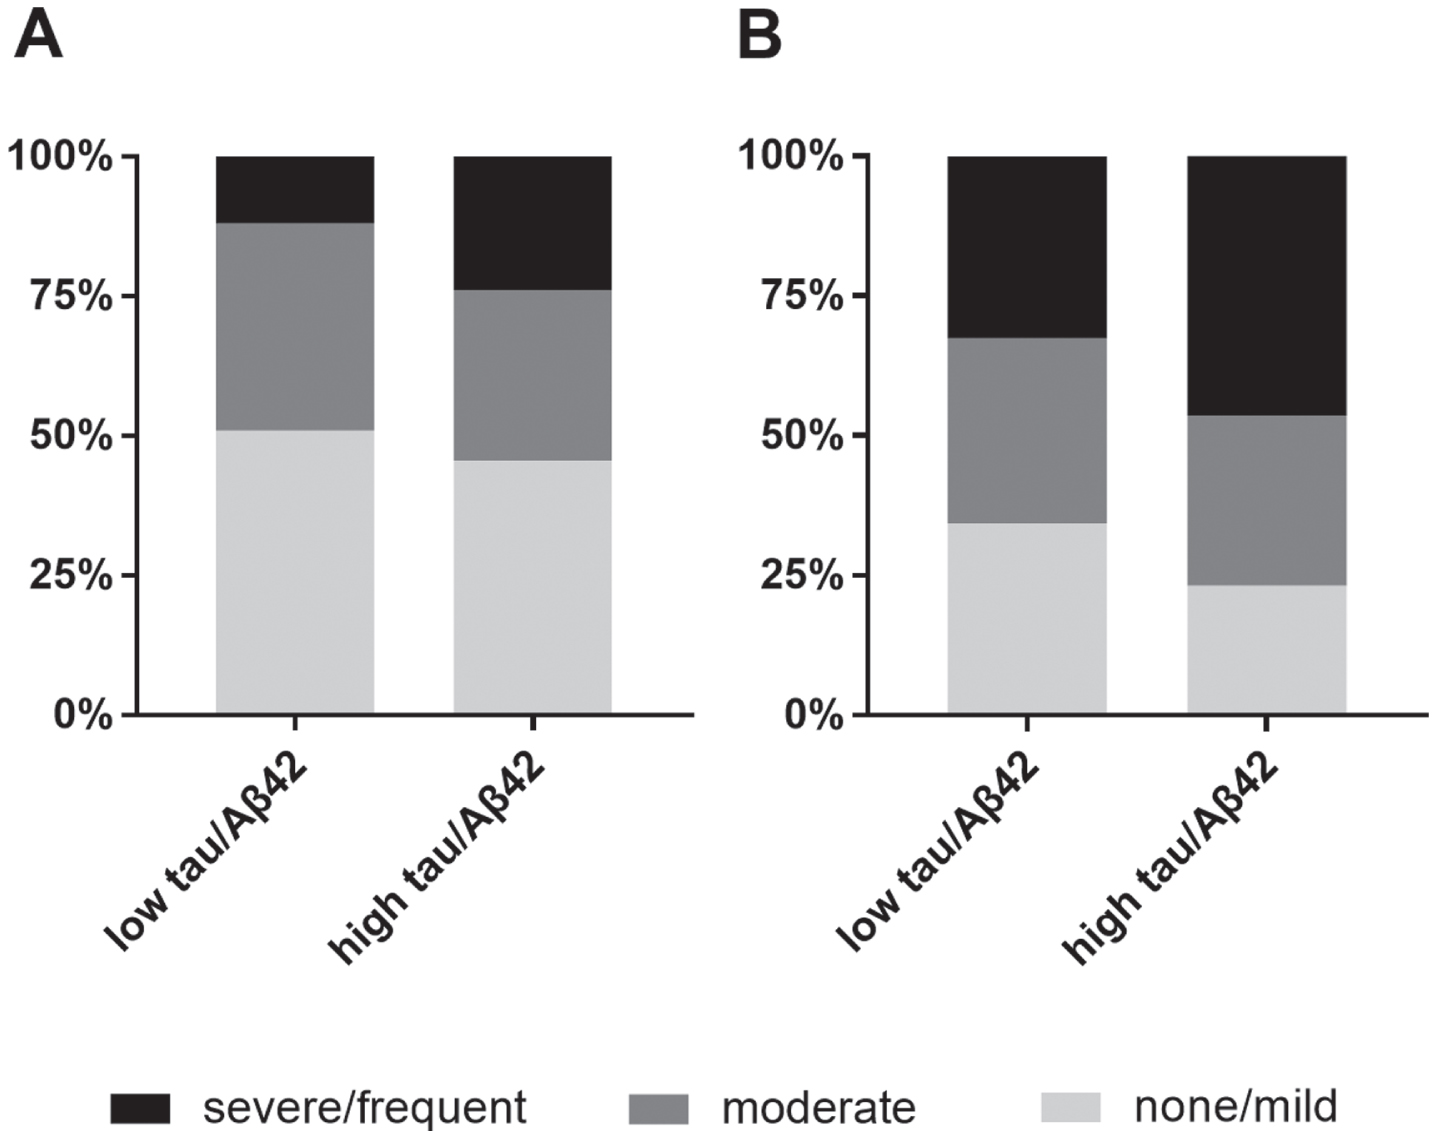
The presence of BG-PVS (A) and CSO-PVS (B) based on tau/Aβ42 ratio. BG, basal ganglia; CSO, centrum semi-oval; PVS, perivascular space.
Associations of PVS with FDG-PET and cognition at baseline
To explore the associations of PVS with baseline FDG-PET, linear regression models were established, including age, gender, education, diagnosis, APOE4 presence, TIV, and t-tau/Aβ42 as covariates (Table 2). We stratified the cohort based on the amyloid deposition threshold, which is indicated by the CSF t-tau/Aβ42 ratio, and established separate linear regression models. For individuals meeting or exceeding the t-tau/Aβ42 cutoff, only CSO-PVS severity was independently associated with a lower level of FDG-PET (β [SE] = –0.034 [0.013]; p = 0.026).
The associations of BG- and CSO-PVS with brain FDG-PET at baseline level in participants with low and high tau/Aβ42. Data were analyzed by a linear regression model with brain FDG-PET as dependent variables, and age, gender (female as reference), education, diagnosis (CN as reference), APOE4 presence (no gene presence as reference), t-tau/Aβ42 ratio, TIV and BG- or CSO-PVS (none/mild as reference) as covariates. β values, standard error (SE) and p values were reported. *represents significant p values
BG, basal ganglia; CSO, centrum semi-oval; FDG-PET, fluorodeoxyglucose positron emission tomography; PVS, perivascular space; SE, standard errors.
Moreover, analyses were performed to evaluate the relationships between PVS and concurrent cognitive performance (ADNI-EF, ADNI-MEM) (Supplementary Table 3). We did not observe any significant relationship between of BG-PVS or CSO-PVS and cognitive performance. Weak associations were detected between the presence of BG-PVS and CSO-PVS in the analysis of participants with low (r = 0.297, p < 0.001) and high amyloid pathology (r = 0.269, p = 0.001).
Associations of PVS with longitudinal FDG-PET changes and cognitive decline
The predictive power of BG- and CSO-PVS for changes in brain metabolism was explored (Fig. 2). As shown in Supplementary Table 4, no significance was found in the analysis of BG-PVS among individuals with either a low or high tau/Aβ42 ratio. The interaction between moderate CSO-PVS and time was demonstrated to be associated with FDG-PET decline in people with low amyloid pathology (β [SE] = –0.0005 [0.0002], p = 0.010) (Table 3). Moderate CSO-PVS*time (β [SE] = –0.0002 [0.0004], p < 0.0001) and frequent/severe CSO-PVS*time (β [SE] = –0.0002 [0.0003], p < 0.0001) had consistent predictive value for reduced FDG-PET level (Table 3).
The associations of CSO-PVS with longitudinal change of brain FDG-PEG. Data were analyzed using a mixed linear regression model with brain FDG-PET change as dependent variable, and age, gender (female as reference), education, diagnosis (CN as reference), APOE4 presence (no gene presence as reference), t-tau/Aβ42 ratio, baseline FDG-PET, TIV, time and CSO-PVS (none/mild as reference) as covariates. β values, standard error (SE) and p values were reported. *represents significant p values
CSO, centrum semi-oval; FDG-PET, fluorodeoxyglucose positron emission tomography; PVS, perivascular space; SE, standard errors.

The longitudinal change of brain FDG-PET of participants with below and above tau/Aβ42 cutoff ratio, based on the severity of BG- and CSO-PVS. A) Brain FDG change of participants with below tau/Aβ42 based on BG-PVS severity; B) brain FDG change of participants with above tau/Aβ42 based on BG-PVS severity; C) brain FDG change of participants with below tau/Aβ42 based on CSO-PVS severity; D) brain FDG change of participants with above tau/Aβ42 based on CSO-PVS severity. BG, basal ganglia; CSO, centrum semi-oval; FDG-PET, fluorodeoxyglucose positron emission tomography; PVS, perivascular space.
We repeated the analysis of cognitive changes affected by PVS over time. The interaction between CSO-PVS and time was found to significantly correlate with ADNI-MEM change among participants with high amyloid pathology (moderate*time: β [SE]: –0.007 [0.002], p < 0.0001; frequent/severe*time: β [SE]: –0.005 [0.002], p = 0.001) (Table 4). Moreover, the CSO-PVS*time interaction predicted reduced ADNI-EF in participants with high amyloid pathology, i.e., moderate CSO-PVS*time (β [SE]: –0.009 [0.002], p < 0.001) or severe/frequent CSO-PVS*time (β [SE]: –0.008 [0.002], p < 0.001) (Table 5). However, no significant results were found in the analysis of BG-PVS for longitudinal changes of ADNI-MEM (Supplementary Table 5) and ADNI-EF (Supplementary Table 6).
The associations of CSO-PVS with the longitudinal change of ADNI-MEM in participants with low and high tau/Aβ42. Data were analyzed using a mixed linear regression model with ADNI-MEM as dependent variable, and age, gender (female as reference), education, diagnosis (CN as reference), APOE4 presence (no gene presence as reference), t-tau/Aβ42 ratio, baseline ADNI-MEM, TIV and CSO-PVS (none/mild as reference) as covariates. β value, standard error (SE) and p value were reported. *represents significant p values
ADNI, Alzheimer’s Disease Neuroimaging Initiative; CN, control; CSO, centrum semi-oval; FDG-PET, fluorodeoxyglucose positron emission tomography; MEM, memory; PVS, perivascular space; SE, standard error; TIV, total intracranial volume.
The associations of CSO-PVS with the longitudinal change of ADNI-EF in participants with low and high tau/Aβ42. Data were analyzed using a mixed linear regression model with ADNI-EF as dependent variable, and age, gender (female as reference), education, diagnosis (CN as reference), APOE4 presence (no gene presence as reference), t-tau/Aβ42 ratio, baseline ADNI-EF, TIV and CSO-PVS (none/mild as reference) as covariates. β value, standard error (SE) and p value were reported. *represents significant p values
ADNI, Alzheimer’s Disease Neuroimaging Initiative; CN, control; CSO, centrum semi-oval; EF, executive function; FDG-PET, fluorodeoxyglucose positron emission tomography; PVS, perivascular space; SE: Standard error; TIV, total intracranial volume.
DISCUSSION
In this study, we substantiated the concept of PVS as an indicator for brain metabolism and cognitive performance among cognitively normal individuals and MCI participants. We found the significant association of CSO-PVS with brain FDG-PET, and identified the predictive value of CSO-PVS for FDG-PET and cognitive decline during the progression of amyloid pathology. However, no indicative effects were indicated for BG-PVS.
AD neurodegeneration is characterized by Aβ deposition, tauopathy, and neuronal loss. However, the potential mechanism is so complicated, and the gap in current knowledge encourages the exploration of new theories. PVS plays an important role in the drainage system in the brain, facilitating the movement and drainage of fluid to clear protein aggregates and metabolic wastes. The impairment of glymphatic drainage system, which could be reflected by excessive PVS, contributes to neurodegeneration, such as cerebral amyloid angiopathy [16], as well as Aβ and tau deposits [17, 18]. Our findings of the association between PVS and brain FDG-PET emphasized the link between the drainage system of the brain and neurodegeneration. We discovered the predictive significance of CSO-PVS in individuals with high amyloid status, indicating the potential relationship between this marker and amyloid pathology. This is consistent with a previous study by Banerjee et al. [8], which indicated that CSO-PVS was independently associated with clinically diagnosed AD, but not with subcortical vascular cognitive impairment. This evidence suggests a close connection between CSO-PVS and amyloid pathology. Interestingly, although the presence of PVS in BG and CSO was found to be consistent in the study, the indications of brain metabolic status did not involve BG-PVS among those with high tau/Aβ42, as they were with CSO-PVS. Previous studies have evaluated the anatomical characteristics of PVS in the two regions. BG-PVS is formed by two layers of leptomeninges along the arterioles that perforate through the base of the brain. The inner layer is closely applied to the arteriolar wall and the outer membrane is contiguous with the pia mater. The structure makes PVS directly connect with CSF in the basal subarachnoid cisterns; CSO-PVS is formed by one leptomeningeal layer, which is closely applied to the vessel wall. These spaces communicate with the subpial, but do not penetrate the subarachnoid space [19, 20]. Thus, these seems to support that BG-PVS should be more deeply involved in the drainage system, because the former directly communicates with the subarachnoid space.
However, imaging studies using gadolinium as an imaging tracer to observe fluid exchange pathways found that little gadolinium uptake into BG-PVS [5]. Patients with normal pressure hydrocephalus have also shown a low uptake rate of gadolinium into BG-PVS [5]. This evidence, along with our findings indicated that the prominence of BG-PVS might simply be an epiphenomenon that frequently accompanies prominent CSO-PVS. Future studies should be performed to explore how PVS in the two regions get involved in the drainage system remains.
The study further explored the associations of PVS with cognitive performance. We did not detect any relationship between cognition and BG-PVS. However, marked findings were seen in the exploration of CSO-PVS. Thus, our results set the priority of PVS in CSO over that in BG, which echo with the previous indications based on FDG-PET by the imaging marker. However, Huijts et al. [21] found that BG-PVS, but not CSO-PVS was negatively correlated with information processing speed in patients with cerebral small vessel disease. In patients with Parkinson’s disease, BG-PVS is an independent positive predictor of future cognitive decline [7]. These studies identify BG-PVS as an indicator of cognitive performance. Yet, a meta-analysis published in 2018 found that PVS was not associated with cognitive dysfunction among the general population [22]. It remains unclear whether and how PVS is related to cognitive function.
We are fully aware that visual rating of PVS is somewhat not a highly accurate means of exploring the severity of small vessel pathology in the brain. Advances in neuroimaging have enabled anatomical evaluation and computational quantification of PVS counts and volume [23, 24]. Although many studies have quantitatively evaluated the marker, no standard quantitative methods or guidelines are available for longitudinal PVS evaluation. Such analysis may not be readily applicable to individuals. Indeed, PVS rating scale is relatively insensitive and is limited by floor and ceiling effects. However, this approach could be rapidly and easily carried out in clinical practice with good reliability and repeatability [25].
In conclusion, PVS in BG and CSO differentially predicted individual-level brain FDG-PET among people based on brain amyloid pathology. The study implicates the potential involvement of CSO-PVS as a factor contributing to brain metabolism and cognitive decline associated with amyloid pathology.
Footnotes
ACKNOWLEDGMENTS
Data collection and sharing for this project was funded by the Alzheimer’s Disease Neuroimaging Initiative (ADNI) (National Institutes of Health Grant U01 AG024904) and DOD ADNI (Department of Defense award number W81XWH-12-2-0012). ADNI is funded by the National Institute on Aging, the National Institute of Biomedical Imaging and Bioengineering, and through generous contributions from the following: AbbVie, Alzheimer’s Association; Alzheimer’s Drug Discovery Foundation; Araclon Biotech; BioClinica, Inc.; Biogen; Bristol-Myers Squibb Company; CereSpir, Inc.; Cogstate; Eisai Inc.; Elan Pharmaceuticals, Inc.; Eli Lilly and Company; EuroImmun; F. Hoffmann-La Roche Ltd and its affiliated company Genentech, Inc.; Fujirebio; GE Healthcare; IXICO Ltd.; Janssen Alzheimer Immunotherapy Research Development, LLC.; Johnson Johnson Pharmaceutical Research Development LLC.; Lumosity; Lundbeck; Merck Co., Inc.; Meso Scale Diagnostics, LLC.; NeuroRx Research; Neurotrack Technologies; Novartis Pharmaceuticals Corporation; Pfizer Inc.; Piramal Imaging; Servier; Takeda Pharmaceutical Company; and Transition Therapeutics. The Canadian Institutes of Health Research is providing funds to support ADNI clinical sites in Canada. Private sector contributions are facilitated by the Foundation for the National Institutes of Health ( ). The grantee organization is the Northern California Institute for Research and Education, and the study is coordinated by the Alzheimer’s Therapeutic Research Institute at the University of Southern California. ADNI data are disseminated by the Laboratory for Neuro Imaging at the University of Southern California.
This is study is also supported by the Science and Technology Plan Project of Guangdong Province (2019B030316001), and Guangzhou Municipal Key Discipline in Medicine (2021–2023).