
Abstract
Background:
Effective treatment of Alzheimer’s disease (AD) will hinge on early detection. This has led to the search for early biomarkers that use non-invasive testing. One possible early biomarker is auditory temporal processing deficits, which reflect central auditory pathway dysfunction and precede cognitive and memory declines in AD. Gap detection is a measure of auditory temporal processing, is impaired in human AD, and is also impaired in the 5XFAD mouse model of AD. Gap detection deficits appear as early as postnatal day 60 in 5XFAD mice, months before cognitive deficits or cell death, supporting gap detection as an early biomarker. However, it remains unclear how gap detection deficits relate to the progression of amyloid pathology in the auditory system.
Objective:
To determine the progression of amyloid pathology throughout the central auditory system and across age in 5XFAD mice.
Methods:
We quantified intracellular and extracellular antibody labelling of Aβ42 in 6 regions of the central auditory system from p14 to p150.
Results:
Pathology appeared first in primary auditory cortex (A1) as intracellular accumulation of Aβ42 in layer 5 pyramidal neurons by age p21. Extracellular plaques appeared later, by age p90, in A1, medial geniculate body, and inferior colliculus. Auditory brainstem structures showed minimal amyloid pathology. We also observed pathology in the caudal pontine reticular nucleus, a brainstem structure that is outside of the central auditory pathway but which is involved in the acoustic startle reflex.
Conclusion:
These results suggest that Aβ42 accumulation, but not plaques, may impair gap detection.
Keywords
INTRODUCTION
According to the World Health Organization, approximately 36 million people worldwide live with Alzheimer’s disease (AD), a number that is expected to grow by 6.5 million each year. Because molecular, cellular, and network damage starts to occur decades before overt memory and cognitive symptoms, any treatment of AD is most likely to be effective if initiated early in the disease progression [1]. It is therefore crucial to identify biomarkers that arise much earlier than cognitive and memory deficits [2]. Maximal value for a biomarker comes from a full neurobiological understanding of what is being measured and how it relates to disease progression. Transgenic mouse models are especially useful toward this end as potential biomarkers can be tested in the genetically-verified disease state.
One hallmark of the progression experienced by patients with AD is a decline in communication skills. In addition to reflecting hearing loss potentially associated with damage to peripheral structures, this decline involves impaired temporal processing and speech perception, implying central auditory dysfunction [3–5]. Because these temporal processing deficits precede the development of cognitive and memory deficits, they may aid in the diagnosis of prodromal AD [2, 3]. Gap detection is a well-established and easily administered test of temporal acuity in humans and animals [6]. Gap detection deficits have been correlated with impaired speech perception in older adults independent of hearing loss [7, 8]. Gap detection deficits are also seen in patients diagnosed with mild cognitive impairment (MCI) [9], including but not limited to early-stage AD [10, 11]. As such, gap detection may serve as a useful biomarker for the disease.
Early-onset gap detection deficits also occur in 5XFAD mice, a well-established mouse model of AD. This mouse model co-expresses 5 human familial AD mutations and has proven to be especially valuable due to its rapid recapitulation of many hallmarks of the disease, especially amyloid pathology [12]. Pathology in this mouse is characterized by intracellular accumulation of the amyloid-β peptide Aβ42, followed by development of extracellular plaques, and finally neuronal death. We recently demonstrated impaired gap detection in 5XFAD mice as early as 2 months of age [13, 14]. This is 2–4 months before any evidence of cognitive or memory dysfunction [12, 15–18], and at least 4 months before the first signs of neuronal death [18, 19]. These mice also show deficits in neuronal responses to gap-in-noise stimuli as early 2–4 months of age in auditory cortical neurons [14]. These findings are consistent with the decrease in temporal acuity in preclinical AD. However, it remains unknown when and where amyloid pathology occurs in the auditory system in 5XFAD mice or other mouse models of AD [12, 18–21].
Here we examined the progression of amyloid pathology in the central auditory system in 5XFAD mice. We used antibody labelling to measure Aβ42 in six different sites in the central auditory pathway, including the cochlear nuclei, superior olivary complex, nucleus of the lateral lemniscus, inferior colliculus (IC), medial geniculate body of the thalamus (MGB), and primary auditory cortex (A1), at a range of ages from postnatal day p14 to p150. Our goal was two-fold. First, to determine where in the central auditory pathway pathology first manifests. Second, to understand how that pathology progresses over time. Pathology first appeared in A1 as intracellular accumulations of Aβ42 in layer 5 pyramidal neurons, seen at p21, with extracellular aggregates of Aβ42 (plaques) developing around p90. Cortical plaque load was denser in females than males. Pathology in auditory midbrain regions MGB and IC was restricted almost exclusively to extracellular plaques, also beginning around p90. The auditory brainstem was largely spared. We also observed pathology in the caudal pontine reticular nucleus (PRNc), a brainstem structure that is outside of the central auditory pathway but which is involved in the acoustic startle reflex. These findings largely recapitulate AD-associated pathology in the human central auditory system and provide anatomical correlates of the behavioral and neural gap detection deficits seen in this mouse model of AD.
METHODS
All procedures were performed in accordance with the National Institutes of Health guidelines, as approved by the University of Oregon Animal Care and Use Committee.
Mice
Mice ranged in age from postnatal day p14 to p150. Mice were heterozygous for 5XFAD (n = 61 mice, 31 females and 30 males, stock number 006554, The Jackson Laboratory) on a C57BL6/SJ1 hybrid background (stock number 100012, The Jackson Laboratory), with wild-type C57BL6/SJ1 littermates as controls (n = 25 mice, 16 females and 9 males). This background is heterozygous for the retinal degeneration mutation Pde6brd1, which causes blindness in Pde6brd1 homozygous mice. Offspring homozygous for Pde6brd1 were excluded from this study. We tested mice at ages postnatal day 14, 21, 30, 45, 60, 90, 120, and 150. Ages p21-p150 included 4 male and 4 female mice at each time point. Age p14 included 3 male and 2 female mice.
Sectioning
Mice were perfused transcardially with 0.1 M phosphate buffered saline (PBS) followed by 4% paraformaldehyde in PBS (60 ml, 2 ml/min). Brains were removed and post-fixed for an additional 24 h in 4% paraformaldehyde, then sectioned or transferred to PBS containing 0.01% sodium azide. Brains were then sectioned at 30μm in the coronal plane and collected in PBS. We were interested in characterizing disease progression in 6 different regions of the central auditory pathway, including the cochlear nuclei, the superior olivary complex, the nucleus of the lateral lemniscus, the inferior colliculus, the medial geniculate body, and primary auditory cortex. To accomplish this, we selected 6 sections from each brain that included one or more of each of these structures and performed immunohistochemistry on them. Thus, we performed immunohistochemistry on a total of 516 sections from 86 mice.
Immunohistochemistry
Free-floating sections were washed in PBS with 0.4% Triton and then blocked in 3% normal goat serum (Abcam; ab7481) for 1 h. Sections were then incubated with rabbit monoclonal anti-Aβ42 (1 : 1000; Invitrogen; 700254) primary antibody at 4°C on a shaker for 22 h. Sections were then rinsed thoroughly (3 x 5 min) in PBS with 0.4% Triton and incubated with Alexa Fluor 488 secondary antibody (1 : 1000; ThermoFisher; A-11034) on a shaker for 2 h at room temperature. Following a second thorough rinse in PBS, sections were mounted on charged slides, allowed to dry completely, then coverslipped with DAPI Fluoromount-G (SouthernBiotech; 0100-20). Sections from four brains were processed in parallel, with at least one brain coming from a control (wild-type) mouse.
Imaging, boundary determination, and quantification
Photomicrographs were taken using a Zeiss Imager A.2 microscope with AxioCam MRm camera and X-Cite 120Q light source and captured using Zen 3.1 software. Low magnification images (12.5X to 50X) were taken for alignment with sections in the Allen Mouse Brain Common Coordinate Framework (CCFv3) online atlas (https://scalablebrainatlas.incf.org/mouse/ABA_v3) as described below. High magnification images were taken to enable quantification of antibody-labelled neurons and plaques (200X), and DAPI-labelled cells (100X). Images were captured at multiple focal depths to ensure accurate identification of, and discrimination between, intracellular and extracellular label.
Quantification of cells and plaques was performed manually using Canvas X software (ACD Systems). Labelled cells had well-defined cell membranes with evidence of processes and/or distinct nuclear and cytoplasmic compartments and were clearly distinct from auto-fluorescence observed in corresponding sections from control mice. We observed two types of plaques: dense core plaques and diffuse aggregations of extracellular Aβ42. We did not attempt to differentiate between dense core and diffuse plaques, instead counting both types together simply as “plaques”.
Quantification was performed blind to genotype, sex, age, and to regional and laminar boundaries. Labelled cells and plaques were counted in each section. Sites at which label was observed were marked specifically as cells or plaques. Following identification of all intracellular and extracellular label within the field of view, boundaries for the region of interest were applied, and the markers for each type were quantified within the region. We then counted DAPI-labelled cells in each region of interest. In general, we did not attempt to differentiate cell types, either for DAPI label or Aβ42 antibody label, instead counting all cell types together simply as “cells”.
Boundaries, including subdivisions, were obtained by aligning sections to the CCFv3 atlas using an affine transformation based on local landmarks visible in DAPI (blue) and antibody (green) fluorescence channels. For primary auditory cortex, laminar boundaries were determined as previously described [22, 23]. Briefly, layers 1, 2, 3, and 4 each represent 12.5% of the cortical thickness from the pial surface, and layers 5 and 6 each represent an additional 25%. We further subdivided layers 5 and 6 into two equal sublayers, to generate a finer-grained measure of cell and plaque density across layers. The area of each region of interest was calculated by calibrating image size using a stage micrometer (2 mm-200 division KR867, Microscope World). Quantification of DAPI-labelled cells within each region of interest was performed using ImageJ (https://imagej.nih.gov/ij/).
Statistical analysis
Analyses were performed to assess change over time of label within each region of interest, as well as differences between males and females. All comparisons were performed using non-parametric analyses because some comparisons involved non-normally distributed data (Lilliefors test). Comparisons across ages or between multiple structures (e.g., cortical layers, subregions) were performed using the Kruskal-Wallis (K-W) test. Post-hoc analyses were performed using the Mann-Whitney (M-W) test. Bonferroni correction for multiple comparisons was applied when appropriate. Comparisons between males and females were performed using the Mann-Whitney test. We report effect sizes as eta-squared (η2) [24]. η2varies between 0 and 1 and corresponds to the proportion of variance in the dependent variable explained by the independent variable. η2 values of 0.01–0.06 are generally considered to be small effects, η2 of 0.06–0.14 moderate effects, and η2>0.14 large effects. Analyses involving Aβ42 + cells were performed as a proportion relative to all DAPI-labelled cells in a given region (“% Aβ42+ cells”). Analyses involving labelled plaques were performed in terms of plaque density (“plaques/mm2”) [25]. Analyses were performed by mouse (for example, a single value would be considered per mouse for % Aβ42+ cells in layer 5A of cortex).
RESULTS
Understanding disease progression in the 5XFAD mouse model of AD will provide important insight into the underlying basis of early biomarkers of AD in humans. Here we sought to determine when and where AD-associated pathology appears in the central auditory pathway of 5XFAD mice, how it progresses across the lifespan, and whether there are sex-linked differences in this progression. We specifically examined primary auditory cortex (A1), MGB, IC, nucleus of the lateral lemniscus (nLL), superior olivary complex (SOC), and the cochlear nuclei (CN).
Primary auditory cortex
Amyloid pathology in the central auditory pathway of Aβ42+ mice appeared first in A1 (Fig. 1A). Early in the disease progression, this label was exclusively intracellular, with accumulation clearly evident throughout the soma surrounding the Aβ42-free, DAPI-labelled nucleus (Fig. 1B). At p14, we saw intracellular accumulation of Aβ42 in only a single neuron from one of five 5XFAD+mice examined. By p21, we observed Aβ42+ neurons consistently across mice, and in numbers that increased with age (Fig. 1C, Table 1). Intraneuronal accumulation of Aβ42 (see Fig. 1B) was clearly distinguishable from extracellular deposits that appeared much later (p90, see Fig. 2), consistent with previous studies ([12, 19], see Methods for details). Antibody labelling of cortical neurons was restricted predominantly to layer 5A (Fig. 1D, Table 1), though an increasing number of Aβ42+ neurons were also observed in layer 5B as mice aged (Fig. 1E). Peak density of Aβ42+ neurons in layer 5A was 10.7% at p90, declining slightly to 9.2% at p150. This slight decrease in Aβ42+ neurons in the oldest mice is probably not due to cell death, because the proportion of DAPI-labelled cells in L5A did not vary as a function of age (Fig. 1F), and cortical neuron loss in 5XFAD mice has not been reported until much later, starting at 9–12 months (for review, see [26]). Rather, we suspect that the increased plaque load at older time points, described below, may have visually obscured the presence of Aβ42+ neurons. The density of DAPI-labelled cells varied as a function of layer (Fig. 1G, Table 1), with densities in L5A and L5B significantly lower than all other layers except for layer 1 (multiple comparisons significance threshold: p < 0.007). We saw no evidence of intracellular antibody label in control mice (for examples, see “p30 WT control” and “p90 WT control” in Fig. 1A).
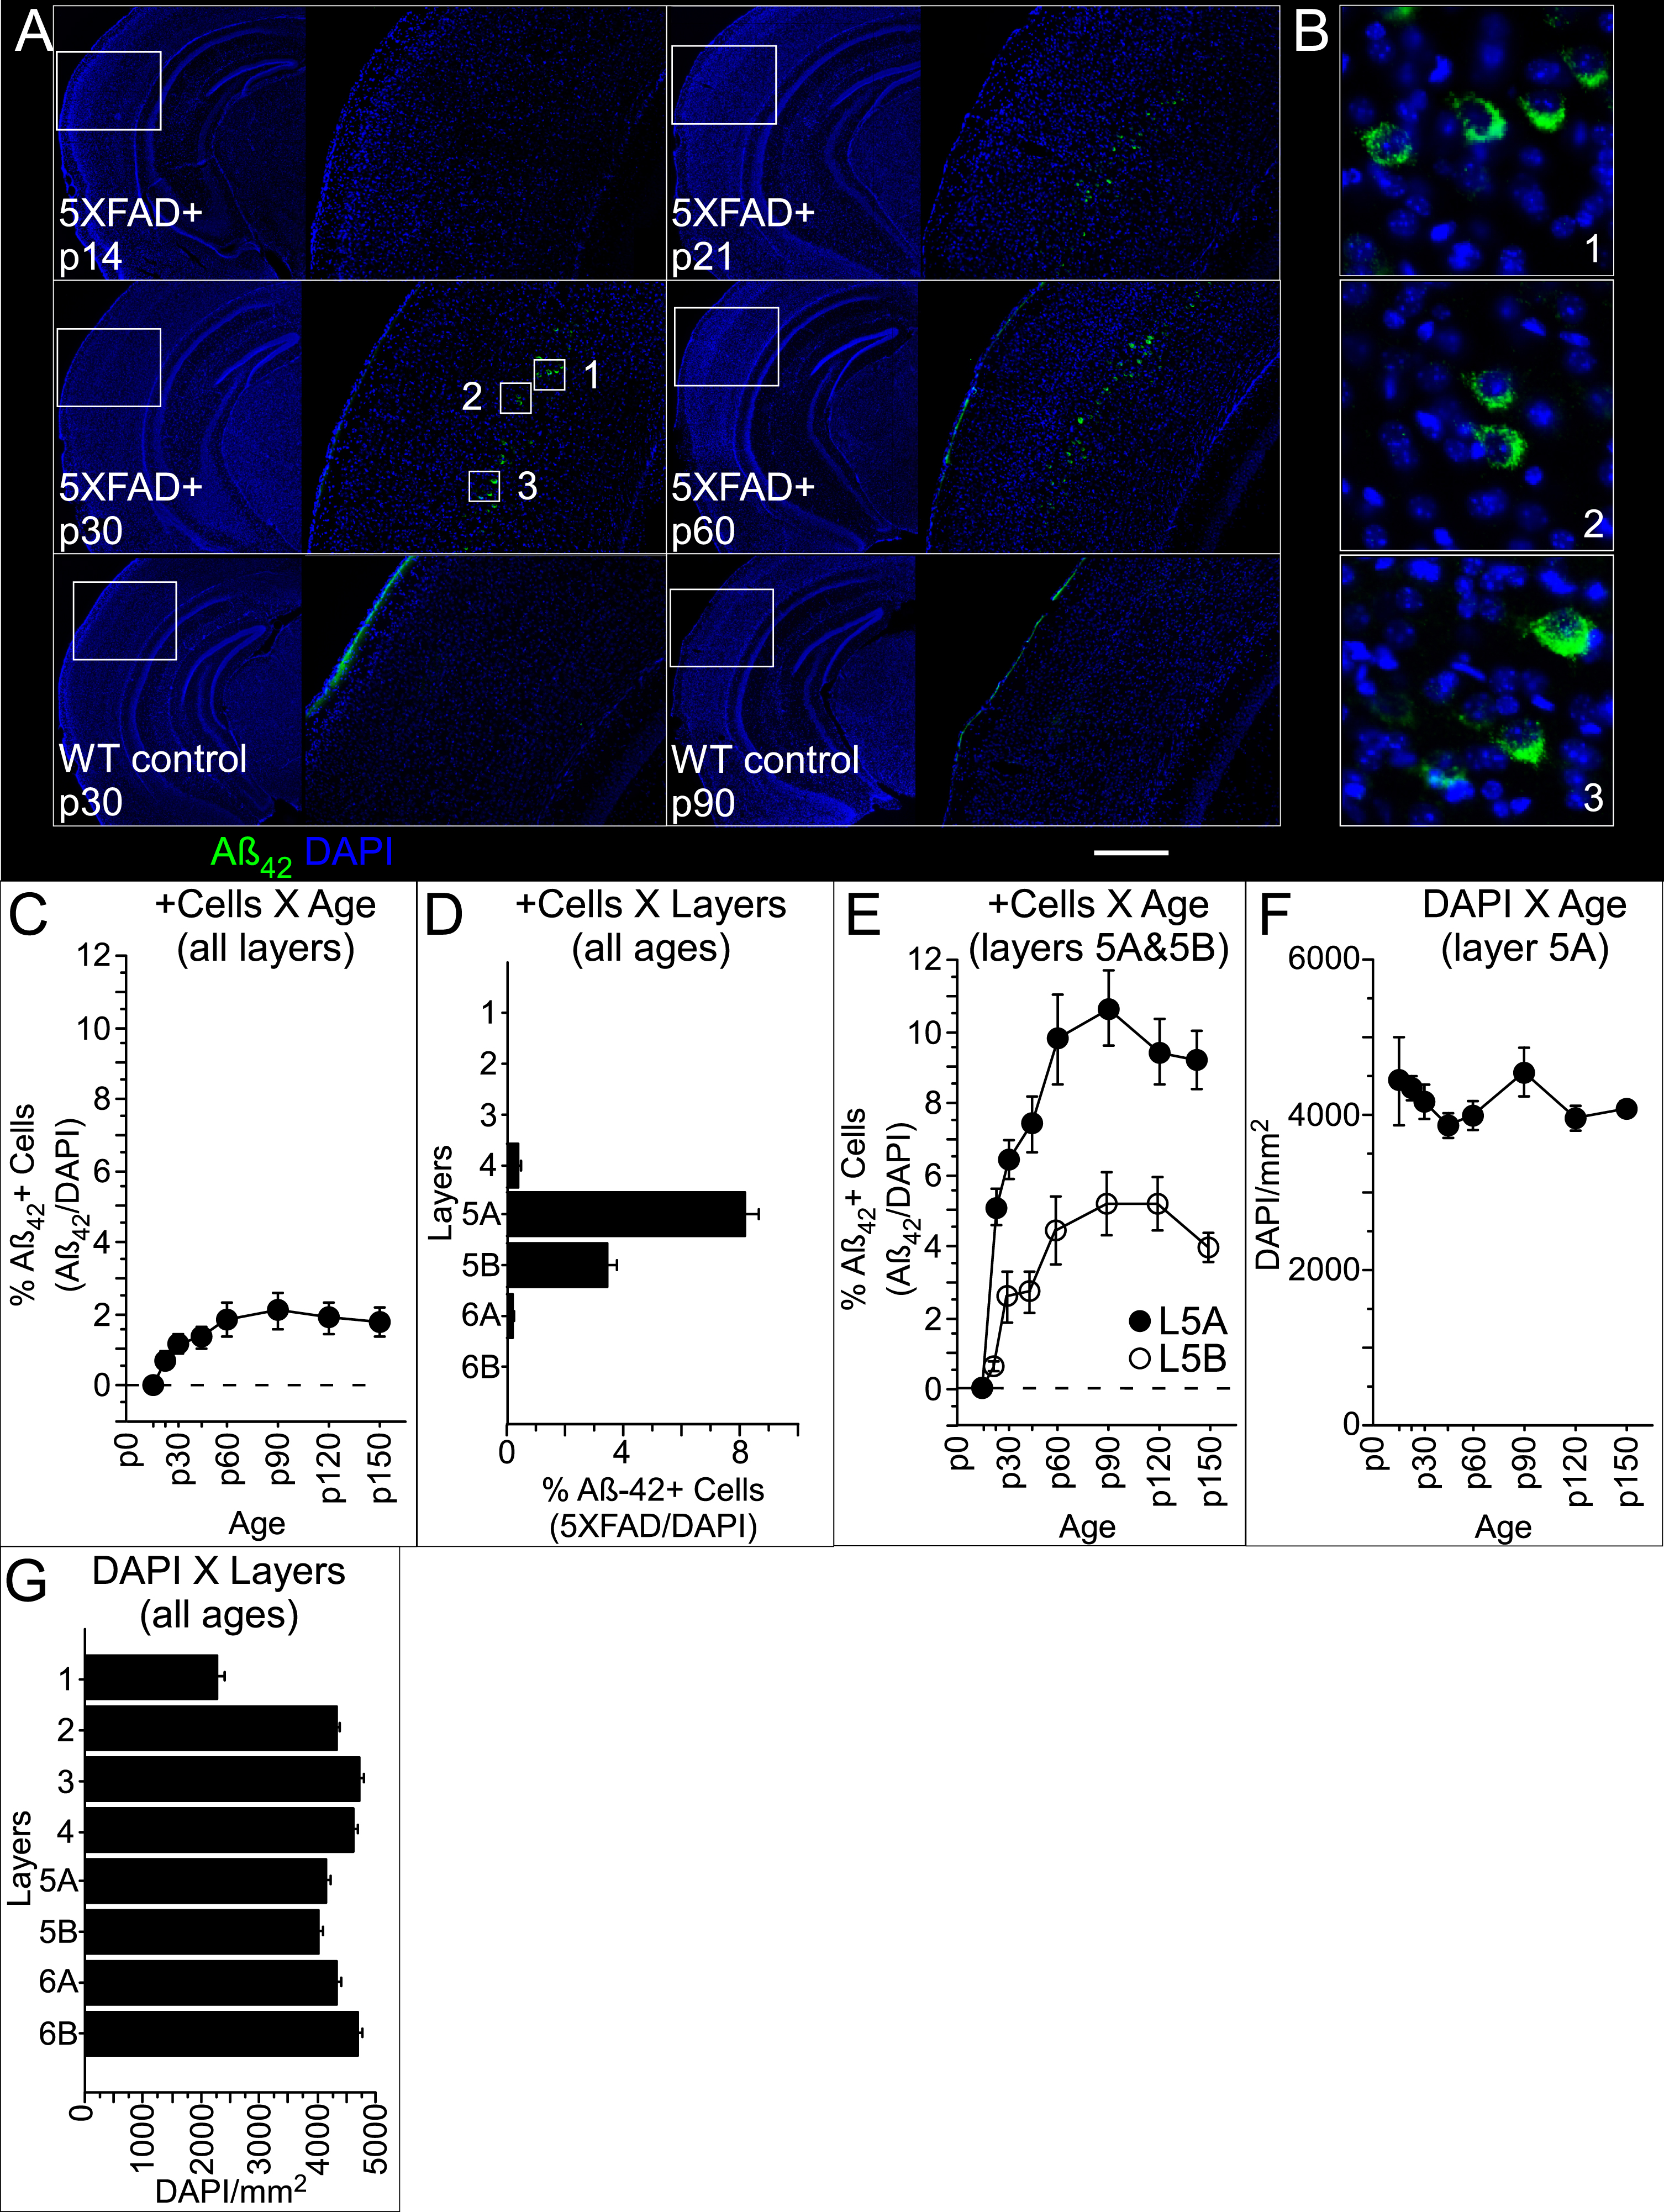
In contrast to the narrow laminar distribution of Aβ42+ neurons in A1, which were only in L5, we observed extracellular plaques in both superficial and deep layers (Fig. 2A). Extracellular plaques were clearly distinguishable from intracellular Aβ42 label (open arrows in Fig. 2A). The first sign of aggregation of Aβ42 into extracellular plaques occurred at p90, and plaque density then increased with age, reaching a mean at p150 of 92.9±12.9 S.E. plaques/mm2 (Fig. 2B, Table 1). Between p90 and p150, plaque density varied by layer (Fig. 2C; Table 1). The density in layer 1 was more than double the mean density across layers 2–4 (17±5.9 versus 8.0±1.8 S.E. plaques/mm2, respectively; Fig. 2C) and was greatest in layer 6A (146.7±24.4 S.E. plaques/mm2). During this same period (p90-p150), plaque density in females significantly exceeded that seen in males (Table 1), a difference that was most robust in L6A (Fig. 2D, Table 1), though no difference by layer reached significance when correcting for multiple comparisons (significance threshold: p = 0.006). We saw no evidence of extracellular antibody label in control mice at any age.

Statistics for Aβ42+ cell (Aβ42+/DAPI) and plaque (per mm2) density in auditory cortex
Significance threshold K-W: p <.05; M-W: p <.05.
Subiculum
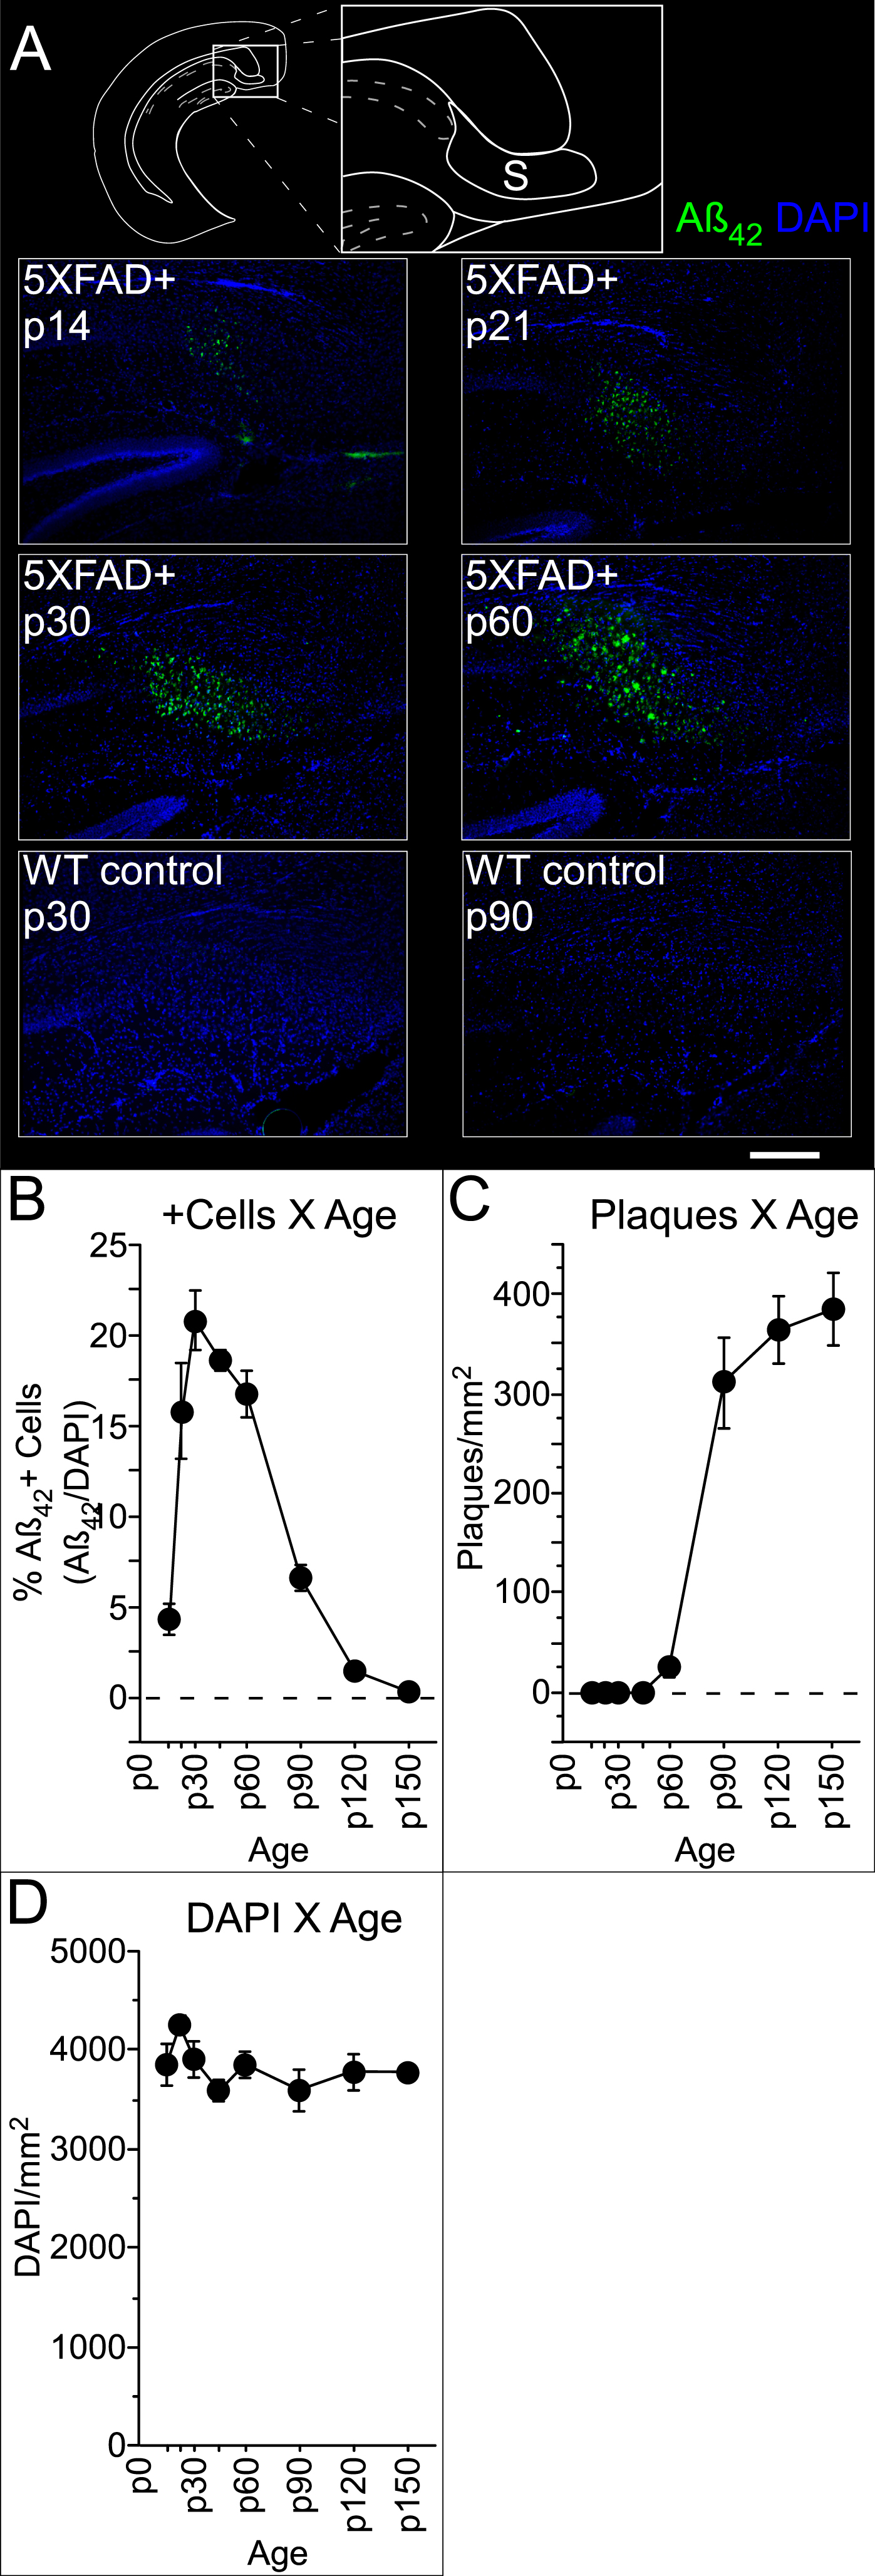
We also quantified labelled cells and plaques in the subiculum, as this was in the same section as A1 and MGB and consistently exhibited pathology earlier than anywhere in the central auditory pathway, effectively providing a within-section positive control for antibody label. In the subiculum, Aβ42+ cells were present by p14 and extracellular plaques by p60 (Fig. 3A). Early in the progression, Aβ42+ cells were congregated immediately adjacent to the CA1 pyramidal cell layer and are thus likely in the prosubiculum. However, as we did not perform the histological tests necessary to distinguish between different compartments of the subicular complex [27], we use the general term “subiculum” to refer to this area. As seen in auditory cortex, the density of Aβ42+ cells in subiculum changed over time (Fig. 3B, Table 2), reaching a peak at p30, then dropping steeply between p60 and p90. This drop coincides with a significant increase in plaque density (Fig. 3C, Table 2). Importantly, the density of DAPI-labelled cells did not vary as a function of age (Fig. 3D). This, and previous work reporting that cell death in the 5XFAD mouse subiculum only begins around 9 months of age [19], suggests that Aβ42+ cells become obscured by the rapidly accumulating number of plaques. This effect probably also explains the more modest decrease in Aβ42+ cells that we saw in auditory cortex at the oldest ages (Fig. 1C, E). We observed no sex-linked differences. We also saw no evidence of intracellular or extracellular label in the subiculum of control mice (for examples, see “p30 WT control” and “p90 WT control”, respectively, in Fig. 3A).
Statistics for Aβ42+ cell (Aβ42+/DAPI) and plaque (per mm2) density in the subiculum
Significance threshold K-W: p <.05.
Medial geniculate body
In contrast to the progression observed in cortex and subiculum, with Aβ42+ cells followed by plaques, the pathology in the MGB was characterized almost exclusively by plaques. Quantification was performed in the same coronal section containing both auditory cortex and subiculum (Fig. 4A). The MGB on average included 1300±34 S.E. DAPI-labelled cells, with cell density in the ventral MGB exceeding that of the dorsal and medial subregions (MGv, MGd, and MGm, respectively; Table 3). Intracellular labelling of Aβ42 was observed in only 5 of 61 mice, with no more than 1-2 putative Aβ42+ cells seen in any one mouse. In contrast to the paucity of intracellular label, plaques were observed throughout MGd, MGv, and MGm (Fig. 4A inset). Plaques were first observed at p90, and plaque density increased significantly with age, reaching a mean of 180.4±23.7 S.E. plaques/mm2 by p150 (Fig. 4B, Table 3). Within this timeframe (p90-p150), density varied significantly among subregions (Fig. 4C, Table 3). However, no difference between pairs of subregions reached significance when correcting for multiple comparisons (significance threshold: p = 0.016). No sex-linked differences reached significance, though we observed a trend toward a higher plaque load in females (p = 0.07, η2 = 0.13, M-W). We saw no evidence of intracellular or extracellular label in the MGB of control mice (for example, see “p150 WT control” in Fig. 4A).

Statistics for Aβ42+ plaque (per mm2) density in the medial geniculate body
Significance threshold K-W: p <.05; M-W multiple comparisons: p <.017.
Inferior colliculus
The progression of pathology in the IC was similar to that observed in the MGB in that plaques were far more prevalent than Aβ42+ cells. Aβ42+ cell density was very low but did vary as a function of age (Table 4), with the first cells appearing at p30, and roughly doubling in number between p90 and p150. Cell density also varied among subregions (Table 4), with the external cortex (eIC) exhibiting a higher Aβ42+ cell density than both the dorsal cortex (dIC) and central nucleus (cIC; though the latter failed the significance threshold for multiple comparisons of p < 0.017; Table 1). However, at no age did Aβ42+ cell density exceed 0.5%. For comparison, peak Aβ42+ cell density in L5A of auditory cortex was 10.7%. In contrast, plaques were densely distributed throughout the IC (Fig. 5A). Plaque density varied significantly with age, with plaques first appearing around p90 and reaching a peak mean density at p150 of 106.2±16.2 S.E. plaques/mm2 (Fig. 5B, Table 4). During the p90-p150 timeframe, plaque density also varied significantly among eIC, dIC, and cIC (Fig. 5C, Table 4) with the highest density observed in eIC, followed by dIC. No significant differences in plaque density were detected between the sexes. We saw no evidence of intracellular or extracellular label in the IC of control mice (for example, see “p120 WT control” in Fig. 5A).
Statistics for Aβ42+ cell (Aβ42+/DAPI) and plaque (per mm2) density in the inferior colliculus (IC)
Significance threshold K-W: p <.05; M-W multiple comparisons: p <.017.

Superior olivary complex, nucleus of the lateral lemniscus, and cochlear nuclei
AD-associated pathology in the auditory brainstem was exceptionally scarce, despite ample evidence of pathology in other brainstem structures. As illustrated in Fig. 6A, β42+ cells and/or plaques were present throughout the brainstem by p150. Especially at low magnification, the SOC in Fig. 6A is notable for the absence of fluorescence amidst neighboring brainstem structures. We observed a sufficient number of Aβ42+ cells in SOC to determine that their density did vary as a function of age (Fig. 6B, Table 5). However, at no age did cell density exceed 0.5% in either males or females. For comparison, peak Aβ42+ cell density in L5A of auditory cortex was 10.7%. Plaques in the SOC were exceptionally rare, with only 3 plaques in total observed in 2 of 61 mice, all in the lateral SOC. We saw no evidence of Aβ42+ cells or plaques in either the nLL or the CN (Fig. 6C, D). We also saw no evidence of intracellular or extracellular label in the SOC, nLL, or CN of control mice.

Statistics for Aβ42+ cell (Aβ42+/DAPI) density in the superior olivary complex
Significance threshold K-W: p <.05.
Caudal pontine reticular nucleus
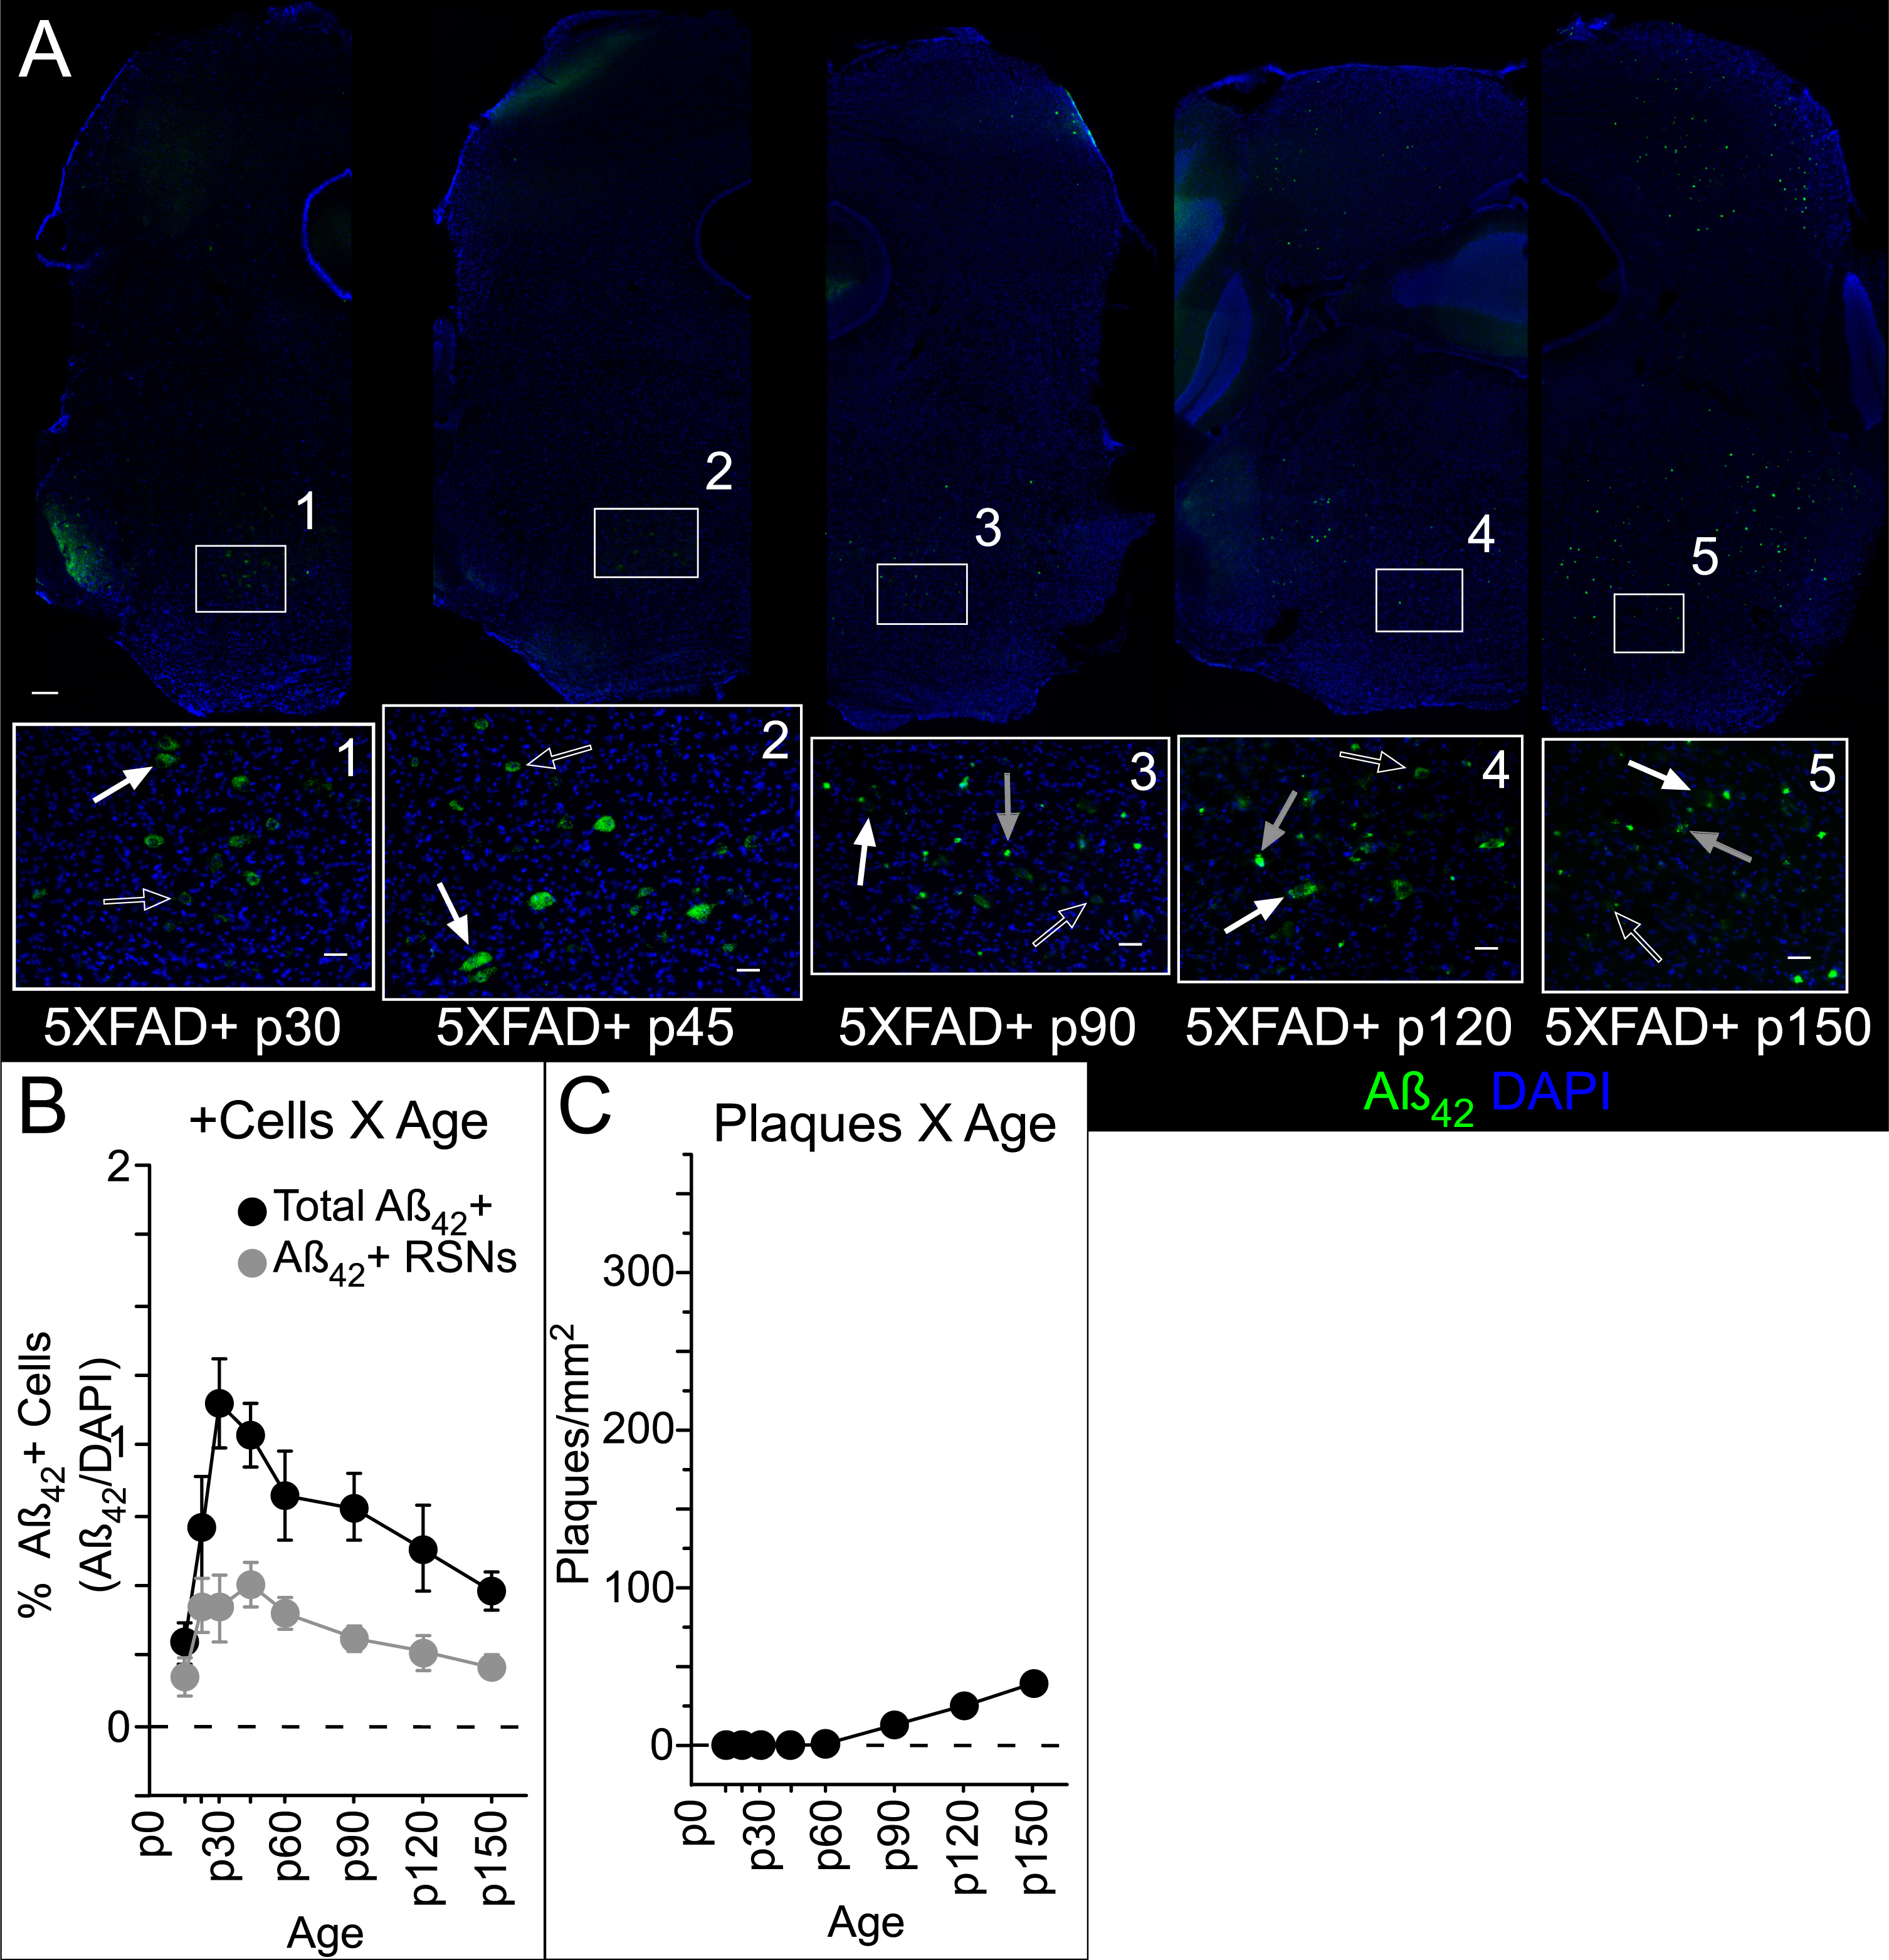
As mentioned above, we observed very little amyloid pathology in the auditory brainstem, but we did observe ample pathology in neighboring brainstem structures. One of these structures was the caudal pontine reticular nucleus (PRNc, see Fig. 6A), which is not part of the central auditory pathway but is involved in the acoustic startle reflex, and therefore may be relevant to startle-based measures of auditory gap detection, a potential early biomarker of AD. Giant (>40μm diameter) reticulospinal neurons (RSNs) in the PRNc receive acoustic input and project to motor neurons, forming a sensorimotor circuit underlying the acoustic startle reflex [28]. Putative giant RSNs in PRNc were easily recognizable based on size (Fig. 7A) [28]. We observed intracellular Aβ42 both in putative giant RSNs and other smaller cells in the PRNc as early as p14, and consistently by p21 (Fig. 7B). Because label was consistently restricted predominantly to ventrolateral PRNc, we quantified Aβ42+ and DAPI cells, as well as plaques, in an 800μm diameter circle centered on the region of highest apparent density and identified those Aβ42+ cells with a diameter > 40μm. The density of the overall Aβ42+ cell population varied with age, with a trend also seen specifically for RSNs (Fig. 7B, Table 6). Plaques, first evident at p90, also varied in density with age (Fig. 7C, Table 6). No sex-linked differences were observed, and no evidence of intracellular or extracellular label was observed in control mice.
Statistics for Aβ42+ cell (Aβ42+/DAPI) and plaque (per mm2) density in pontine reticular nucleus, including putative reticulospinal neurons (RSNs)
Significance threshold K-W: p <.05.
DISCUSSION
Here we characterized how pathology in the central auditory pathway of 5XFAD mice progresses through the first five months of life. We first observed intracellular Aβ42 in layer 5A of primary auditory cortex (A1), beginning around postnatal day 21. Intracellular Aβ42 remained restricted predominantly to L5A, with a smaller proportion of cells in L5B, through p150. We first observed plaques in A1 more than 2 months later, at p90, in both superficial and deep layers. Plaque load in females was greater than males. Pathology in both the MGB and IC was restricted primarily to plaques, beginning around p90 and growing in number through p150. In contrast, pathology in the SOC was almost exclusively intracellular, although as with IC, the overall proportion of positively-labelled cells was quite low (<0.5%). We saw no pathology in the nLL or the CN through p150. We believe this is the first comprehensive examination of how AD pathology progresses across the central auditory pathway, or that of any sensory system, in a mouse model of AD. These results help explain deficits in behavioral and neural gap detection in 5XFAD mice [13, 14], and enhance our understanding of the utility of auditory information processing as a biomarker for AD in humans.
Previous studies have reported that Aβ42+ cells in other neocortical regions are L5 pyramidal neurons [12, 21]. Our observations in auditory cortex are consistent with this idea. We found that cortical Aβ42+ neurons were located in L5, based on depth [22], an approach that we have determined previously to align well with electrophysiological data [23]. The lower density of DAPI-labelled cells at this depth relative to adjacent layers also matches expectations for L5 (for review, see [29]). Morphologically, these Aβ42+ cells appeared to be pyramidal neurons (see Fig. 2A), with clear evidence for proximal apical dendrites ascending from the apex of the soma. Based on the prevalence of pyramidal neurons in L5 [30], we estimate that at least 24% of L5A (and 11% of L5B) pyramidal neurons are Aβ42+ at 5 months of age. This corresponds closely to the 25% of L5 pyramidal neurons reported to be lost through apoptosis by 12 months of age in 5XFAD mice [19]. If Aβ42+ neurons in A1 are indeed pyramidal neurons, this suggests a mechanism for cortical plaque deposition. Both the dendrites and local axon collaterals of L5 pyramidal neurons branch throughout the layers of cortex (for reviews, see [31, 32]). Aβ42 accumulates in dendrites and post-synaptic terminals prior to the development of extracellular plaques [33–35, but see 36]. Aβ42 is also present in axons [33, 37–40]. Buxbaum and colleagues [37] reported an accumulation of AβPP in presynaptic terminals of entorhinal cortex neurons projecting to the hippocampus. Severing these axonal projections reduced Aβ accumulation in the extracellular space [41, 42]. Thus, exocytosis from dendrites and/or synaptic release from axons of L5 pyramidal neurons could explain the presence of plaques across the cortical column in A1.
Axonal transport and release of proteolyzed AβPP fragments could also explain the appearance of plaques in the medial geniculate body in the absence of local Aβ42+ cells. In cortex, subiculum, and inferior colliculus, Aβ42+ cells were first observed roughly 2 months prior to the appearance of plaques. In subiculum, plaque load grew so high by p90 that it hampered visualization of Aβ42+ cells. The stability of DAPI-labelled cell density over the same period argues against cell death as the explanation for the decline of Aβ42+ cells that we observed in the subiculum. Although multiple lines of evidence suggest that intracellular Aβ may lead to cell death [18, 43], this has not been reported to occur until 9–12 months of age in 5XFAD mice [19], much later than the decreased cell counts we observed starting at 2 months. In cortex, there was only a modest decline in L5B cell counts at p150 when plaque density there would have been well above 100 plaques/mm2. It therefore seems unlikely that we would have been unable to detect Aβ42+ cells in MGB because they were obscured by the modest plaque load of 50.4±17.8 plaques/mm2 observed at p90. Thus, plaques in MGB most likely are the result of deposition from axons originating elsewhere in the brain. The Aβ42+ pyramidal neurons we observed in auditory cortex are one possible source of these axons. Although we did not quantify them here, we observed Aβ42+ cells in fields of auditory cortex outside of A1 (Fig. 1A), and thus multiple auditory cortical fields could contribute Aβ42+ axonal projections to MGB.
The IC also showed predominantly plaques, with very few Aβ42+ cells (<0.5%), and it therefore seems unlikely that ascending axons from Aβ42+ IC cells contribute to plaque formation in MGB. Aβ42+ cells first appeared in IC at p30 and increased modestly in number over time. Most were in eIC, with fewer in cIC, and the fewest in dIC. Plaques were far more prevalent in all three regions, and plaque density in eIC and dIC exceeded that in cIC (see Fig. 5A). The lower plaque load in cIC might be related to the axonal delivery of Aβ42. L5 pyramidal neurons project strongly to eIC and dIC, and less to cIC [44–47, see 48], which matches the pattern of plaque load.
The SOC is the only auditory brainstem region that we examined that showed any AD-associated pathology. We observed both positive cells and plaques, though both were in very low numbers. The density of Aβ42+ cells was very low (<0.5%) and did not appear to congregate specifically in lateral, medial, or periolivary subregions. Interestingly, the few plaques that we saw were in lateral SOC. These could in principle be due to axonal deposition by projections from cortical L5 neurons to lateral SOC.
We found no Aβ42+ cells or plaques in the nLL or CN. The 5XFAD transgenic mouse line was created by pronuclear injection of APP and PS1 transgenes using the mouse Thy1 promoter [12]. Thy1 is expressed in both nLL and CN (http://mouse.brain-map.org/experiment/show/68798025), so the absence of Aβ42 antibody labelling is not attributable simply to lack of the promoter (although transgenic Thy1 lines do not always recapitulate the endogenous Thy1 expression pattern, presumably due to insertional effects). The absence of plaques in the CN is curious, as the CN receives long-distance axonal projections from L5 pyramidal neurons in A1 [48–50, see 51]. If Aβ released by axonal projections from Aβ+ neurons (such as L5 pyramidal neurons) can aggregate into plaques, it is not clear why this does not occur in CN.
The pathology described here is largely consistent with that seen in human AD patients. There is extensive evidence of AD-specific changes in cortex [52–56]. Primary sensory cortices appear to be less affected than other regions [57]. In auditory cortex, pathology is seen at the level of plaques/neurofibrillary tangles and cytoarchitecture [58, 59], but is less evident at the gross volumetric level [60, 61]. Pathology has also been described in the MGB, though this may be specific to the ventral nucleus [58, 62]. Changes in the IC of human AD patients have been described, though it may be especially prevalent in central nucleus [58, 63–65]. The lack of Aβ42 antibody labelling in brainstem structures such as the CN, SOC, and nLL that we observed is consistent with an absence of pathology in brainstem nuclei of human AD patients [58, but see 67].
Pathology and temporal processing of auditory information
These results shed light on deficits in temporal processing of auditory information seen in 5XFAD mice during behavioral gap detection. Gap detection is commonly measured using a variant of pre-pulse inhibition, in which a silent interval embedded in continuous white noise (the “gap”) acts as a cue to reduce the startle elicited by a subsequent loud sound. The detection of long gaps is mediated by a midbrain and brainstem circuit from the auditory brainstem to IC, then to superior colliculus, and then to the pedunculo-pontine tegmental nucleus which provides inhibition to startle-related premotor neurons in the PRNc [28]. The detection of brief gaps (<64 ms) requires the additional involvement of auditory cortex [68–74], which acts via the major corticofugal projection to IC [73, 75–77].
We have previously demonstrated that both behavioral gap detection and neural encoding of gaps in auditory cortex are impaired in 5XFAD mice. Deficits begin around p60, grow progressively worse over time, and occur both for brief gaps and long gaps [13, 14]. These deficits are unlikely to be attributable to peripheral hearing loss [78]. Impairments in cortical gap responses and brief gap detection are consistent with Aβ42 accumulation and neural dysfunction in auditory cortex (Figs. 1 and 2) [12, 21]. In contrast, the impairments in long gap detection suggest the involvement of subcortical structures. The fact that we saw dense plaque load in the IC could explain the impairment of long gap detection.
How might Aβ42 accumulation in the auditory system of 5XFAD mice impact behavioral gap detection? Based on our results, it is clear that behavioral gap detection deficits arise prior to plaque formation in the central auditory pathway. This suggests that the behavioral deficits result from intracellular Aβ42 and/or extracellular soluble Aβ42, not from plaques. This adds to growing evidence that behavioral and cognitive dysfunction may be attributable to increased levels of soluble Aβ42 in the absence of any synapse loss, cell loss, or plaque accumulation [21, 80]. Intracellular and extracellular soluble Aβ42 disrupt synaptic transmission and network function, which could thereby impair auditory processing [81–89].
It also seems likely that the pathology we observed in the PRNc (Figs. 6 and 7) could contribute to behavioral gap detection deficits. Although not part of the central auditory pathway, the PRNc contains startle-related premotor neurons (the giant RSNs) and is part of the pre-pulse inhibition and acoustic startle pathways [28]. We observed intracellular Aβ42 in putative giant RSNs, and in other cells in PRNc, as well as extracellular plaques. This suggests that amyloid pathology in the PRNc could disrupt startle responses or pre-pulse inhibition. As in auditory cortex, plaque formation in PRNc occurs after the onset of behavioral gap detection deficits, but intracellular Aβ42 occurs earlier, suggesting that soluble Aβ42 but not plaques could potentially contribute to these deficits. The fact that gap encoding in auditory cortical neurons is impaired as early as behavioral deficits (at 2 months) indicates that auditory processing deficits contribute to behavioral gap detection deficits, but it remains unclear whether pathology in the PRNc also contributes, or what the relative contributions of damage in auditory and sensorimotor integration centers might be.