
Abstract
Patients with Alzheimer’s disease have difficulty maintaining independent living abilities as the disease progresses, causing an increased burden of care on family caregivers and the healthcare system and related financial strain. This patient group is expected to continue to expand as life expectancy climbs. Current diagnostics for Alzheimer’s disease are complex, unaffordable, and invasive without regard to diagnosis quality at early stages, which urgently calls for more technical improvements for diagnosis specificity. Optical coherence tomography or tomographic angiography has been shown to identify retinal thickness loss and lower vascular density present earlier than symptom onset in these patients. The retina is an extension of the central nervous system and shares anatomic and functional similarities with the brain. Ophthalmological examinations can be an efficient tool to offer a window into cerebral pathology with the merit of easy operation. In this review, we summarized the latest observations on retinal pathology in Alzheimer’s disease and discussed the feasibility of retinal imaging in diagnostic prediction, as well as limitations in current retinal examinations for Alzheimer’s disease diagnosis.
INTRODUCTION
Alzheimer’s disease (AD) is a neurodegenerative disease with high morbidity, which is progressive and irreversible and is the leading cause of dementia. The number of AD patients in China, currently more than 6 million, is expected to rise to more than 20 million through 2050 [1]. Intracellular amyloid plaques formed by amyloid-β (Aβ) peptides and neurofibrillary tangles by phosphorylated tau (p-tau) protein, two histopathological hallmarks of AD [2], jointly lead to neuronal death and synaptic disconnections, resulting in early symptoms in patients [3, 4]. AD patients usually progress from normal cognition to mild cognitive impairment (MCI), then to dementia eventually [5] when brain damage is hard to reverse with any therapies. Thus, early diagnosis for timely interventions can be helpful to halt or slow the disease progression, and developing sophisticated diagnostics for AD must be prioritized by researchers.
Current auxiliary examinations for AD diagnosis mainly comprise cerebrospinal fluid (CSF) protein analyses, magnetic resonance imaging (MRI), positron emission tomography (PET), and blood-based biomarkers analyses [6, 7]. CSF analysis can quickly quantitate cerebral AD pathological proteins but is highly invasive with a lack of specificity and brings about several complications, thus the utility is limited in clinical practices. CSF analysis has several between-laboratories and inter-laboratory discrepancies as well [8–10]. In vivo PET scanning is an efficient and sensitive approach to access pathological analysis of Aβ deposition and small infarcts in the brain [11, 12] but must be weighed against its high costs and side effects of radioactivity. Among several types of MRI, all of them provide good resolution of parenchymatous cerebral atrophy, although they fail to identify cerebral infarcts at an earlier stage of AD. Further, they require good compliance of subjects during examinations, which is a challenge for dementia individuals [13–15]. Blood-based biomarkers analyses are in validation state and are difficult to apply broadly in the short term. Hence, current measurements are either invasive or time-consuming, restricted by high costs or have limited accessibility. These limitations arouse interest in research on new AD biomarkers.
AD patients often report visual anomalies, which may precede cognitive dysfunction [16–19]. As the retina originates from the developing human brain during the embryonic period, it is considered part of the central nervous system (CNS) not shielded by bone and shares many similarities with the brain. Therefore, retinal examinations may offer the most important diagnostic clues to the onset of CNS diseases. Animal experiments and postmortem studies demonstrate that AD is associated with retinal atrophy and microvascular depositions of Aβ. These pathological signs usually occur in the pre-symptomatic stage of AD. Hence, in vivo retinal anomalies could be examined prior to the symptomatic stage of AD for early diagnosis (Fig. 1).
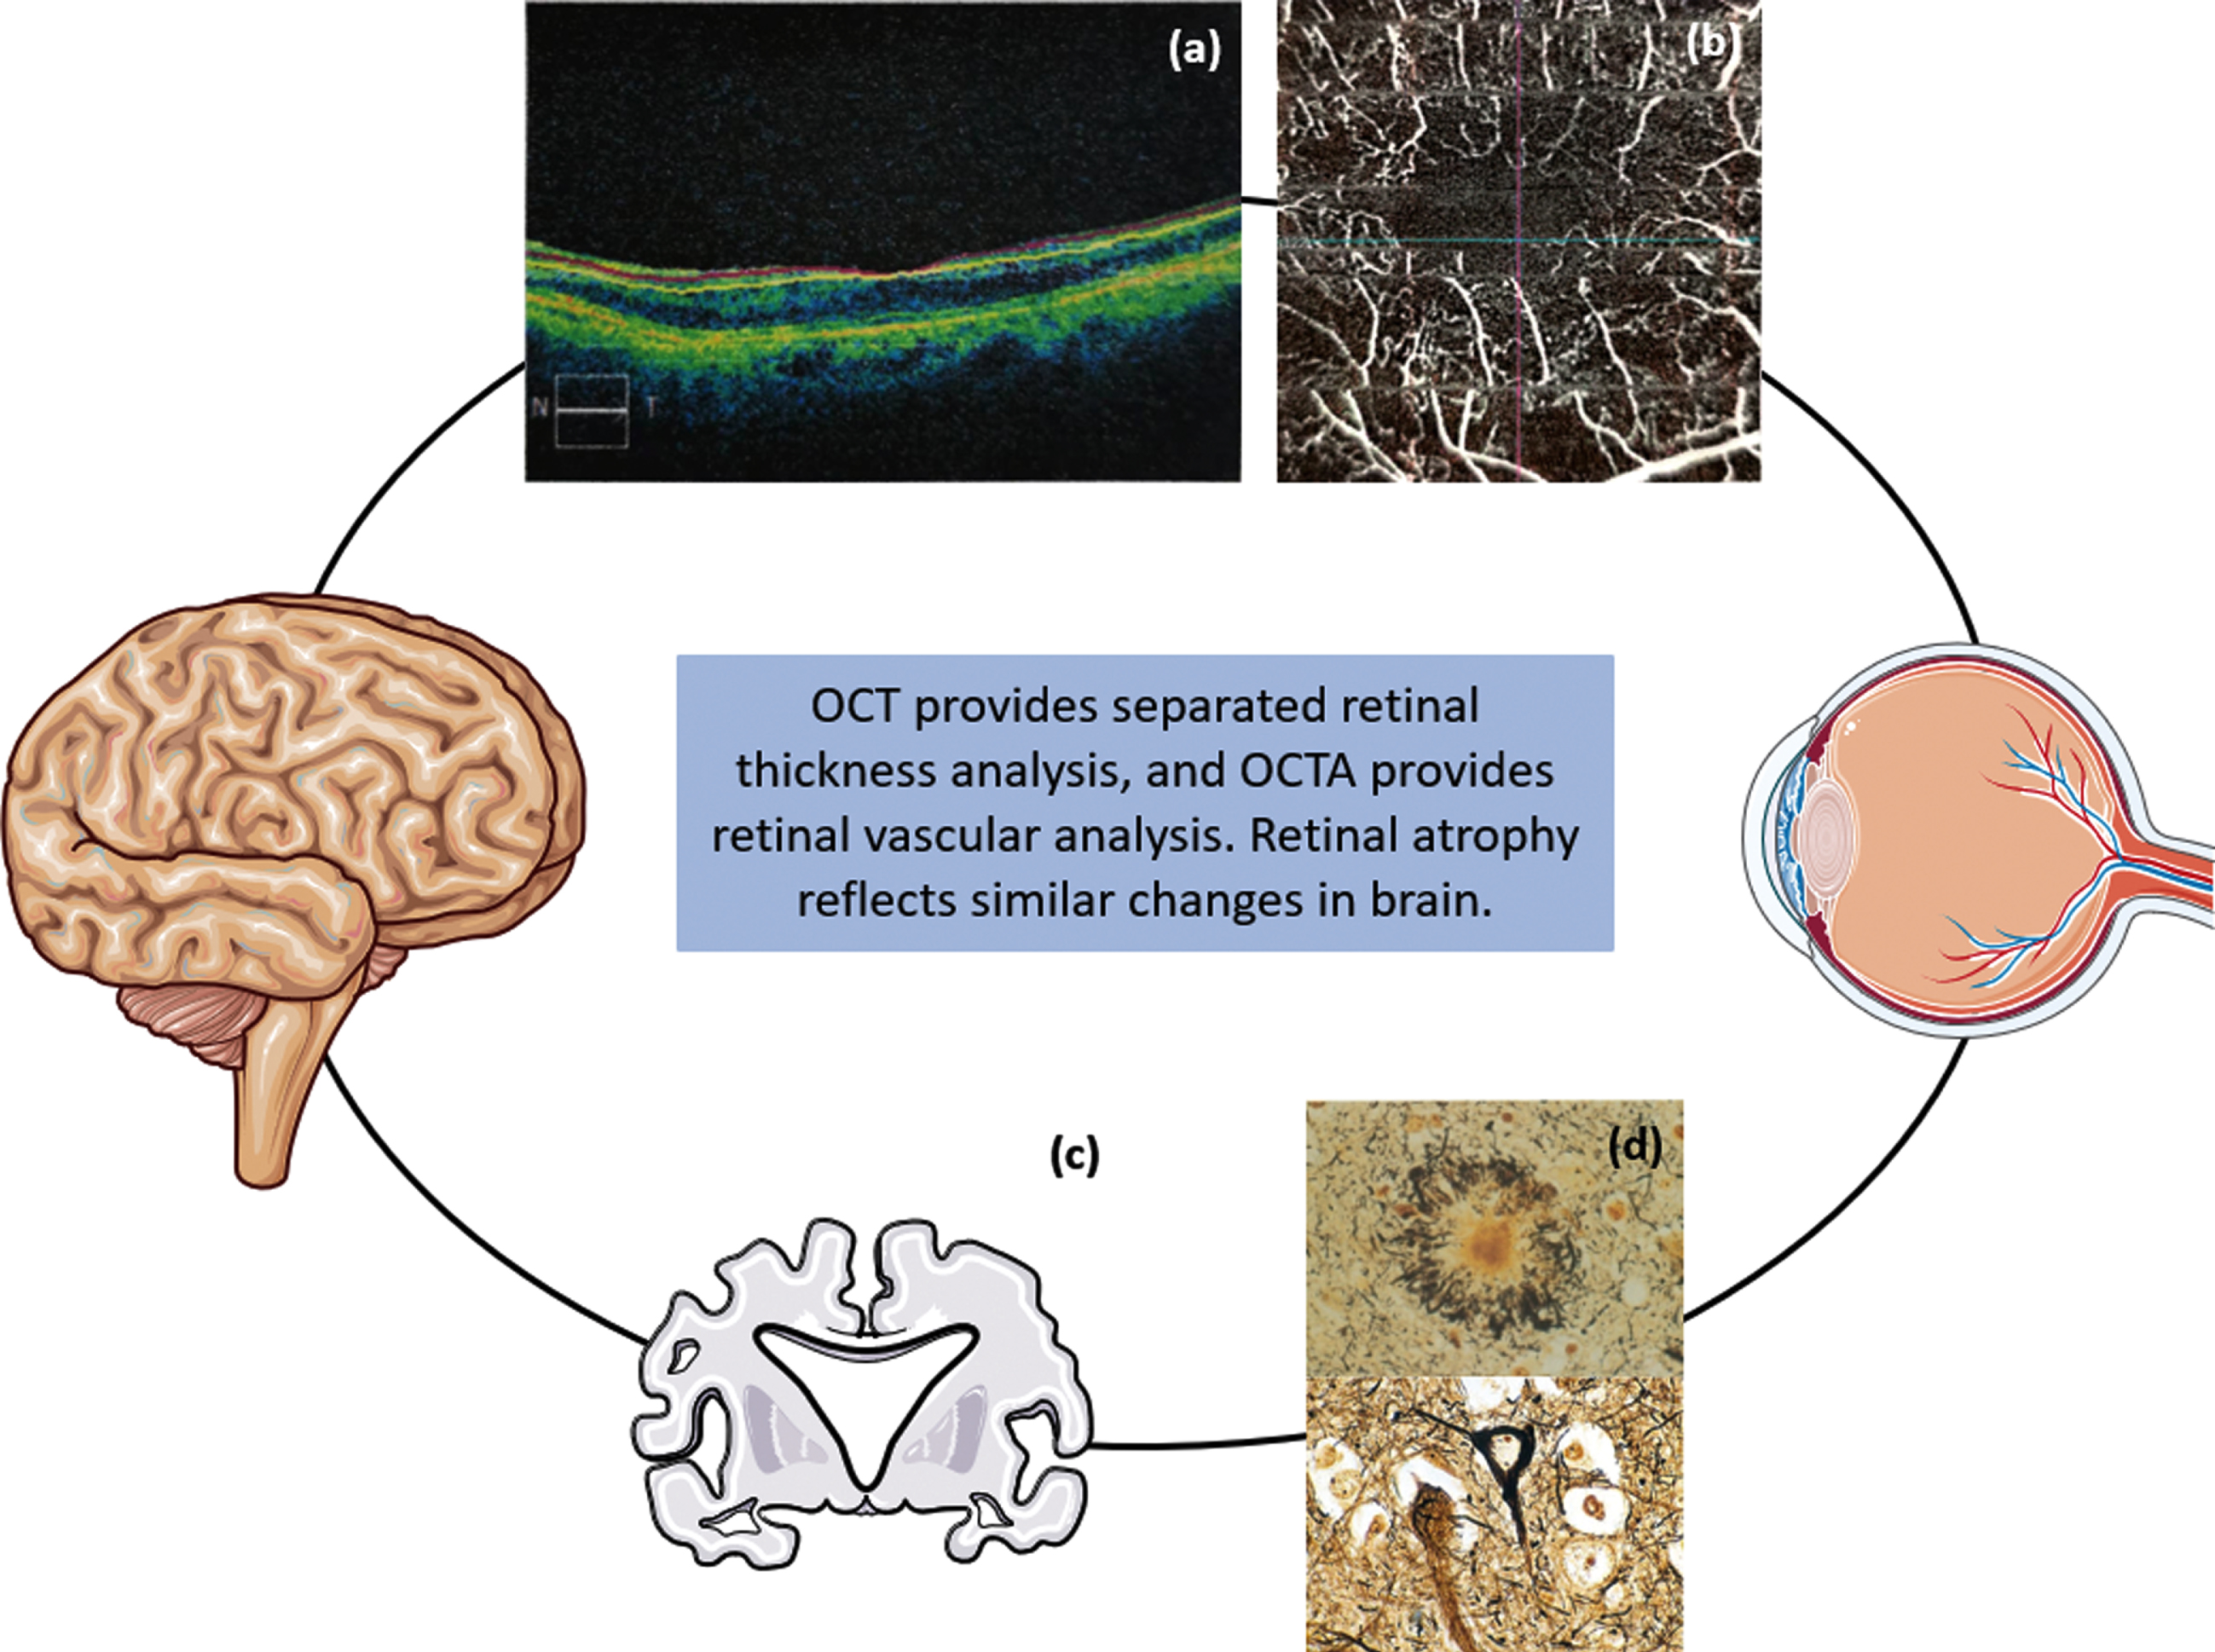
The relationship between brain and retina. (a) Thinner retina (OCT image), (b) reduction of retinal vessel density (OCTA image), (c) brain atrophy pattern in AD patient, (d) Aβ and tau accumulation in brain. The pattern pictures come from smart.service.com.
Anatomically, the retina incorporates the retinal nerve fiber layer (RNFL), ganglion cell layer (GCL), inner plexiform layer (IPL), inner nuclear layer (INL), outer plexiform layer (OPL), outer nuclear layer (ONL), other neurosensory layers, and retinal pigment epithelium. The RNFL, GCL, and IPL make up the inner retinal layer (IRL), while the outer retinal layer (ORL) consists of layers starting from the INL. In the retinal microvasculature that only contains two capillary plexuses, the superficial capillary plexus (SCP) extends into the IRL, and the deep capillary plexus (DCP) nourishes the ORL [20]. Unlike brain vessels which are abundant and constitute complex vascular networks, retinal vessels merely consist of end arteries with no anastomotic connections. Thus, any occlusion of retinal vessels may lead to the destruction of the retina [21]. More recent retinal studies have found that thinning of retinal layers and alterations in retinal microvasculature may characterize different AD stages of patients (Fig. 2).
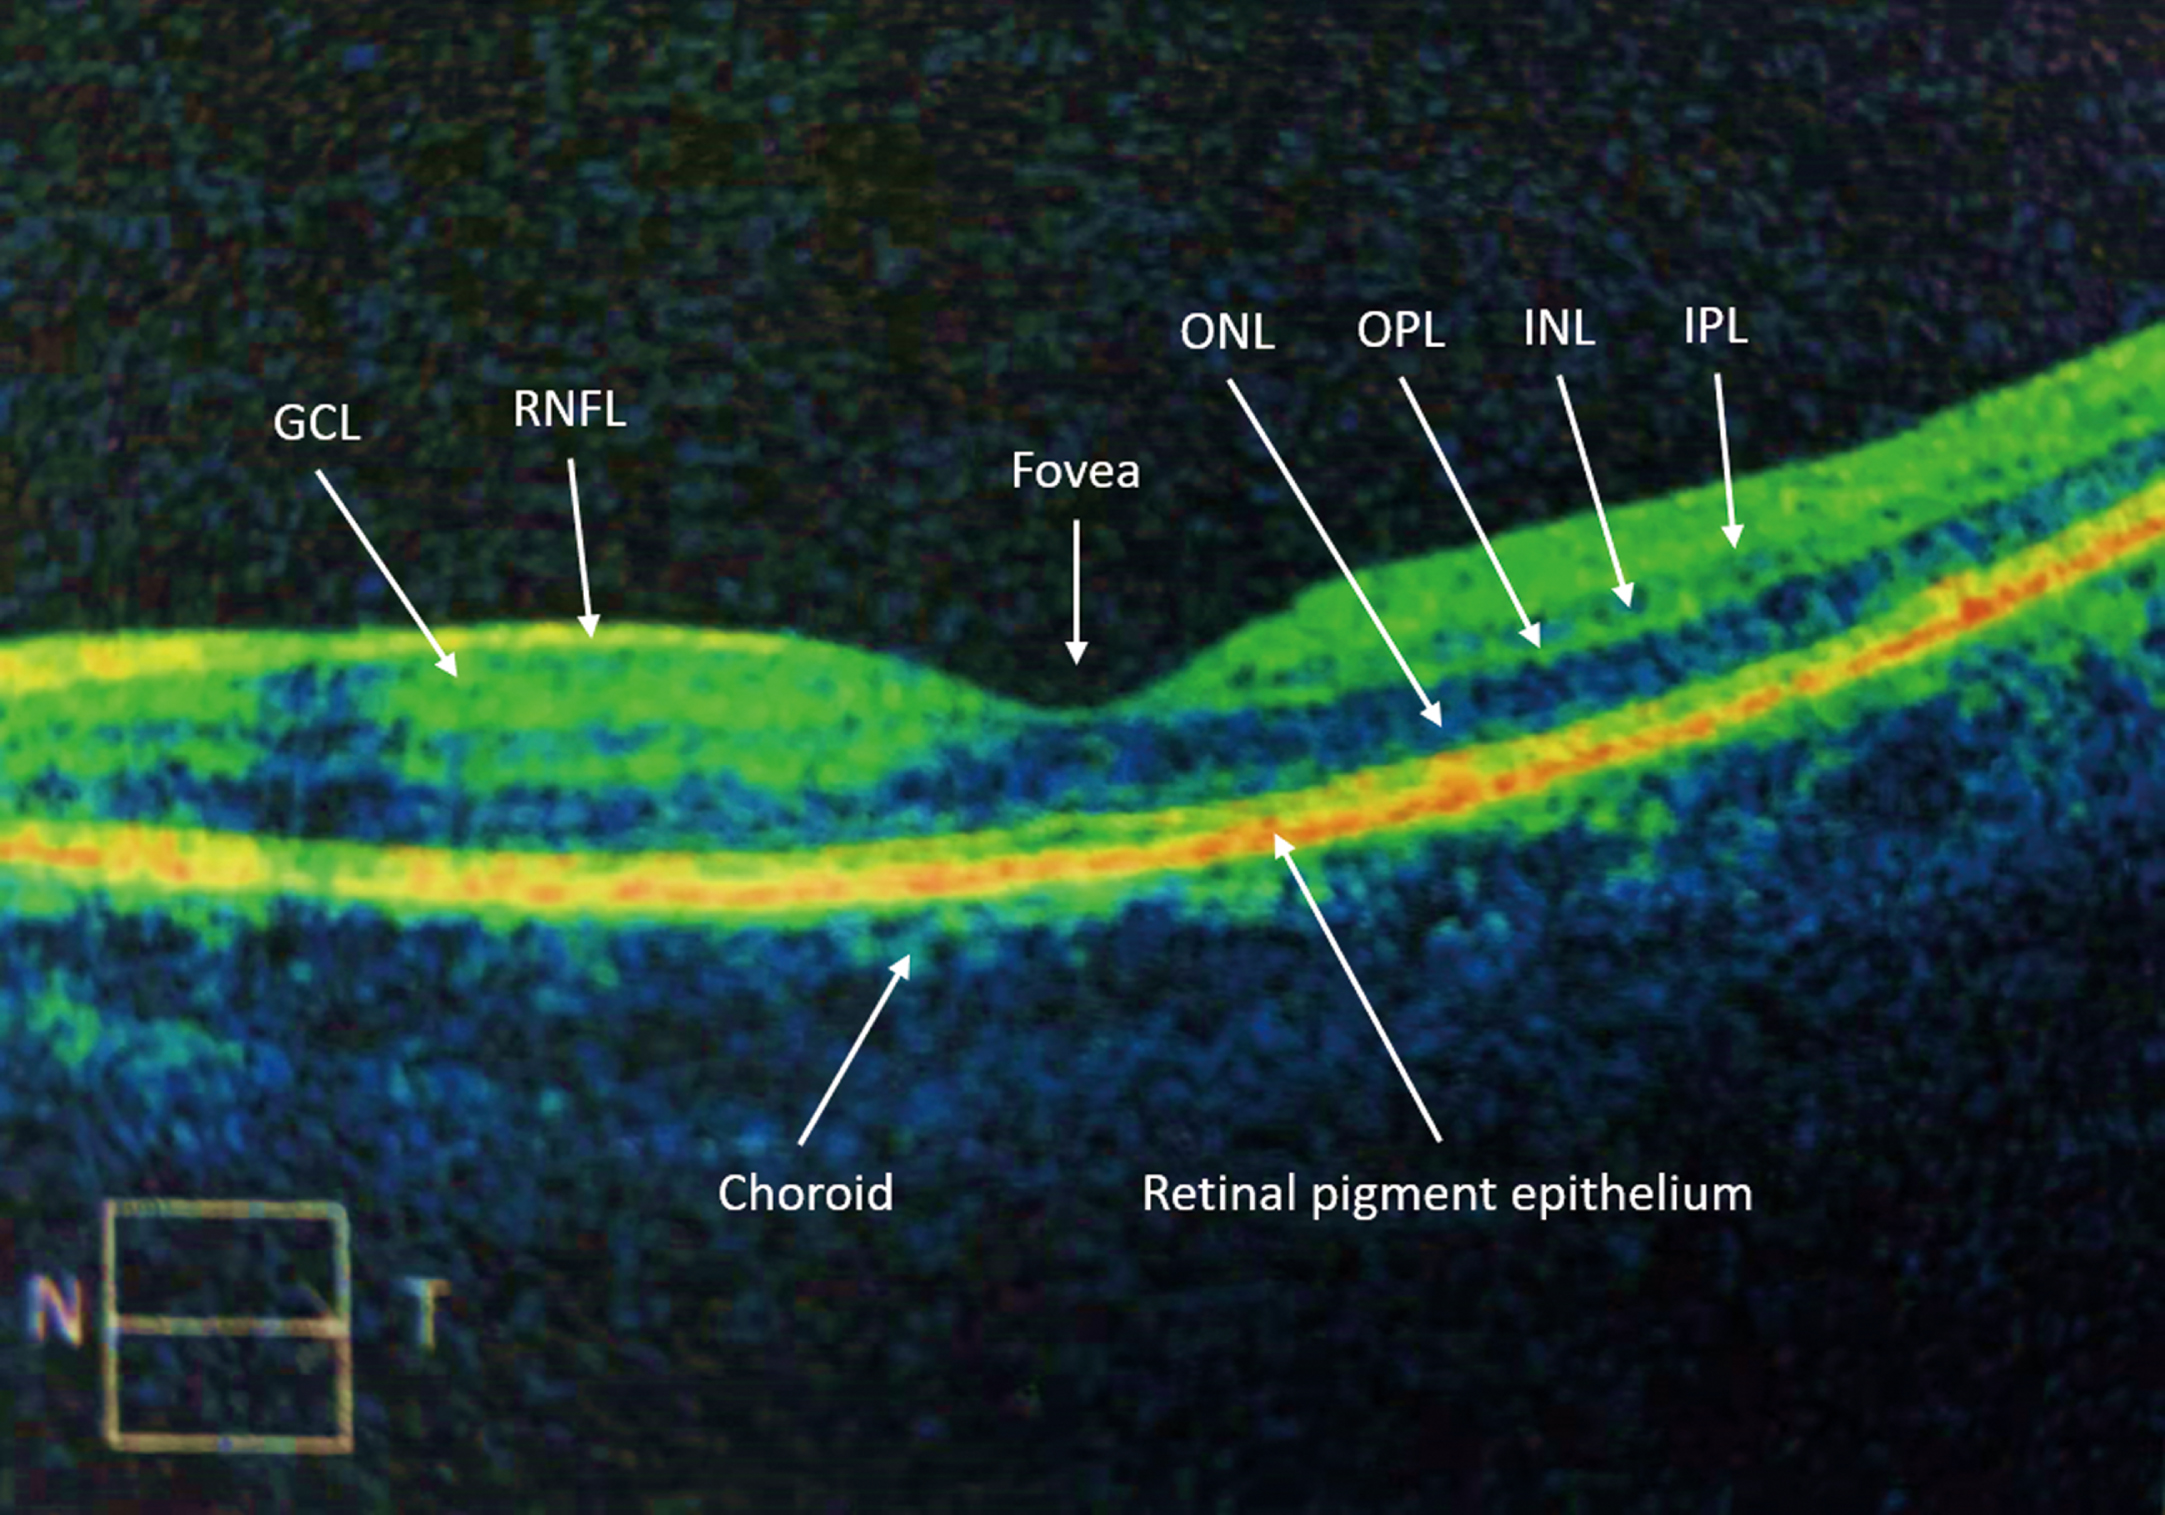
Representation of visualization of retinal layers in the OCT in an eye of a healthy subject.
Optical coherence tomography (OCT) was applied to the retinal examination by James G. Fujimoto in 1991 at first [22]. It was then used to measure macular diseases and retinal thickness [23], and became a popular option for detection of RNFL thickness as it is non-invasive, easy-to-perform, and well-priced. High-resolution OCT offers insights into retinal layer thicknesses. Some of the above retinal changes often occur at the preclinical stage of AD, so retinal imaging may provide a window into AD pathogenesis and serve as an efficient tool for early diagnosis [24, 25]. However, more evidence that supports the clinical application of these techniques is required.
Optical coherence tomographic angiography (OCTA), which is a functional extension of OCT, has been using for evaluation of retinal plexus structure and abnormal retinal vascular density, including the evaluation of retinal vascular occlusive diseases, diabetic retinopathy, uveitis, inherited diseases, age-related macular degeneration, and disorders of the optic nerve [26]. A cross-sectional view of OCTA images can provide information about the depth of the vessels. Due to its advantages including being non-invasive, safe, fast, and high-resolution, OCTA could potentially provide a convenient way for grading vascular density.
In this review, we summarized strong evidence from postmortem studies, animal experiments, and clinical trials of the utility of retinal imaging in the evaluation of AD progression. Then we summarized whether there is a correlation between retinal pathology with cerebral degeneration, and explored the availability of OCT and OCTA in AD diagnosis and progression prediction. Finally, the implications of ophthalmic examinations for AD diagnosis and their perspectives were discussed.
RELATIONSHIP BETWEEN THE RETINA AND THE BRAIN
The human retina is derived from the optic vesicle that develops from the diencephalon. The retinal ganglion cell axons form the optical nerve whose fibers terminate in the lateral geniculate nucleus, then form the temporal and parietal radiations, and then connect to the primary visual cortex, making the retina an extension of the brain. The retina is the only CNS tissue without a bone barrier, which provides unique insight into the CNS pathology using noninvasive imaging.
Due to the homology between the retina and cerebrum, strong histological evidence has demonstrated that they undergo similar changes with aging, and alterations in retinal vasculature and neurons can reflect analogous variations in the brain [27]. Most recently, neurodegeneration in the brain has been found to spread along with neural projections to anatomically connected regions, which could ascribe to myelin and glial pathologies and intercellular transmission of pathological amyloid and tau proteins, but the precise mechanisms remain uncertain [28, 29].
The RNFL, GCL, IPL, and INL thicknesses also significantly decline with age during neurodegeneration in the brain, and specific retinal sublayer thicknesses associated with brain aging have been previously proven [30, 31]. Cerebral MRI and ophthalmic imaging findings indicate that the RNFL and GC-IPL thicknesses are significantly related to grey matter loss in the temporal lobes [32, 33]. A decreased thickness of the temporal quadrant RNFL is associated with lower hippocampal volume, and that of the inferior quadrant RNFL with occipital volume, specifically lingual gyrus volume [33]. However, Mutlu et al. reported thinner retinal layers had strong associations with both grey and white matter atrophy [34]. The relationship of retinal layers thinning with grey matter loss has been a consensus among most studies, but its relationship with white matter is still questioned. Furthermore, growing pieces of histopathologic evidence relate retinal ganglion cell loss and optic nerve degeneration to AD [35, 36]. Since retinal thickness indicates neuronal damage and diffuse cerebral atrophy represents early stages of dementia as described above, the relationships between particular retinal layers and brain atrophy detected through retinal examinations may provide important diagnostic clues to the earliest stages of dementia [32, 37].
Histological similarities between the retina and brain means they may also share some similarities in the vasculature, such as the blood-brain barrier and the blood-ocular barrier (consisting of the blood-retinal barrier and the blood-aqueous barrier) that protect and nourish the vulnerable tissues [27], except for the differences described above. Further, both retinal and cerebral endothelial cells in the barriers connect tightly with pericytes. Both barriers share a basement membrane and similar transporters and comprise glial cells for angiogenesis and protection of the parenchyma, thus sharing similar mechanisms of vascularizing the brain or the retina in many aspects, including regulatory factors, blood flow, capillary density, and metabolism [21, 39]. But retinal vessels and microstructure can be observed and photographed in vivo compared to their cerebral counterparts, and small-vessel abnormalities in the eyes are more likely to occur earlier than any detectable findings in the brain. Thus, aging-related alterations in retinal vessels may predict future dementia in patients [21, 40].
REASONS FOR RETINAL IMAGING
Visual impairments have long been detected in AD patients, including decreased visual acuity, smaller visual field, color vision defects, and lower visual contrast sensitivity [41], as well as histological abnormalities frequently reported, such as optic nerve degeneration, ganglion cell loss, macular and peripapillary retinal atrophy, and blood vessel tortuosity [8, 15]. Visual symptoms can happen before detectable memory loss, part of which is related to the severity of dementia [16, 19]. Koronyo-Hamaoui et al. also ascertained significantly earlier retinal anomalies than aberrant expressions of cerebral molecular biomarkers during the development of AD [42]. These findings suggest that ophthalmologic examinations are promising measurements to reveal cerebral pathology ahead of clinical manifestations. Among them, OCT and OCTA provide evidence for neurodegenerative diseases for patients through in vivo optic nerve examinations or in vivo evaluation of retinal cell structure and blood supply.
OCT is a widely used ophthalmic imaging technique that employs retroreflected light to obtain high-resolution, cross-sectional images of the retina, and the anterior eye chamber and has been incorporated into the clinical diagnosis of several neurodegenerative diseases [43–45]. The second-generation OCT technique, spectral-domain OCT, provides high-resolution, three-dimensional images, serving as a reliable retinal thickness analyzer [46, 47]. It segments retinal layers and reveals pathologic alterations similar to those in other brain areas of the patient regardless of different densities of neuron bodies. Overall, OCT explains the impact of AD pathogenesis on retinal health through identifying particular retinal layers affected by AD predominantly.
Despite retinal thickness measurements, extensive efforts have been made to screen vascular risk factors for AD pathogenesis [48–50]. OCTA is an imaging technique based on OCT and is optimal for microvascular analysis without intravenous contrast injection [51]. Images of the two capillary plexuses, the SCP and DCP, can be separately captured by OCTA scan through vascular segmentation, and microvascular density indices such as SCP/DCP densities and the size of the foveal avascular zone (FAZ) [51, 52].
Particular retinal changes reflecting cerebral impairments associated with dementia will be characterized below based on postmortem and animal studies using OCT or OCTA scan. In these studies, it was hypothesized that the thickness of several retinal layers and abnormalities in retinal vascular structures could serve as clinicopathological biomarkers for early AD diagnosis and that retinal examinations might offer new insight into AD brain pathology.
POSTMORTEM AND ANIMAL STUDIES
Postmortem brain and retina of AD patients
Aβ and tau in postmortem brain tissues was once a vital diagnostic criterion of AD. Postmortem studies of AD patients reveal pathological characteristics of AD human cerebrum, senile plaques, and neurofibrillary tangles, which demonstrated both hypotheses that Aβ and tau contribute to the onset of AD [53]. Similar pathological hallmarks were also detectable in the retina of AD patients.
Hinton et al. reported extensive axonal degeneration in the optic nerves of corpses [54], which is age-related loss of optic nerve axons [55]. Histological characteristics from postmortem studies include a reduction in the number of ganglion cells and RNFL thickness [54], significant thinning of the GCL in the superior sector, inferior sector, and central retina, particularly in the temporal foveal region (a 52% decrease in neuronal density), and greater quantity of Aβ through immunofluorescence in the peripheral retina than the central area [35, 36].
These findings demonstrate extensive ganglion cell loss throughout the retina in AD patients, especially in the peripheral, superior, and temporal retina. Moreover, La Morgia et al. found melanopsin retinal ganglion cells in AD significantly diminished with the abnormal development of dendrites, which may contribute to AD-related circadian rhythm dysfunction [55].
Histologically, the aggregation and extracellular deposition of Aβ peptides in amyloid plaques was observed in postmortem retinas of AD patients and preclinical patients, ascertaining retinal changes at early stages of AD [42, 56]. But regarding the morphology of small dot-like extracellular Aβ deposition, different studies came to different conclusions [55, 58]. Some studies described the similar size of retinal and cerebral Aβ deposits in AD, but others support various sizes between the two types of tissues. In postmortem retinas of AD patients, an increased immune response triggered by p-tau signals was detectable, but no typical neurofibrillary tangles were observed, different from the typical morphological changes in the AD cerebrum [57]. However, studies of retinal hallmarks of AD still mostly focus on Aβ deposits, and tau proteins are rarely assessed [35, 59].
Curcumin, low-molecular-weight molecules extracted from a natural and safe dietary spice turmeric, has the potential to serve as a noninvasive and specific Aβ-biomarker for AD, attributed to its fluorescent and Aβ-binding properties [60]. It has been shown to cross the blood-brain barrier and bind to Aβ oligomers and fibrils in vitro and to plaques in AD mice and Aβ plaques in postmortem human AD brain [42, 60–62]. After removal of vitreous and background fluorescence, curcumin labeling of Aβ plaques was detectable in postmortem eyes of AD patients, mostly within inner retinal layers. Curcumin-stained amyloid was also observed alongside a qualitative relationship between neuropathological severity and retinal plaque burden in preclinical AD cases [42].
Besides these postmortem findings, animal experiments and clinical trials also show the most promising application of retinal AD biomarkers in patients.
Retinal changes in AD animal models
Age-related amyloid accumulation has been observed in several layers of AD mouse retina, which resembles the postmortem findings of AD patients. In the postmortem eyes of two transgenic (Tg) mouse strains harboring the mutant presenilin 1 (Psen1) gene (the Tg2576×Tg1 strain) and the mutant amyloid precursor protein (App) gene (the APP(SWE)/PS1(E9) strain), intense APP immunoreactivity was present in their GCL and INL layers and became more robust with age, and later appeared in outer plexiform layers such as the IPL and the OPL, but not the ONL [63]. In another experiment performed on APP(SWE)/PS1(E9) mice, most Aβ deposits were aggregated into the IPL and OPL, and the plaque quantity increased with age, damaging the retinal structure [64]. Among Tg-AD mouse models, 5×FAD mice showed the highest burden of Aβ plaques and might be a suitable in vivo model to study AD pathogenesis [65].
Koronyo-Hamaoui et al. ascertained that retinal Aβ was detectable following systemic administration of curcumin via immunofluorescence. Specifically, Aβ peptides were amassed in the retina and blood vessels of APP(SWE)/PS1(E9) transgenic mice earlier than those observed in the brain with disease progression [42]. In Tg2576×Tg1 mice, Aβ-positive vessels were identified in either retinal microvasculature or the choriocapillaris [63]. These studies confirmed the presence of Aβ in several retinal areas, resulting in disrupted retinal structures and visual deficits with AD progression.
The retinal thickness of 5×FAD rat models of AD was reduced explicitly in the inferior and temporal quadrants, manifesting region-specific retinal degeneration [66]. Several animal studies for retinal capillary evaluation have been performed to explore the potential mechanisms behind relationships between retinal vascular changes and AD pathogenesis. Shi et al. reported worse age-related capillary degeneration in the retina in the APP(SWE)/PS1(E9) strain versus wild-type mice, as well as prominent Aβ deposition and deficiency of vascular factors [67]. Using OCTA, a trend of decreasing capillary density was observed in 5×FAD rats without regional distinction [66]. TgF344 transgenic mouse models of AD showed a retinal vascular system distinct from that observed in wild-type mice, and their visual acuity was significantly lower [56].
In addition to these supportive findings, some animal studies yielded inconsistent results as well. The discrepancies are mainly due to their strain disparities, bringing out diverse outcomes even from similar experiments. All in all, the supportive findings are dominant despite inconsistent results.
RETINAL ATROPHY IN AD PATIENTS
In agreement with postmortem studies and animal experiments, in vivo examinations of the human retina also indicate retinal atrophy, which will be described from retinal thickness, vascular, and pathological changes below, primarily measured by OCT or OCTA (Fig. 3).
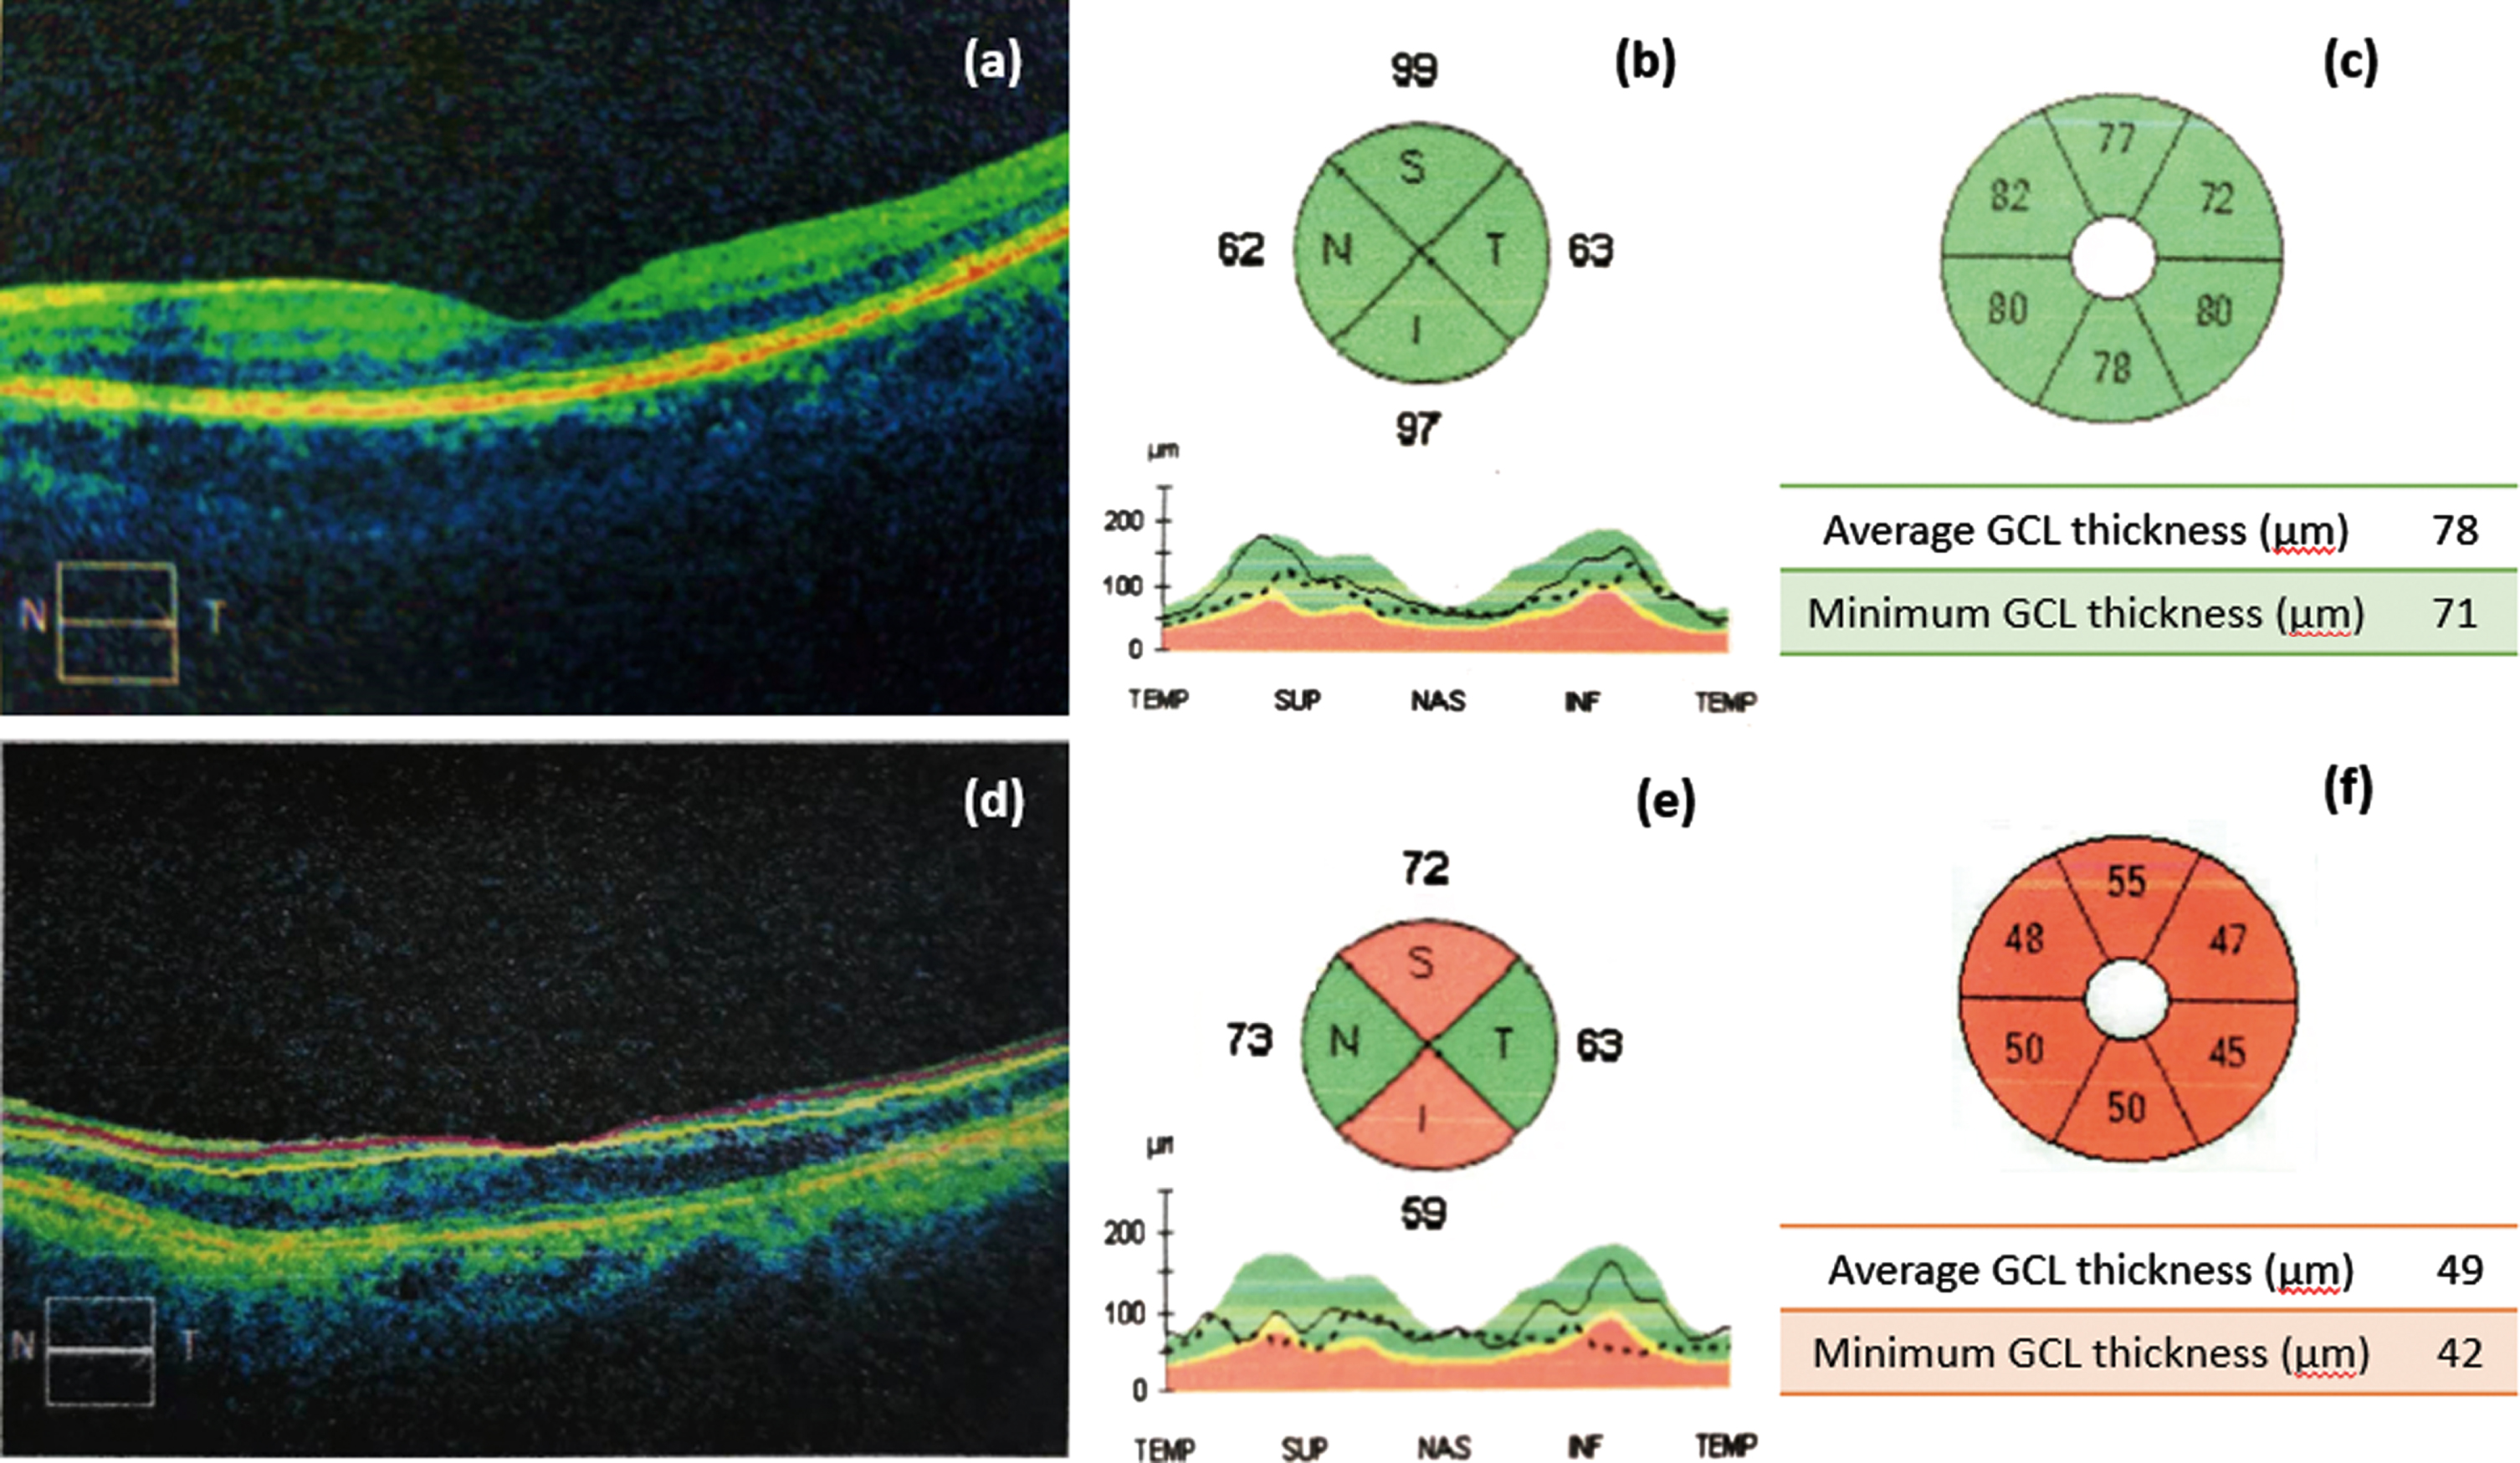
Comparison of normal images and abnormal OCT images. (a) Normal retinal layers, (b) normal RNFL thickness, (c) normal GCL thickness, (d) thinning of retinal layers, (e) RNFL thinning, (f) GCL thinning.
Thinning of retinal layers
RNFL
The RNFL appears to be linked to early stage of cognitive impairment. It is demonstrated that patients with a thinner RNFL have worse cognitive performances [68], which has been considered a risk factor of dementia [45]. Peripapillary RNFL thinning in AD patients was significantly worse than that measured in healthy controls and correlated with worse working memory and executive function, contributing to AD diagnosis [69–71]. However, there are still discrepancies as to which specific quadrant is thinning the most. A controlled study and a meta-analysis provided relatively strong evidence that thicknesses of all retinal regions had a significant distinction between AD patients and healthy controls [47, 72]. Another study considered the thinning of the global retina except for the temporal quadrant in AD [73]. Most studies ascertained more pronounced retinal thinning in the other three quadrants other than the nasal quadrant [55, 74–78]. Greater damage in the temporal sector can be ascribed to disrupted fiber distribution in the optic nerve head [79]. The inferior quadrant thinning is a cognitive-specific region as it has been shown to have a significant association with impaired episodic memory [80], as well as occipital white matter lesions [81]. Researchers proposed a hypothesis that the visual associative cortex might contribute to retrograde neuronal degeneration of the optic nerve after being affected by AD pathology, leading to thinning of the RNFL.
On the contrary, the result of a study found no significant discrimination in peripapillary RNFL thickness between healthy control and AD patients [82]. Another study also failed to find a significant difference in peripapillary and macular RNFL thickness among participants with different cognitive levels, and RNFL thickness was not significantly associated with Aβ deposition in brain [83], which failed to support the validity of using OCT as a biomarker for AD.
GCL
Given that GCL thinning has been the most common type of retinal thinning, GCL thickness measurement, since it is feasible using in vivo optical imaging, shows the potential to act as a predictor for AD axonal atrophy [74]. A study on cognitively normal participants found thinner GCL thickness is associated with higher tau level in the CSF and smaller hippocampal volume [84]. Notably, GCL degeneration is prominent in the superior and inferior sectors [85].
AD patients are supposed to have a significant reduction in RNFL plus GCL thickness, a signal of retinal neuronal damage [86]. A study utilizing OCTA reported significantly reduced RNFL, GCL, and fovea thicknesses in preclinical AD [87]. In an OCT analysis, patients with thinner RNFL-GCL thickness tend to have lower Mini-Mental State Examination (MMSE) scores or worse cognitive impairment [74, 85]. These findings indicate RNFL-GCL thickness is a severity-related sign in dementia. The relationship of this thickness with dementia severity can be potentially explained by abnormal amyloid levels that lead ganglion cells or axons to atrophy or cause transsynaptic retrogradation [29, 88]. A population-based study quantified RNFL and GCL thicknesses in each sector and ascertained the associations of peripapillary RNFL and macular GCL atrophy with impaired cognitive function, particularly the latter. These relationships strengthened along with advanced age.
Although there are some in vivo studies that found no discrimination in RNFL-GCL thickness between AD patients versus matched controls [89, 90], it appears that macular GCL volume can be a better biomarker of neurodegeneration, and age plays a pivotal role in determining this association [91].
IPL
Significant GC-IPL thickness reduction in each quadrant has been observed in AD patients and MCI patients as well, though not so pronounced. A study of clinical biomarkers for MCI calculated the area under the receiver operating characteristic curves of GC-IPL thickness, indicating a satisfactory accuracy in discriminating MCI from non-MCI [76]. Furthermore, a convolutional neural network model using GC-IPL thickness as predictor detected symptomatic AD successfully, which highlighted the significance of GC-IPL and conveyed that machine learning might be helpful in AD prediction [92]. Likewise, IPL thickness can predict AD axonal atrophy and becomes thinner with AD duration [74].
Eleonora et al. found no difference in GC-IPL thickness between AD versus non-AD, as measured by OCT [89]. Jiang et al. came to the same conclusion when comparing MCI, AD, and control groups [51]. This may be due to slower progress of GC-IPL thinning with AD progression. Hence, a larger-sample study series are needed for strong evidence to determine whether GC-IPL thickness can be a clinical biomarker.
ORL
The ORL includes the INL, OPL, ONL, and the retinal pigment epithelium, and the blood-retinal barrier. So far, there has been no agreement on ORL thickness as an indicator to discriminate AD from healthy adults [74, 93]. Armstrong et al. detected the retinas of cognitively normal individuals with presenilin-1 (PSEN1) E280A mutation, a vital gene of early onset familial AD, via OCT, and found significant ORL thinning, even greater than the RNFL and GCL [94]. Lopez-de-Eguileta et al. found retinal thinning was confined to the temporal RNFL and GCL in MCI patients but extended to the IPL and ONL when they progressed to AD [93]. ORL thinning with AD progression is also supported by another study, and the odds ratio for AD presence may increase by approximately 24% –29% with a reduction in ORL thickness by 1% [95]. However, most studies failed to yield similar results. We believe that the IRL is more sensitive than the ORL for AD screening.
Macular volume
The macula is the region comprising most ganglion cells across the retina. Made up of only photoreceptor cells, it is the thinnest and most light-sensitive spot near the central retina. Iseri et al. first measured macular thickness in AD patients using OCT and found a marked reduction in the mean total macular volume in AD patients compared to healthy adults, which also had a significant correlation with MMSE scores, and decreased macular thickness in each quadrant [73]. A smaller macular volume was detectable in preclinical AD patients using OCTA [87]. Notably, subtle variations in the macular thickness have already been detectable at the subjective cognitive decline stage in MCI and AD patients, significantly different from those obtained in the corresponding controls [89, 96]. However, some OCTA studies failed to find any macular differences between AD and healthy people [90, 97]. While the retinal decline apparently occurs in the parapapillary RNFL, whether the macular area can be influenced requires further evidence.
Retinal vascular changes
Density reduction is one of the important retinal vascular changes in AD. Similar to decreased cerebral blood flow in AD, impaired retinal perfusion occurs in several functional domains [97] even before symptom onset. Retinal vascular alterations have been observed in Aβ-positive vessels of asymptomatic individuals, featuring reductions in vascular density and quantity in the macula and a larger non-perfused area [87]. It appears that retinal vascular anomalies happened earlier than previously thought.
The enlargement of FAZ as well as the SCP, DCP density reduction often occur in AD patients versus healthy people [95]. Lower DCP density is present in the MCI stage, which implies changes in the DCP at earlier stages of AD [93, 98]. In AD patients, they showed markedly reduced SCP and DCP density, especially the latter [95]. A 4% –9% increase in the likelihood of AD presence can be observed in the DCP where its vessel density decreases by 1%, which means DCP density can be a sensitive indicator for diagnostic prediction of AD [95]. Among these vascular parameters, the DCP density may serve as an early sign of AD. However, the ORL, nurtured by DCP, shows no difference in thickness in AD versus healthy controls in some studies [99, 100]. Studies found retinal vessel density reduced in AD patients without a history of cerebrovascular disease. There is a trend in reduced retinal vascular density or network from controls to preclinical AD and AD [51, 101–104]. However, only a few studies, for example, one conducted by O’Bryhim et al., confirmed FAZ enlargement in preclinical AD. Most studies ascertained no difference in the FAZ between preclinical AD and healthy controls except for significant FAZ enlargement in AD patients [52, 104]. According to the correlation between MMSE score and OCTA parameters, some studies found retinal vascular density and FAZ are significantly correlated with MMSE score, while some other studies failed to find the correlation, despite discrimination in vascular parameters between preclinical AD, early AD, and controls [101] (Fig. 4).
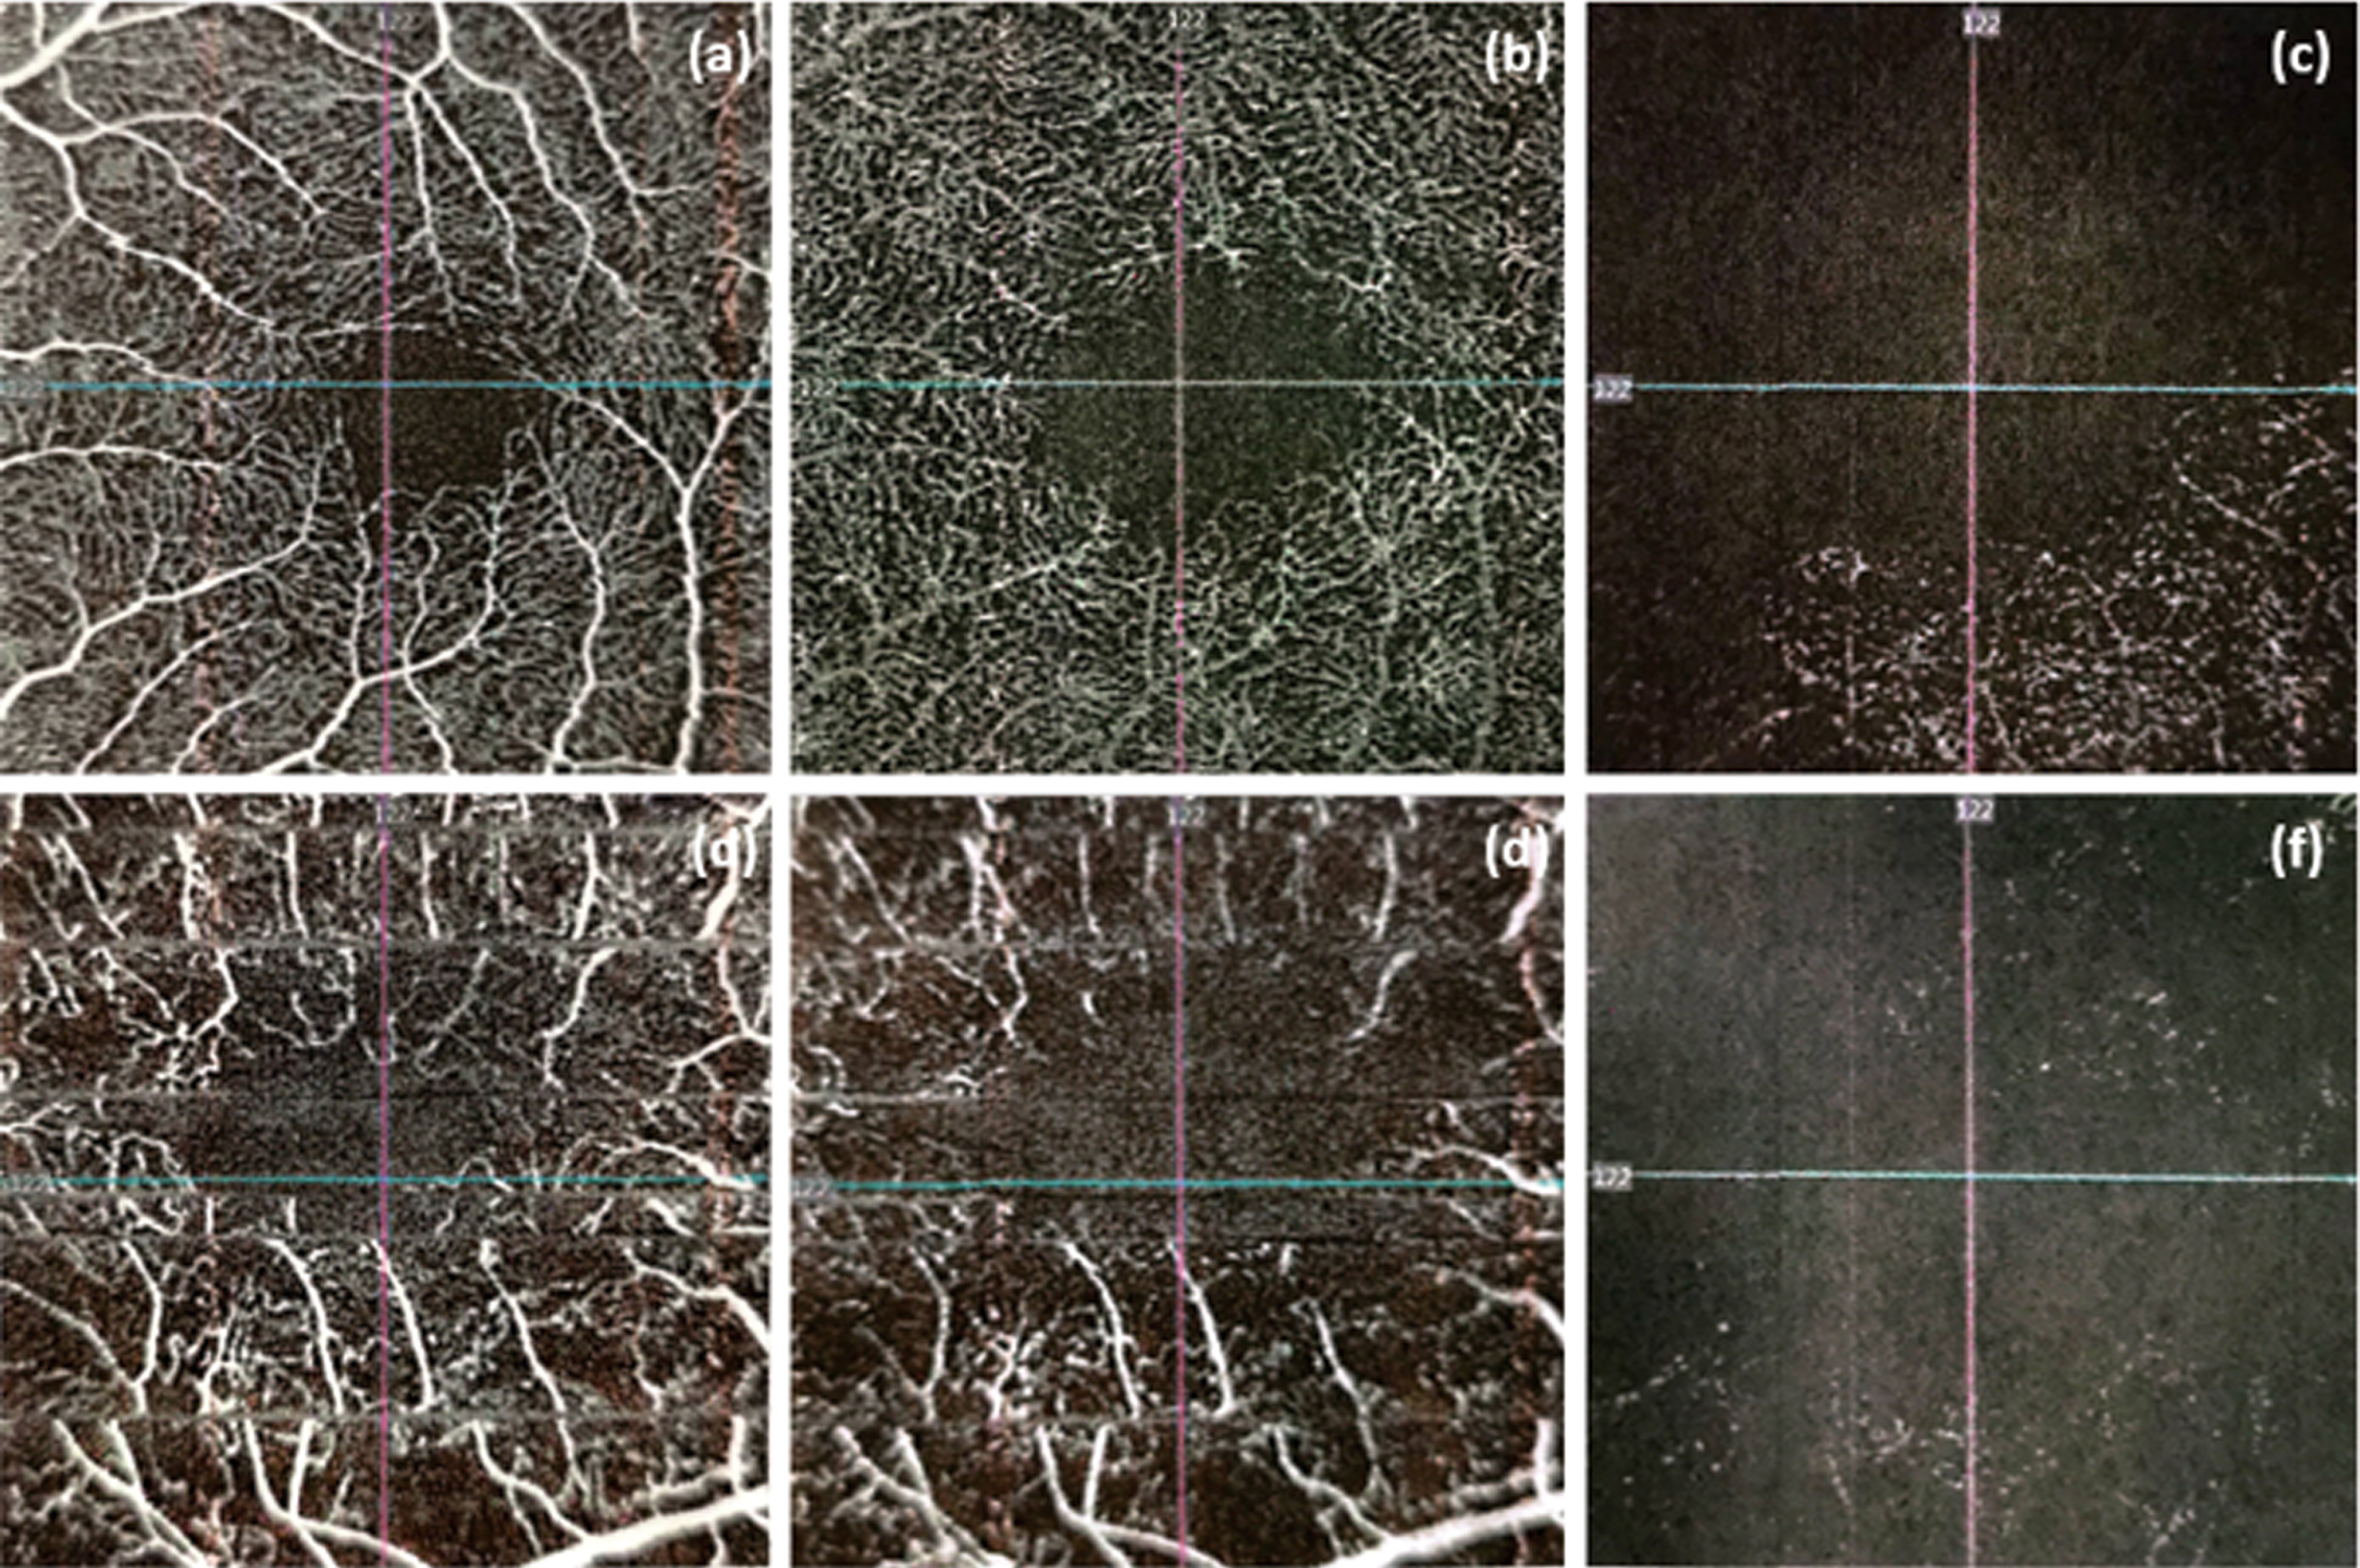
Comparison of normal images and abnormal OCTA images. (a) Normal SCP density, (b) normal DCP density, (c) normal FAZ, (d) reduction of SCP density, (e) reduction of DCP density, (f) enlargement of FAZ.
Opposite to previous findings, Van de Kreeke et al. reported macular vascular density in Aβ-positive individuals was even higher than in Aβ-negative individuals using OCTA. They explained that this unexpected finding might be due to inflammation reactions, which made capillaries enlarge and visible [52]. In addition, another research also found that cognitively healthy subjects with a family history of AD or APOE ε4 allele have a higher vascular density in macular area than subjects without the two AD risk factors [105]. These opposite results might due to the inflammatory response of microvessels in the preclinical stage of AD, which leads to temporary increase in retinal vessel density and blood flow. Subsequently, continued inflammation and accumulation of Aβ might lead to further damage and in turn leads to lower vessel density. Recently, a longitudinal study used OCTA to capture images of retinal microvascular in healthy older adults. Their results indicated that vascular density and FAZ were not predictive of AD [106]. In brief, the accuracy of the SCP, DCP, and FAZ as AD biomarkers are questioned. Low signal strength and motion artifact often result in poor image quality, which might increase the difficulty of OCTA analysis. Lahme et al. ascribed vascular changes to cerebral vascular lesions rather than AD pathology [103]. For far too long, associations between the global retinal function and retinal vascular density have not yet been proven.
RETINAL PATHOLOGY IN AD
As Aβ plaques are pathological hallmarks of AD, alongside the similar histological patterns in the brain and the retina, studies of retinal pathology still center on this field. Koronyo found comparable morphological features between retinal and cerebral Aβ deposition, with a linear relationship in the quantity of deposited Aβ between the cerebrum and the retina. Aβ primarily accumulated around or within retinal vessels, particularly those in the GCL, alongside a significant reduction in the number of retinal cells. Aβ plaques are often observed in the periphery of the superior quadrant rather than in the posterior quadrant [58]. Tadokoro et al. quantified the deposition of amyloid between AD, MCI, and controls and found aggregated amyloid accumulation with disease progression [107].
Evidence that neurodegeneration in CNS can spread along with neural projections to anatomically connected tissues may explain these retinal pathological findings in AD. The spread of neurodegeneration may be due to myelin and glial pathology [28], such as the transmission of pathological amyloid and tau between neuronal and glial cells [29, 108].
RETINA IMAGING AS A TOOL FOR DIAGNOSTIC PREDICTION OF AD
AD diagnosis at early stages
It has been widely accepted that AD is a neurodegenerative disease confined to the cerebrum. But growing evidence shows that it also influences other parts outside the CNS, such as the retina, giving a window into AD pathology and thereby allowing diagnostic prediction. The above studies have ascertained varying fundus pathology in AD patients with disease progression. In vivo optical examinations using OCT or OCTA are feasible to identify early changes in retinal vascular density or blood flow. Some of those measurements have the potential to be used as clinical biomarkers for AD diagnosis early on, which are summarized alongside their clinical implications in Table 1. These fundus examinations help evaluate the histopathological state of the cerebrum of AD patients (Table 1).
Fundus examination measurements and their clinical implications
AD, Alzheimer’s disease; DCP, deep capillary plexus; FAZ, foveal avascular zone; GC-IPL, ganglion cell-inner plexiform layer; GCL, ganglion cell layer; IPL, inner plexiform layer; MCI, mild cognitive impairment; MMSE, Mini-Mental State Examination; OCT, optical coherence tomography; OCTA, optical coherence tomographic angiography; RNFL, retinal nerve fiber layer; SCP, superficial capillary plexus.
OCT and OCTA have distinct efficacy in identifying retinal pathology: the former is better at measuring the thickness of each retinal layer, and the latter is capable of detecting vascular density. Therefore, a combination of both methods can ensure an accurate result for a definite diagnosis. Among those fundus examinations, RNFL-GCL thicknesses via OCT and retinal vascular density via OCTA are better options for AD screening.
OCT prediction of cognitive deterioration
OCT examinations have been proven to discriminate specific retinal pathological changes, such as retinal atrophy and pathological depositions, corresponding to neurodegeneration in the brain of AD patients and animal models. These findings also suggest that OCT may be effective in predicting the progression of cognitive deterioration, which confers an increased risk of AD.
The OCT eye exam for carriers of the PSEN1 gene mutation, who were cognitively unimpaired, showed the thinning of almost all retina layers and a significant reduction in the ORL thickness [94]. There are longitudinal cohort studies showing that RNFL thinning was associated with a higher likelihood of developing future cognitive deficits. By comparing the RNFL thickness and cognitive assessments at baseline and after three years of follow-up, participants with greater changes in retinal thickness were more likely to have worse cognitive impairment [68]. These results indicate that retinal morphological abnormalities are detectable earlier than manifestations of dementia by OCT and thus, can be used for predicting the occurrence of AD.
RNFL thickness has been shown to predict cognitive deterioration, except for other eye pathologies such as glaucoma, optic neuropathy, or other neurological diseases. A cohort study assessed the cognitive status and RNFL thickness in old participants at baseline and after 25 months of follow-up. However, the cognitive status of a growing number of patients remained constant during this period. The OCT exam revealed a more significant loss in RNFL thickness, especially in the inferior quadrant, in these patients [109]. More studies support a correlation of RNFL thickness with cognitive performances and AD duration. A thinner RNFL with the progression of dementia has been confirmed among patients with MCI or mild or moderate to severe AD [47, 111]. This trend is most prominent among MCI and AD patients, particularly in the superior quadrant [47].
However, some studies found no significant difference in RNFL thickness with dementia stages. This may be ascribed to the thinner areas that are often adjacent to thicker areas in the same layer so that the average value can be skewed or due to distinctions between different OCT devices [45, 112].
Thinner retinal thickness detected by OCT may be associated with amyloid or tau depositions in the brain, a sign for preclinical stages of AD. The mean RNFL thickness loss begins in preclinical AD individuals, who are cognitively healthy and whose CSF Aβ42 and tau are detectable [113]. In subjective cognitive decline patients, a decrease of 1μm in inner nasal macular thickness is associated with a higher likelihood of cerebral Aβ deposition [96]. These studies highlight the feasibility of OCT to monitor AD pathology before clinical manifestations in high-risk patients. Future endeavors should focus on the clinical implications of OCT in AD diagnostic prediction.
PERSPECTIVE AND LIMITATIONS
Current auxiliary diagnosis methods for AD are complex and often fail to characterize pathogenesis until symptom onset, more than 20 years after pathogenetic events take place. These unnoticed cerebral changes are irreversible. It is the first imperative to put forward the proposal of effective diagnostics for preclinical AD to offer significant evidence for large-sample clinical trials. Most studies have ascertained detectable retinal changes in AD before any CSF and neuroimaging abnormalities. Animal experiments and postmortem studies have an agreement on the fact that retinal biomarkers are affected by AD. Therefore, the retina is a window into the progression of AD.
OCT and OCTA are the most popular in vivo examinations that sensitively detect retinal changes for prediction of cerebral pathology in AD. Among those retinal biomarkers we have mentioned, a thinner RNFL-GCL thickness and retinal vascular density are more significant for AD diagnosis at preclinical stages, particularly the RNFL thickness, which may indicate AD progression.
Due to the presence of several debates, such as whether retinal tau proteins exist, more studies for roles of retinal imaging in early AD diagnosis are needed for stronger evidence. And OCT and OCTA, as additional tests with CSF or MRI or other current examinations, offer a unique approach to complement and refine early diagnosis of AD. However, limitations of current studies on the retinal changes of AD are apparent.
Longitudinal studies of retinal changes in AD
For far too long, only a few studies have focused on long-term retinal changes during AD progression. Most studies only explored retinal differences in dementia versus normal states. Whether these retinal biomarkers are associated with disease progression needs validation by randomized clinical trials and long-term follow-up studies of preclinical AD patients versus normal individuals before any applications to clinical practice. At best, patients with the mildest to the most severe stages of AD will be assessed using OCT and OCTA to obtain dynamic retinal changes and determine the efficacy of these retinal biomarkers.
Mechanisms for retinal pathologies in AD
AD patients often suffer from eye disorders, and identical AD pathologies have been observed in the retina, but mechanisms for the spread of neurodegeneration from the brain to the retinal have not yet been fully understood. Future studies should focus on the potential mechanisms for retinal pathologies in AD using retinal imaging. Pathophysiological and histopathological studies based on animal models and postmortem specimens are hopeful to resolve the problem. Due to transgenic mouse strain disparities that may yield different outcomes, studies must return to classical animal models to explain the mechanism after ascertaining retinal changes in each AD stage.
In addition, other AD risk factors may promote dementia progression while contributing to retinal changes. AD risk factors such as hypertension, heart disease, smoking, and atherosclerosis are associated with subtle retinal microvascular changes. OCTA could identify and monitor systemic cardiovascular status as well as cerebral vascular modification [114, 115]. This hypothesis deserves further study to better explain why retinal examinations can detect neurodegenerative disease.
Identification of other concurrent pathophysiological mechanisms for retinal pathology
The retinal thickness and vessel density are associated with other pathophysiological mechanisms. For example, the RNFL and GCL thicknesses have obvious relevance to ocular axial length [116]. Retinal vessel density was related to acute intraocular pressure change [117], and the RNFL thickness loss was associated with higher intraocular pressure referred to a meta-analysis [118], even after excluding glaucoma patients. Physiologic retinal atrophy and some eye diseases, such as glaucoma, cataract, and macular degeneration, are often detectable in elders, including AD patients. Appropriate protocols to rule out non-AD pathologies in the retina are of vital importance for convincing results.
Data quality improvements
Retinal imaging data quality needs improving. First, image data recording can be disturbed by experimental conditions, algorithms, and display methods. For example, OCT imaging results can be biased due to media opacity, instrument-to-instrument variability, structural or functional changes of the retinal pigment epithelium, and image centering and positioning. These factors must be taken into account when interpreting OCT data and comparing results between different instruments [26]. Further, interindividual variations in the retinal layers, vascular thickness, spherical equivalent, and image intensity may contribute to discrepancies in outcomes. Finally, the standardization of the measurement of retinal imaging biomarkers in AD is required for clinical diagnosis.
Limitation of OCT and OCTA acquisition
The acquisition of OCT and OCTA images has several limitations, especially in cognitively impaired patients. For patients with dementia, it is difficult for them to hold their eyes stationary for long period of time. Because image artifacts of OCT and OCTA have an impact on data analysis, a precise and robust eye-tracker for OCT scan is in great need. Several relevant studies have been performed, but much effort is needed to put them into practice [119, 120]. Fundus based eye-tracker should be considered in the design of next generation OCT devices.
The signal strength also significantly influences the precision of OCT images. With larger OCT signal strength, the OCT measurements of retina were significantly increased [121], moreover, the OCTA examination is highly dependent on the OCT measurements so signal strength would surely affect the vessel density result [122]. Hence, researchers should be cautious on the interpretation of data from OCT and OCTA scans. When comparing data from different studies, they should eliminate the signal strength bias.
The OCTA scan accuracy requires a vascular segmentation method with high repeatability. Since manual segmentation of retinal vessels is tedious, researchers have proposed a deep neural network for automatic segmentation of OCTA images [123]. There is no consensus yet about the time-consuming vascular segmentation process, thus this segmentation issue is a novel field worth exploring [124]. In addition, the scan tilt might also have an impact on OCTA assessment, thus it is important to eliminate the deviation caused by scan tilt for quantitative OCTA measurements [125].
Demographic characteristics
Patients may have a strong genetic tendency to develop AD if they have a family history. But limited studies have assessed the relationship of retinal anomalies with a family background of AD, and none of them are cohort studies. Given the homology between the retina and the brain, family cohort studies of AD are also required to illustrate the influence of genetic factors on retinal changes.
CONCLUSION
Retinal examinations are easy-to-operate and noninvasive and merit more attention. Despite growing evidence for the potential of retinal biomarkers, clinical applications of these biomarkers require regulation and validation. Future studies should focus on current limitations and normal ranges of these biomarkers. Further development of new retinal biomarkers is needed for AD diagnostic prediction early on for these patients.
Footnotes
ACKNOWLEDGMENTS
This work was supported by Capital’s Funds for Health Improvement and Research [grant number CFH 2020-4-1033]; Beijing NOVA Program [grant number Z211100002121051]; Beijing Natural Science Foundation [grant number JQ19024] and National Natural Science Foundation of China [grant numbers 81671040 and 81970996].