
Abstract
Background:
Dysregulated glucose metabolism in the brain is considered to be one of the key causes of Alzheimer’s disease (AD). Abnormal glucose uptake in AD is tightly associated with decreased levels of glucose transporter 1 (GLUT1) and GLUT3 in the brain, but the underlying mechanisms remain unclear.
Objective:
We aimed to explore the cause and mechanism of impaired glucose uptake in AD.
Methods:
N2a/WT and N2a/APP695swe cells were cultured in vitro, and cellular glucose uptake and ATP content, as well as the expression of GLUT1, GLUT3, and PI3K/Akt pathway members, were detected. Intracellular reactive oxygen species (ROS) levels were detected by flow cytometry. After treatment with the ROS scavenger N-acetyl-L-cysteine (NAC), the above indicators were detected again.
Results:
GLUT1 expression was significantly decreased (p = 0.0138) in N2a/APP695swe cells, while GLUT3 expression was no statistical difference (p > 0.05). After NAC treatment, PI3K and Akt phosphorylation levels, GLUT1 expression, glucose uptake and ATP levels were remarkably increased (p = 0.0006, p = 0.0008, p = 0.0009, p = 0.0001, p = 0.0013), while Aβ levels were significantly decreased (p = 0.0058, p = 0.0066). After addition of the PI3K inhibitor LY29004, GLUT1 expression was reduced (p = 0.0008), and Aβ levels were increased (p = 0.0009, p = 0.0117). In addition, increases in glucose uptake and ATP levels induced by the Akt activator SC79 were hindered by the GLUT1 inhibitor WZB117 (p = 0.0002, p = 0.0005). Aβ levels were decreased after SC79 treatment and increased after WZB117 treatment (p = 0.0212, p = 0.0006).
Conclusion:
Taken together, scavenging of ROS prevents from Aβ deposition via activation of the PI3K/Akt/GLUT1 pathway, and improved the impaired glucose uptake in N2a/APP695swe cells.
INTRODUCTION
Alzheimer’s disease (AD) is a progressive degenerative disease of the central nervous system and the main cause of dementia in the elderly [1]. The pathological characteristics of AD mainly include amyloid-β (Aβ) deposition, neurofibrillary tangles, and loss of neurons in the cerebral cortex and hippocampus [2]. Now, the mechanisms of AD still remain unclear, and numerous studies have found that the development of AD is associated with metabolic abnormalities [3–5], especially, glucose metabolism disorders in the brain are considered to be responsible for the development of AD [6], impaired glucose uptake and utilization are closely associated with AD pathological deterioration and cognitive impairment [7, 8].
Glucose must be mediated by glucose transporter proteins (GLUTs) to cross into cell, thus GLUTs play an essential role in impaired glucose uptake [6, 9]. GLUT1 and GLUT3 are the main transporters responsible for glucose uptake in the mammalian nervous system, and their decrease is the primary cause of abnormal glucose uptake in AD [10, 11]. GLUT1 is the most important subtype of the GLUTs family, and its reduction not only prevents sufficient glucose uptake and compromise glucose metabolism [12], but also accelerates Aβ deposition, reduces Aβ clearance, and ultimately leading to neuronal degeneration [13]. However, little is currently known about the mechanisms underlying the reduced expression of GLUT1 and GLUT3 in AD.
Reactive oxygen species (ROS) are important factors in the early pathological development of AD [14]. ROS trigger the formation and accumulation of Aβ; in turn, Aβ also promotes ROS production and enhances oxidative stress [15]. In addition, increased levels of ROS are associated with decreased expression or activity of key proteins involved in the glucose metabolism pathway, which might result in a low-energy state in neurons [16, 17]. It has been reported that ROS affect brain energy metabolism by indirectly regulating neuronal cell permeability to glucose [1].
The phosphoinositide 3-kinase (PI3K)/Akt pathway has been suggested to play essential roles in the regulation of GLUT1 and GLUT3 [18]. Previous studies have found that abnormal PI3K/Akt signaling is involved in the development of AD [19, 20], providing a connection between various pathogenic factors of AD, among which the discussion on the relationship between Aβ, ROS, and glucose metabolism disorder has attracted much attention. This study investigated the potential roles of ROS in the regulation of GLUT1 and GLUT3 and the underlying mechanisms in N2a/APP695swe cells.
MATERIALS AND METHODS
Cell culture and treatment
Wild-type mouse neuroblastoma cells (Neuro-2a, N2a) were purchased from the Cell Resource Center, Shanghai Institutes for Biological Sciences, Chinese Academy of Sciences (Shanghai, China). The N2a cells were established by R.J. Klebe and F.H. Ruddle from autologous tumors of strain-A white mice. These cells are well-apposed and neuron-like with axon-like structures. N2a/APP695swe cells were purchased from Obio Technology (Shanghai, China). The APP695 Swedish mutant gene was transferred into N2a mouse neuroma cells to form a stable cell line capable of high expression of AD-related pathological indicators, such as Aβ and phosphorylated tau protein. All cells were cultured in high-glucose Dulbecco’s modified Eagle medium (DMEM; Gibco, Waltham, MA, USA) containing 10% fetal bovine serum (FBS, Gibco), and the N2a/APP695swe cell medium was supplemented with an additional 0.04% puromycin (5 mg/ml, Beyotime Institute of Biotechnology, Nantong, Jiangsu, China) to screen cells stably expressing APP695swe. The cells were cultured at 5% CO2 and 37°C and were treated with N-acetyl-L-cysteine (NAC; 5 mM, Beyotime), which was dissolved in double distilled water; LY294002 (1μM, Beyotime), SC79 (4μg/mL, Beyotime), and WZB117 (10μmol/L; Selleck, Houston, TX, USA), which were dissolved in dimethyl sulfoxide (DMSO; Solarbio, Beijing, China).
Enzyme-linked immunosorbent assay (ELISA)
The levels of Aβ1 - 40 and Aβ1 - 42 were detected according to the instructions of an ELISA kit (Signalway Antibody, SAB; Maryland, USA). Cell culture medium from each group was collected at 2000 rpm and centrifuged for 20 min, and the supernatants were collected for future use. The standards were diluted according to the instructions. To the blank wells, 50μL of sample diluent was added; to the standard wells, 50μL of standard was added; and to the test sample wells, 40μL of sample diluent and 10μL of the sample to be tested were added. The cells were incubated at 37°C for 30 min. Wash solution was prepared as a 1 : 30 ratio of concentrated wash solution:double-distilled water, and 200μL was added per well. The plates were washed 5 times. Next, 50μL of HRP-labeled reagent was added to each well except the blank wells, and the plates were incubated without shaking at 37°C for 30 min. Washing was again performed as described above. Then, 50μL of color solution A and 50μL of color solution B were added, aspirated and mixed well. The cells were incubated for 15 min at 37°C, and then 50μL of the termination solution was quickly added. The optical density (OD) value of each well was measured with a microplate reader at 450 nm.
Flow cytometry assays to determine ROS levels
The intracellular ROS content was detected according to the instructions of a ROS Detection Kit (Beyotime). DCFH-DA was diluted with serum-free medium at 1 : 1000 to achieve a final concentration of 10μmol/L. The cell culture solution was removed, and 1 mL of DCFH-DA was added to adequately cover the cells. The cells were incubated for 20 min in a cell culture box at 37°C. The cells were then washed three times with serum-free cell culture medium to fully remove the DCFH-DA that did not enter the cells. The samples were sent to the flow detection center of the Academy of Life Sciences, Chongqing Medical University, for detection. The DCF fluorescence, which indicated the intracellular ROS level, was detected by flow cytometry using a 488 nm excitation wavelength and 525 nm emission wavelength. The fluorescence intensities were detected before and after stimulation in real time or on a time point-by-time point basis.
Measurement of glucose uptake
Glucose uptake by cells was measured with a Glucose Kit (Nanjing Jian Cheng, Nanjing, China). Cell deposits were collected, washed twice in PBS at 1000 rpm, and centrifuged for 10 min, and the supernatant was discarded. Next, 300μL of PBS was added per tube, and the cells were lysed via sonication on ice (parameter settings: power 300 W, 3–5 s each time, 30 s interval, repeated 3–5 times). Each reagent was then added to the 96-well plate. To the blank wells, 2.5μL of deionized water and 250μL of working solution were added; to the calibration wells, 2.5μL of standard and 250μL of working solution were added; and to the sample wells, 2.5μL of sample and 250μL of working solution were added. Then, the well plates were incubated with gentle shaking at 37°C for 10 min, and the absorbance of each well was detected at 505 nm on a microplate reader. The glucose content in each group was calculated according to the following formula: glucose content (mmol/L)=(measured OD-blank OD)/ (standard OD-blank OD) * standard concentration (mmol/L)/protein concentration of sample to be tested (g/L).
Measurement of ATP content
The six-well plates were removed from the incubator, the medium was aspirated, and 200μL of lysis buffer was added to each well. The well contents were aspirated and mixed to fully lyse the cells. The plates were centrifuged at 4°C and 12000×g for 5 min, and the supernatant was collected. A series of ATP standard solutions were prepared with the following concentration gradient: 0.1, 1, and 10μmol/L. The ATP detection working solution was prepared with a 1 : 9 ATP detection reagent:ATP diluent ratio and stored on ice. The ATP working solution was added at 100μL per well, and the plates were incubated at room temperature for 5 min. Then, 20μL of sample/standard was added to each well and mixed quickly and gently. The sample RLU values were determined with a luminometer. The concentration of ATP in each sample group was calculated from the standard curve.
Western blot analysis
Total cellular protein was extracted and quantified according to a standard procedure. Specifically, N2a/WT and N2a/APP695swe cells were homogenized in RIPA lysis buffer with protease inhibitor PMSF at 4°C for 30 min and centrifuged at 13000 rpm at 4°C for 15 min to collect the supernatants. The protein concentration was measured with BCA assay reagent (Beyotime) according to the manufacturer’s protocol. Following sodium dodecyl sulfate–polyacrylamide gel electrophoresis (SDS–PAGE), the proteins were transferred onto a PVDF membrane (Solarbio). After saturation, the membranes were incubated at room temperature for 10 min in Quick Block™ Western Sealing fluid (Beyotime) and subsequently incubated with primary antibodies against GLUT1 (1 : 100000, Abcam, Cambridge, MA, USA), GLUT3 (1 : 1000, Proteintech, Wuhan, China), Akt (1 : 1000), p-Akt (1 : 1000), PI3K (1 : 1000), p-PI3K (1 : 1000), or β-actin (1 : 1000), all from SAB (Signalway Antibody, Maryland, USA), at 4°C overnight. The next day, the membranes were incubated with peroxidase-conjugated IgG (Beyotime) for 40 min, and enhanced chemiluminescence (ECL) solution was subsequently applied to the membranes for detection of protein bands.
Cell viability (CCK-8) assay
Cell viability rates were measured using a CCK-8 Proliferation Assay Kit (Solarbio). Cells were seeded into 96-well plates at a density of 3000/well; grown overnight; and then treated with LY294002 (5, 10, 20, or 40μM), SC79 (1, 2, 4, or 8μg/mL), WZB117 (1, 5, 10, or 15μmol/L), or NAC (3, 5, 10, or 15 mM) for up to 72 h. Cultures were terminated after each time point, and 10μL of CCK-8 reagent was added to each well. Incubation continued for 1 h. The OD value was measured at 450 nm on a microplate reader. Cell growth curves were plotted with time on the abscissa and the OD values on the ordinate. The optimal action concentration was selected with consideration of both the growth curves and the microscopic cell state.
Statistical analysis
All the data were expressed as the means±SEMs, statistical analysis was performed using the SPSS 13.0 package (SPSS Inc., Chicago, USA). ANOVA was used whenever more than two groups were compared, and the significance level was set at p < 0.05. A repeated-measurement variance test was used to analyze time point comparisons. p values of less than 0.05 (p < 0.05) were considered to indicate statistical significance.
RESULTS
Increased Aβ and ROS levels in N2a/APP695swe cells
Compared with those in N2a/WT cells, Aβ1 - 40 and Aβ1 - 42 levels were increased in N2a/APP695swe cells (Fig. 1A and B, p < 0.0001, p < 0.0001). Previous studies have reported that hypometabolism of glucose is most likely associated with reduced expression and functioning of key proteins in the glucose metabolism pathway, which is suppressed by high levels of ROS [17, 21]. Thus, we measured ROS levels by flow cytometry techniques, and the results showed that the ROS concentrations in N2a/APP695swe cells were much higher than those in N2a/WT cells (Fig. 1C, p = 0.0002).
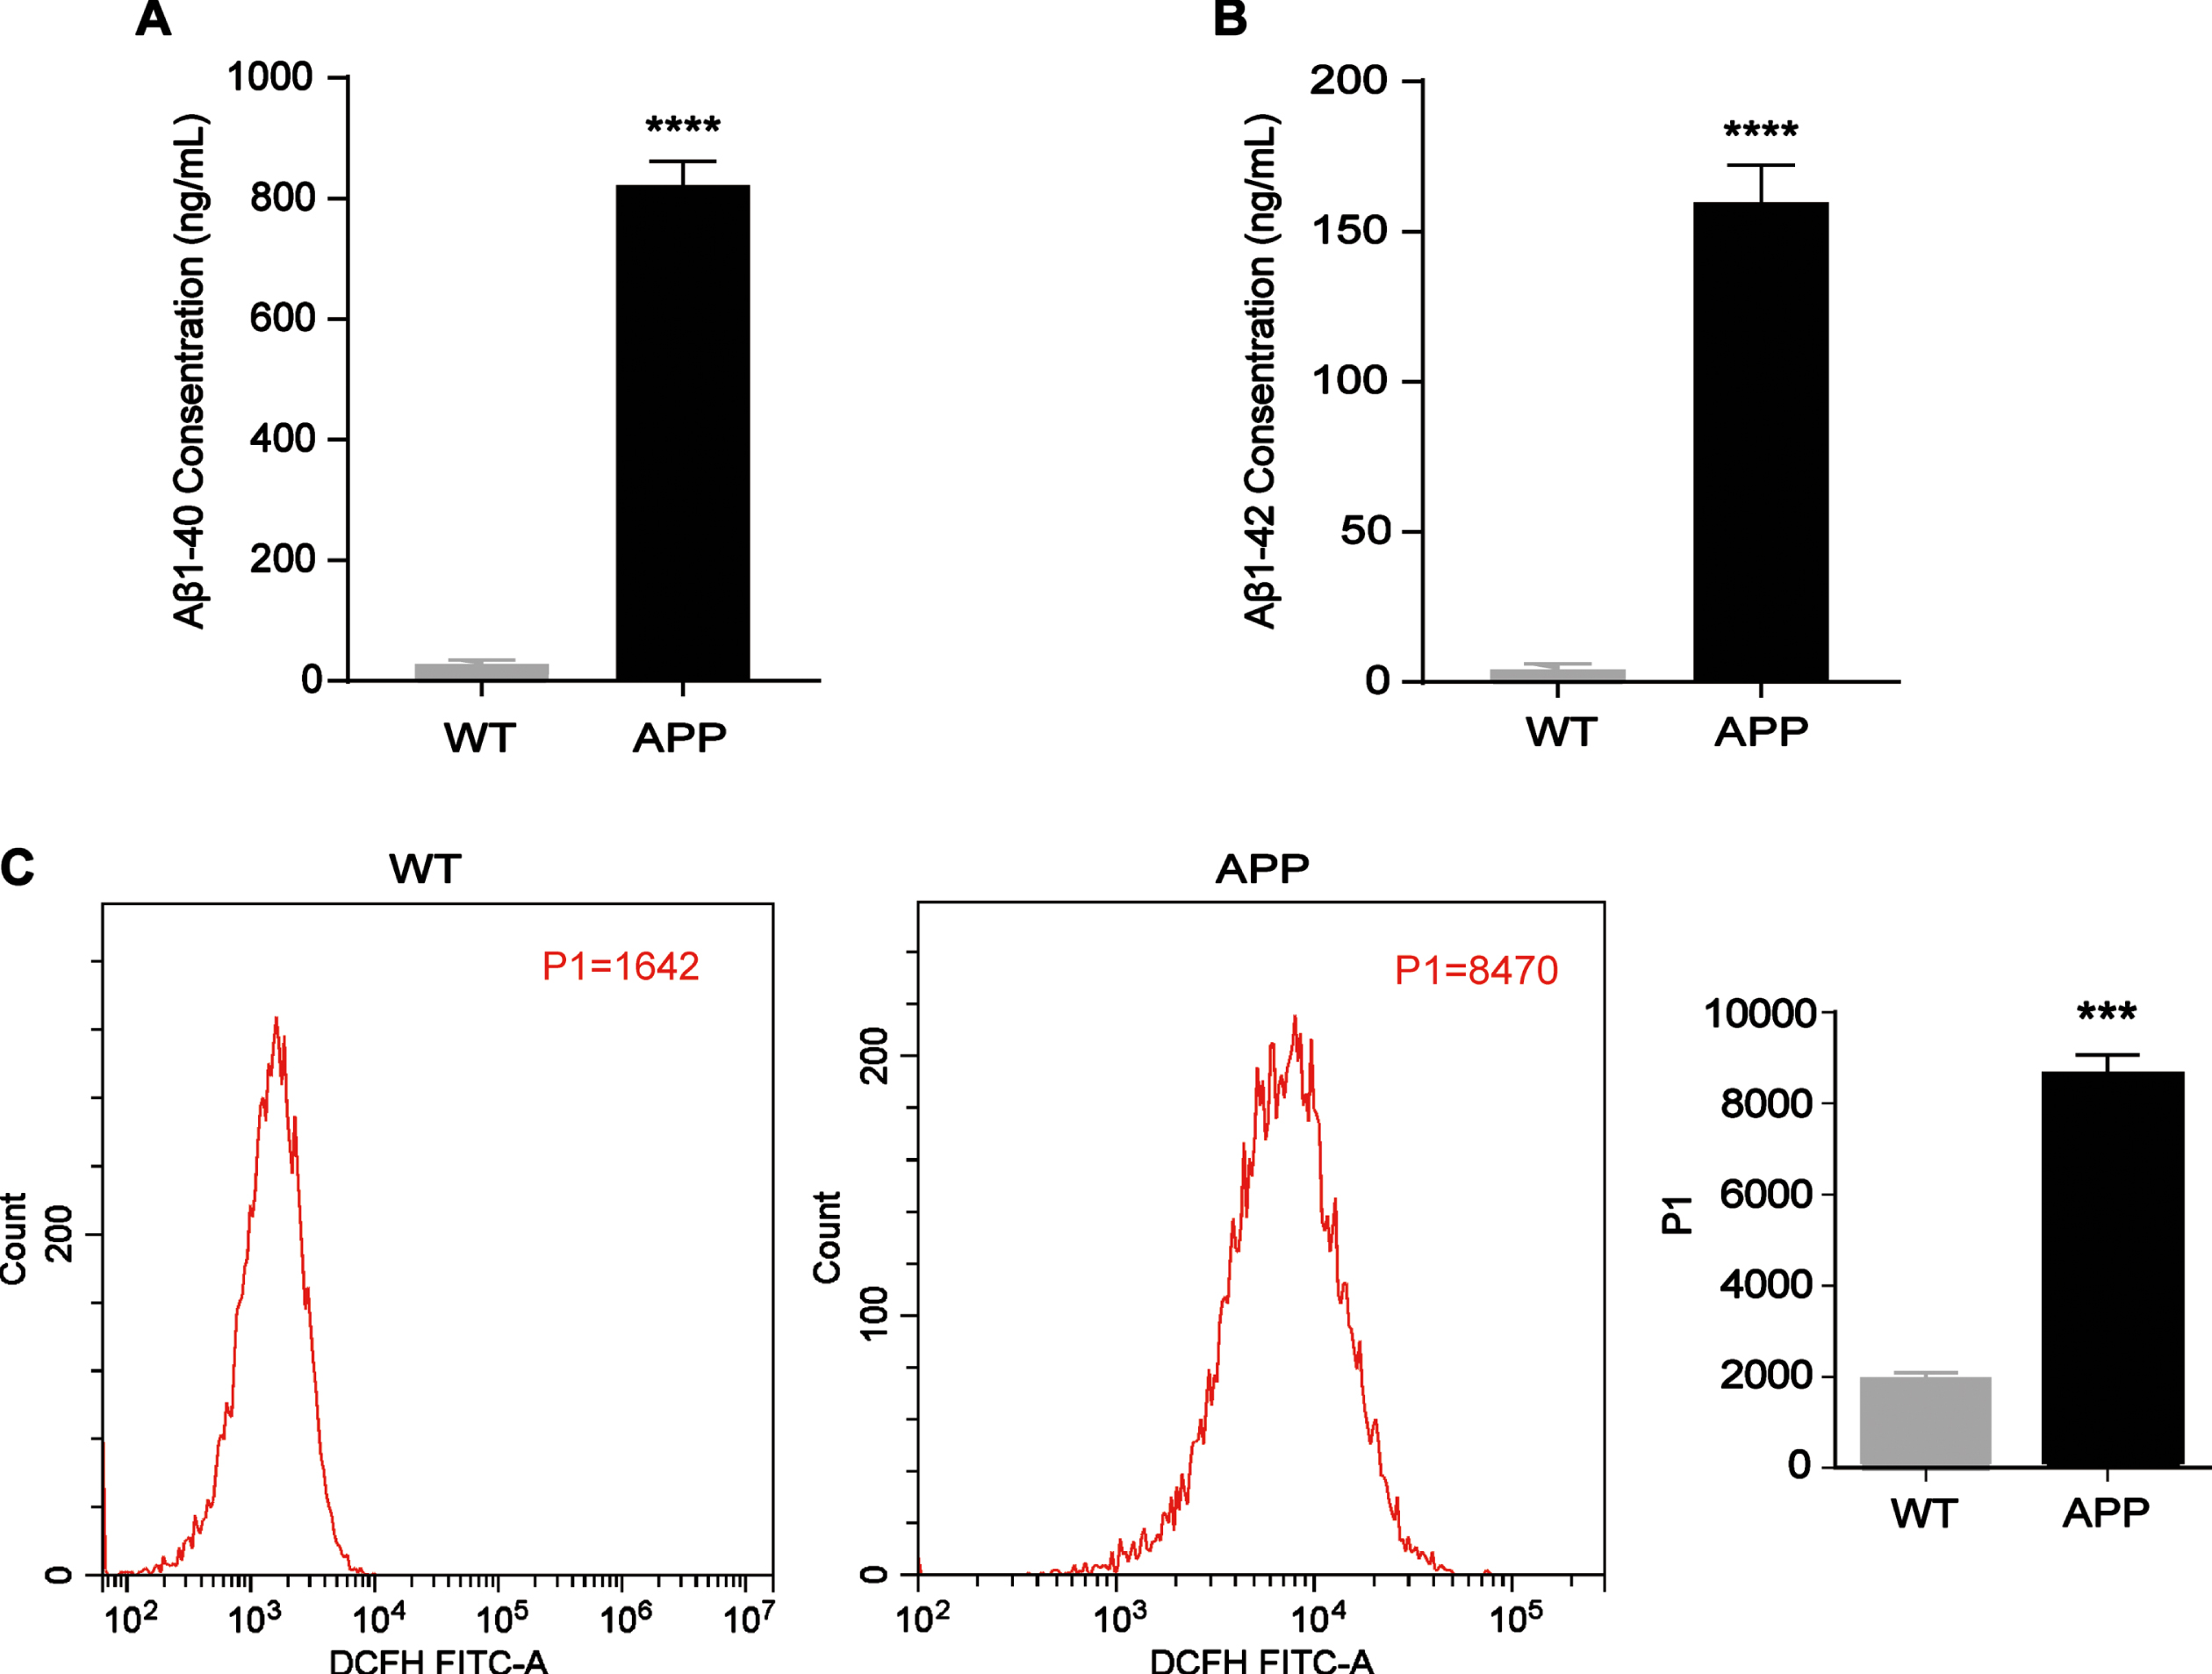
Increased Aβ and ROS levels in N2a/APP695swe cells. A, B) N2a/WT and N2a/APP695swe cell culture media were collected to analyze Aβ levels. The levels of Aβ1 - 40 and Aβ1 - 42 in the N2a/APP695swe group were significantly higher than those in the N2a/WT group. C) Intracellular ROS levels were detected by flow cytometry. As shown in the column chart, the ROS level (P1 value) in the N2a/APP695swe group was higher than that in the N2a/WT group. n = 3, ***p<0.001, ****p<0.0001.
Decreased GLUT1 expression, glucose uptake, and ATP levels in N2a/APP695swe cells
To determine whether the glucose metabolism of N2a/APP695swe cells was impaired, the glucose uptake and ATP levels of N2a/WT and N2a/APP695swe cells were detected. Both the glucose uptake and ATP levels of N2a/APP695swe cells were significantly lower than those of N2a/WT cells (Fig. 2A and 2B, p = 0.0062, p = 0.0057). Considering that GLUT1 and GLUT3 are the main transporters responsible for the acquisition of glucose by nerve cells, we tested the levels of these two proteins to analyze the possible reasons for the impaired cellular glucose uptake. The Western blot results indicated that the expression of GLUT1 was significantly lower in the N2a/APP695swe group than in the N2a/WT group (Fig. 2C, p = 0.0138), while the expression of GLUT3 was not significantly different between the groups (Fig. 2D, p > 0.05).
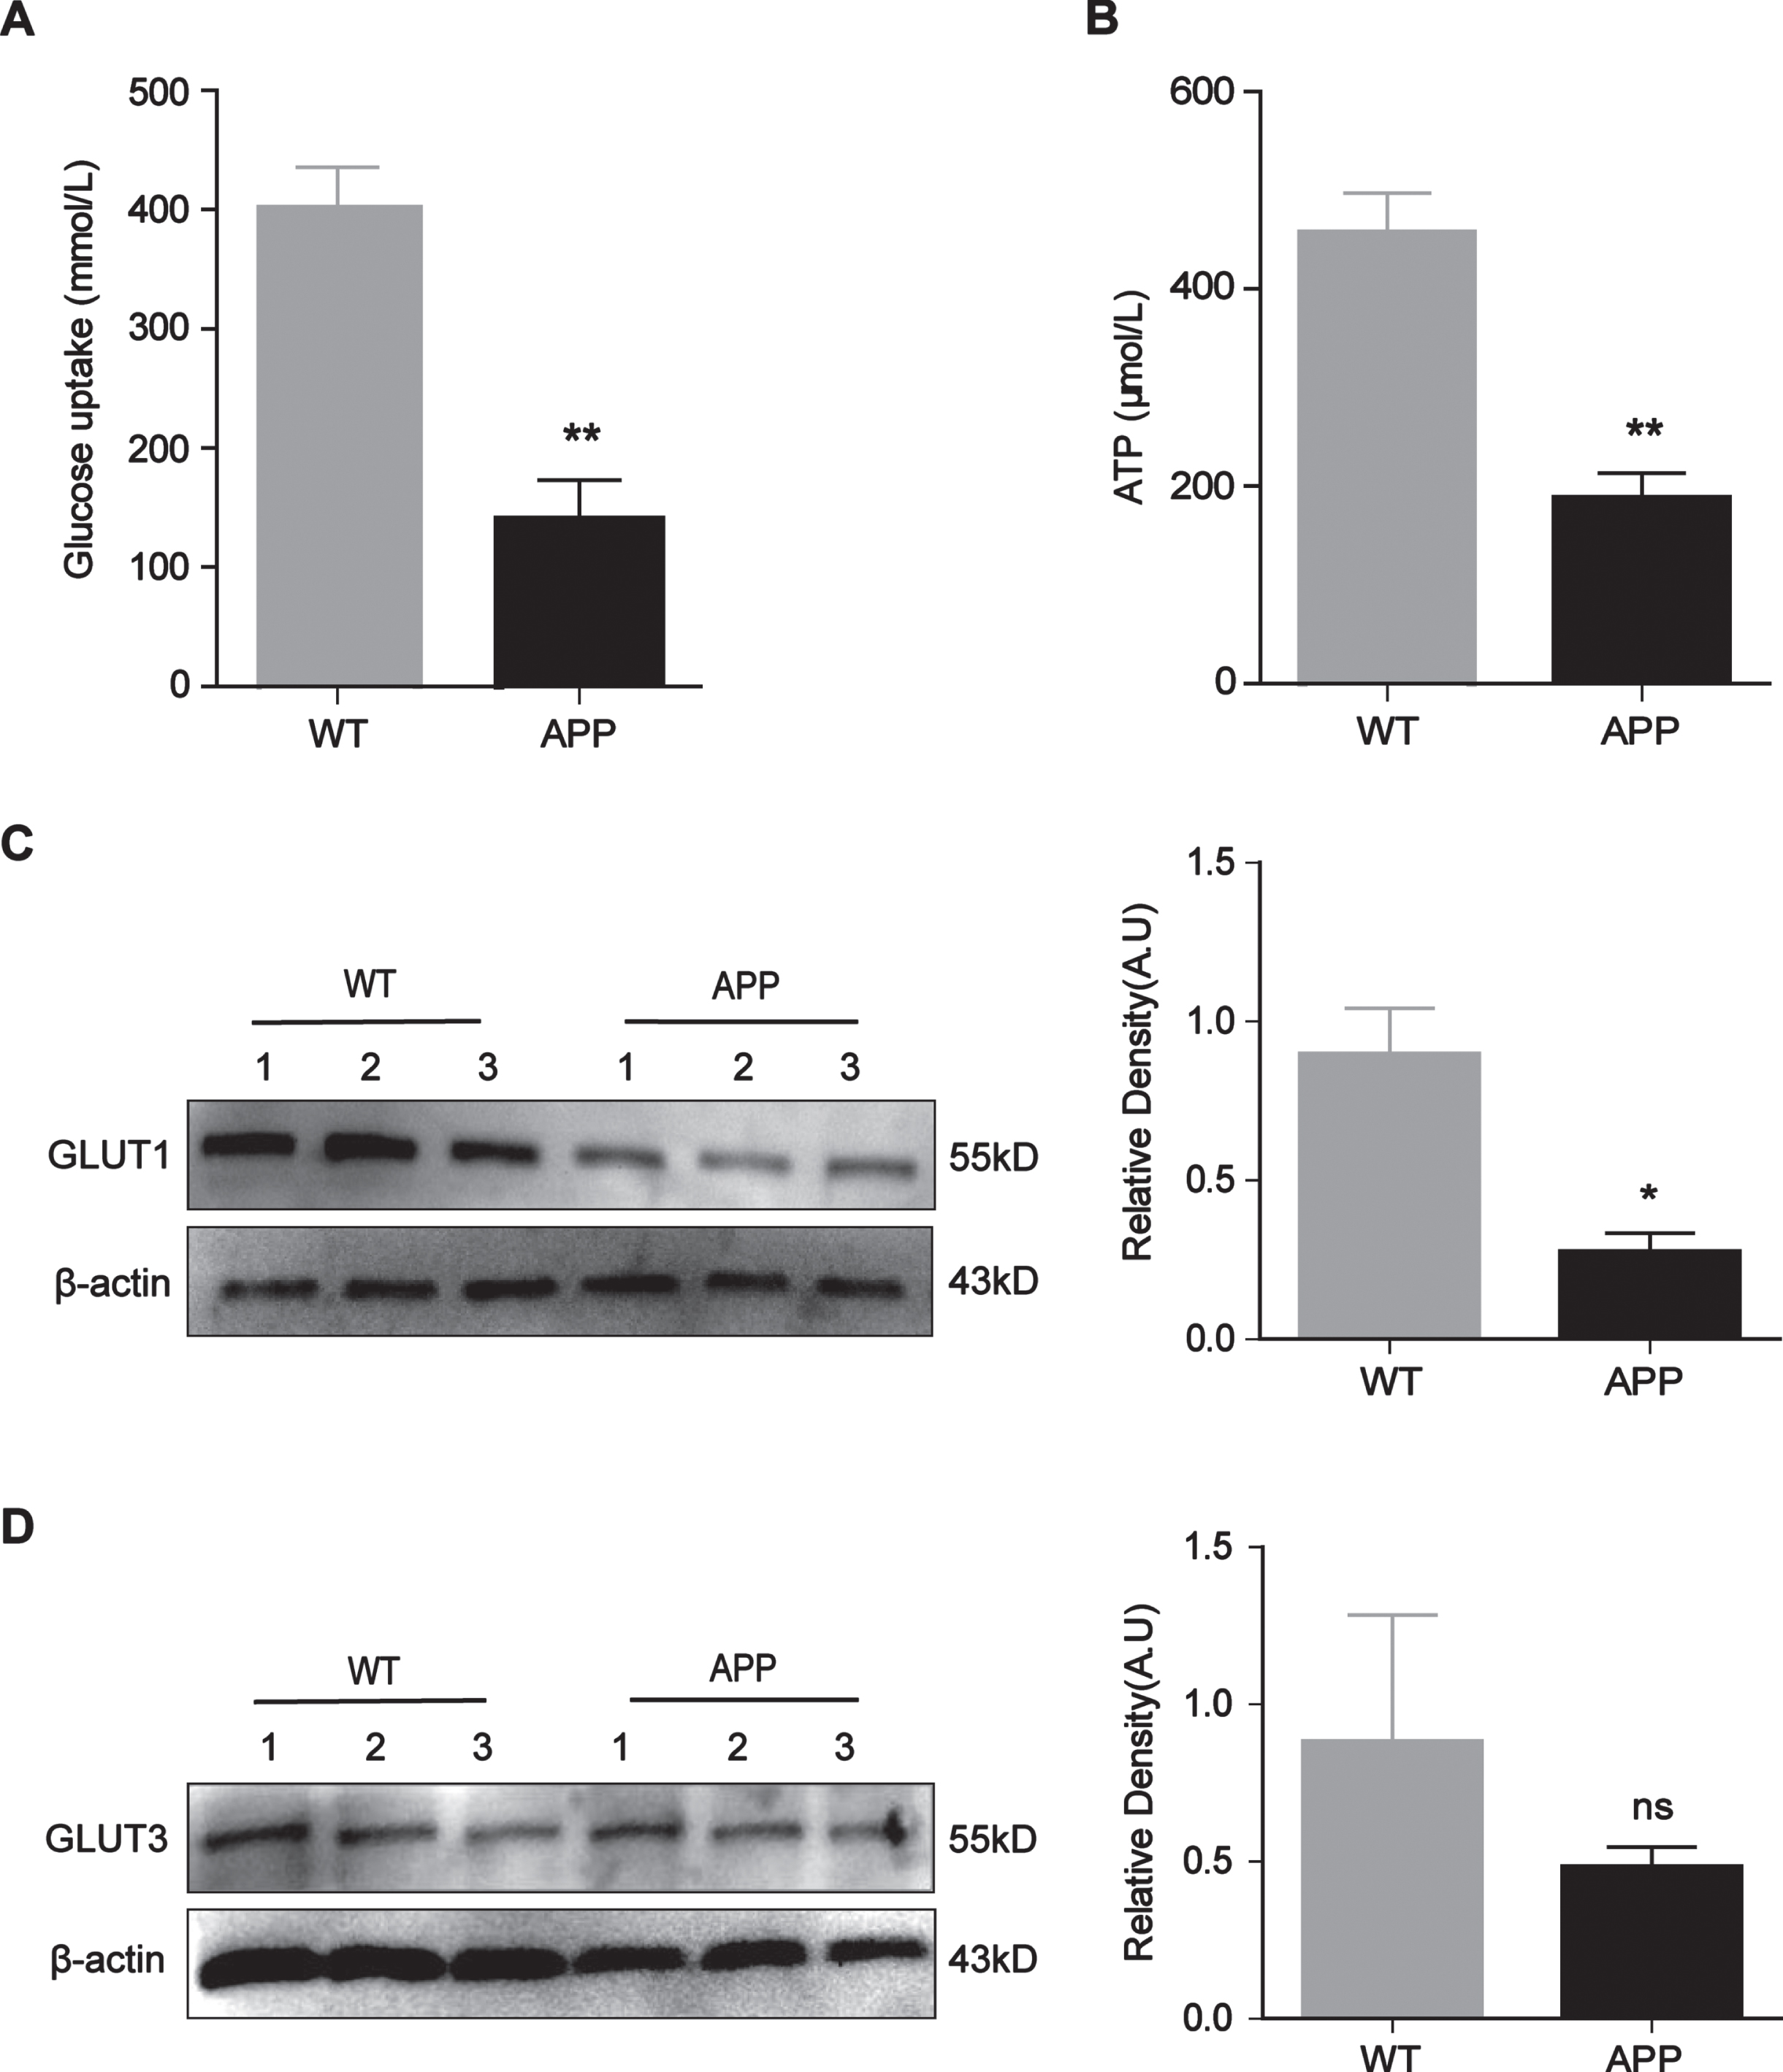
Decreased GLUT1 expression, glucose uptake and ATP levels in N2a/APP695swe cells N2a/WT and N2a/APP695swe cells were collected separately from three different culture flasks, and the proteins were extracted for western blot analysis. A, B) Measurement of intracellular glucose uptake and ATP levels. C, D) Western blot analysis of the GLUT1 and GLUT3 proteins. GLUT1 expression was decreased in the N2a/APP695swe group, while GLUT3 expression was no statistical difference. The numbers 1, 2, and 3 represent three different dates of protein extraction. n = 3, *p<0.05, **p<0.01, ns: not significant.
GLUT1 enhanced glucose uptake and ATP levels and reduced Aβ levels in N2a/APP695swe cells
To verify that the disordered cellular glucose metabolism was caused by low GLUT1 expression, we transfected N2a/WT and N2a/APP695swe cells with GLUT1-overexpressing plasmids, and western blot analysis confirmed the protein expression of GLUT1 after transfection (Fig. 3A, p = 0.0024). As we expected, after GLUT1 was upregulated, glucose uptake and ATP levels were significantly increased in both the N2a/WT and N2a/APP695swe groups (Fig. 3B and 3C, p = 0.0055, p = 0.0045). Then, we tested the Aβ levels, and the ELISA results showed that both Aβ1 - 40 and Aβ1 - 42 levels were reduced (Fig. 3D and 3E, p = 0.0099, p = 0.0384).

GLUT1 enhanced glucose uptake and ATP levels and reduced Aβ levels in N2a/APP695swe cells. A) GLUT1 overexpression plasmids were transfected into N2a/WT and N2a/APP695swe cells for 24 h, and the GLUT1 protein levels were detected by western blot analysis. B, C) Measurement of intracellular glucose uptake and ATP levels. After GLUT1 was upregulated, glucose uptake and ATP levels were increased in both groups. D, E) N2a/WT and N2a/APP695swe cell culture media were collected to analyze Aβ levels. After overexpression of GLUT1, the levels of Aβ1 - 40 and Aβ1 - 42 were markedly reduced in the N2a/APP695swe group. The results from one of three experiments are shown. n = 3, *p<0.05, **p<0.01, ***p<0.001.
The ROS scavenger N-acetyl-L-cysteine (NAC) increased GLUT1 expression, glucose uptake and ATP levels and decreased Aβ levels in N2a/APP695swe cells
Next, we treated the cells with NAC, which is commonly used as a scavenger of ROS. We explored four concentrations (3, 5, 10, and 15 mM) according to the drug instructions for NAC and the relevant literature [22]. The CCK-8 results showed that cells incubated with 5 mM NAC were the most active, while almost all cells died after incubation with NAC at concentrations greater than 5 mM (Fig. 4A). After NAC treatment for 24 h, the ROS concentrations were decreased in N2a/APP695swe cells (Fig. 4B, p = 0.0088). The western blot results showed that GLUT1 expression was significantly upregulated compared with that in the control group (Fig. 4C, p = 0.0066), and glucose uptake and ATP levels were also increased (Fig. 4D and 4E, p = 0.0001, p = 0.0013). In addition, the levels of Aβ1 - 40 and Aβ1 - 42 in N2a/APP695swe cells were significantly decreased (Fig. 4F and 4G, p = 0.0058, p = 0.0066).
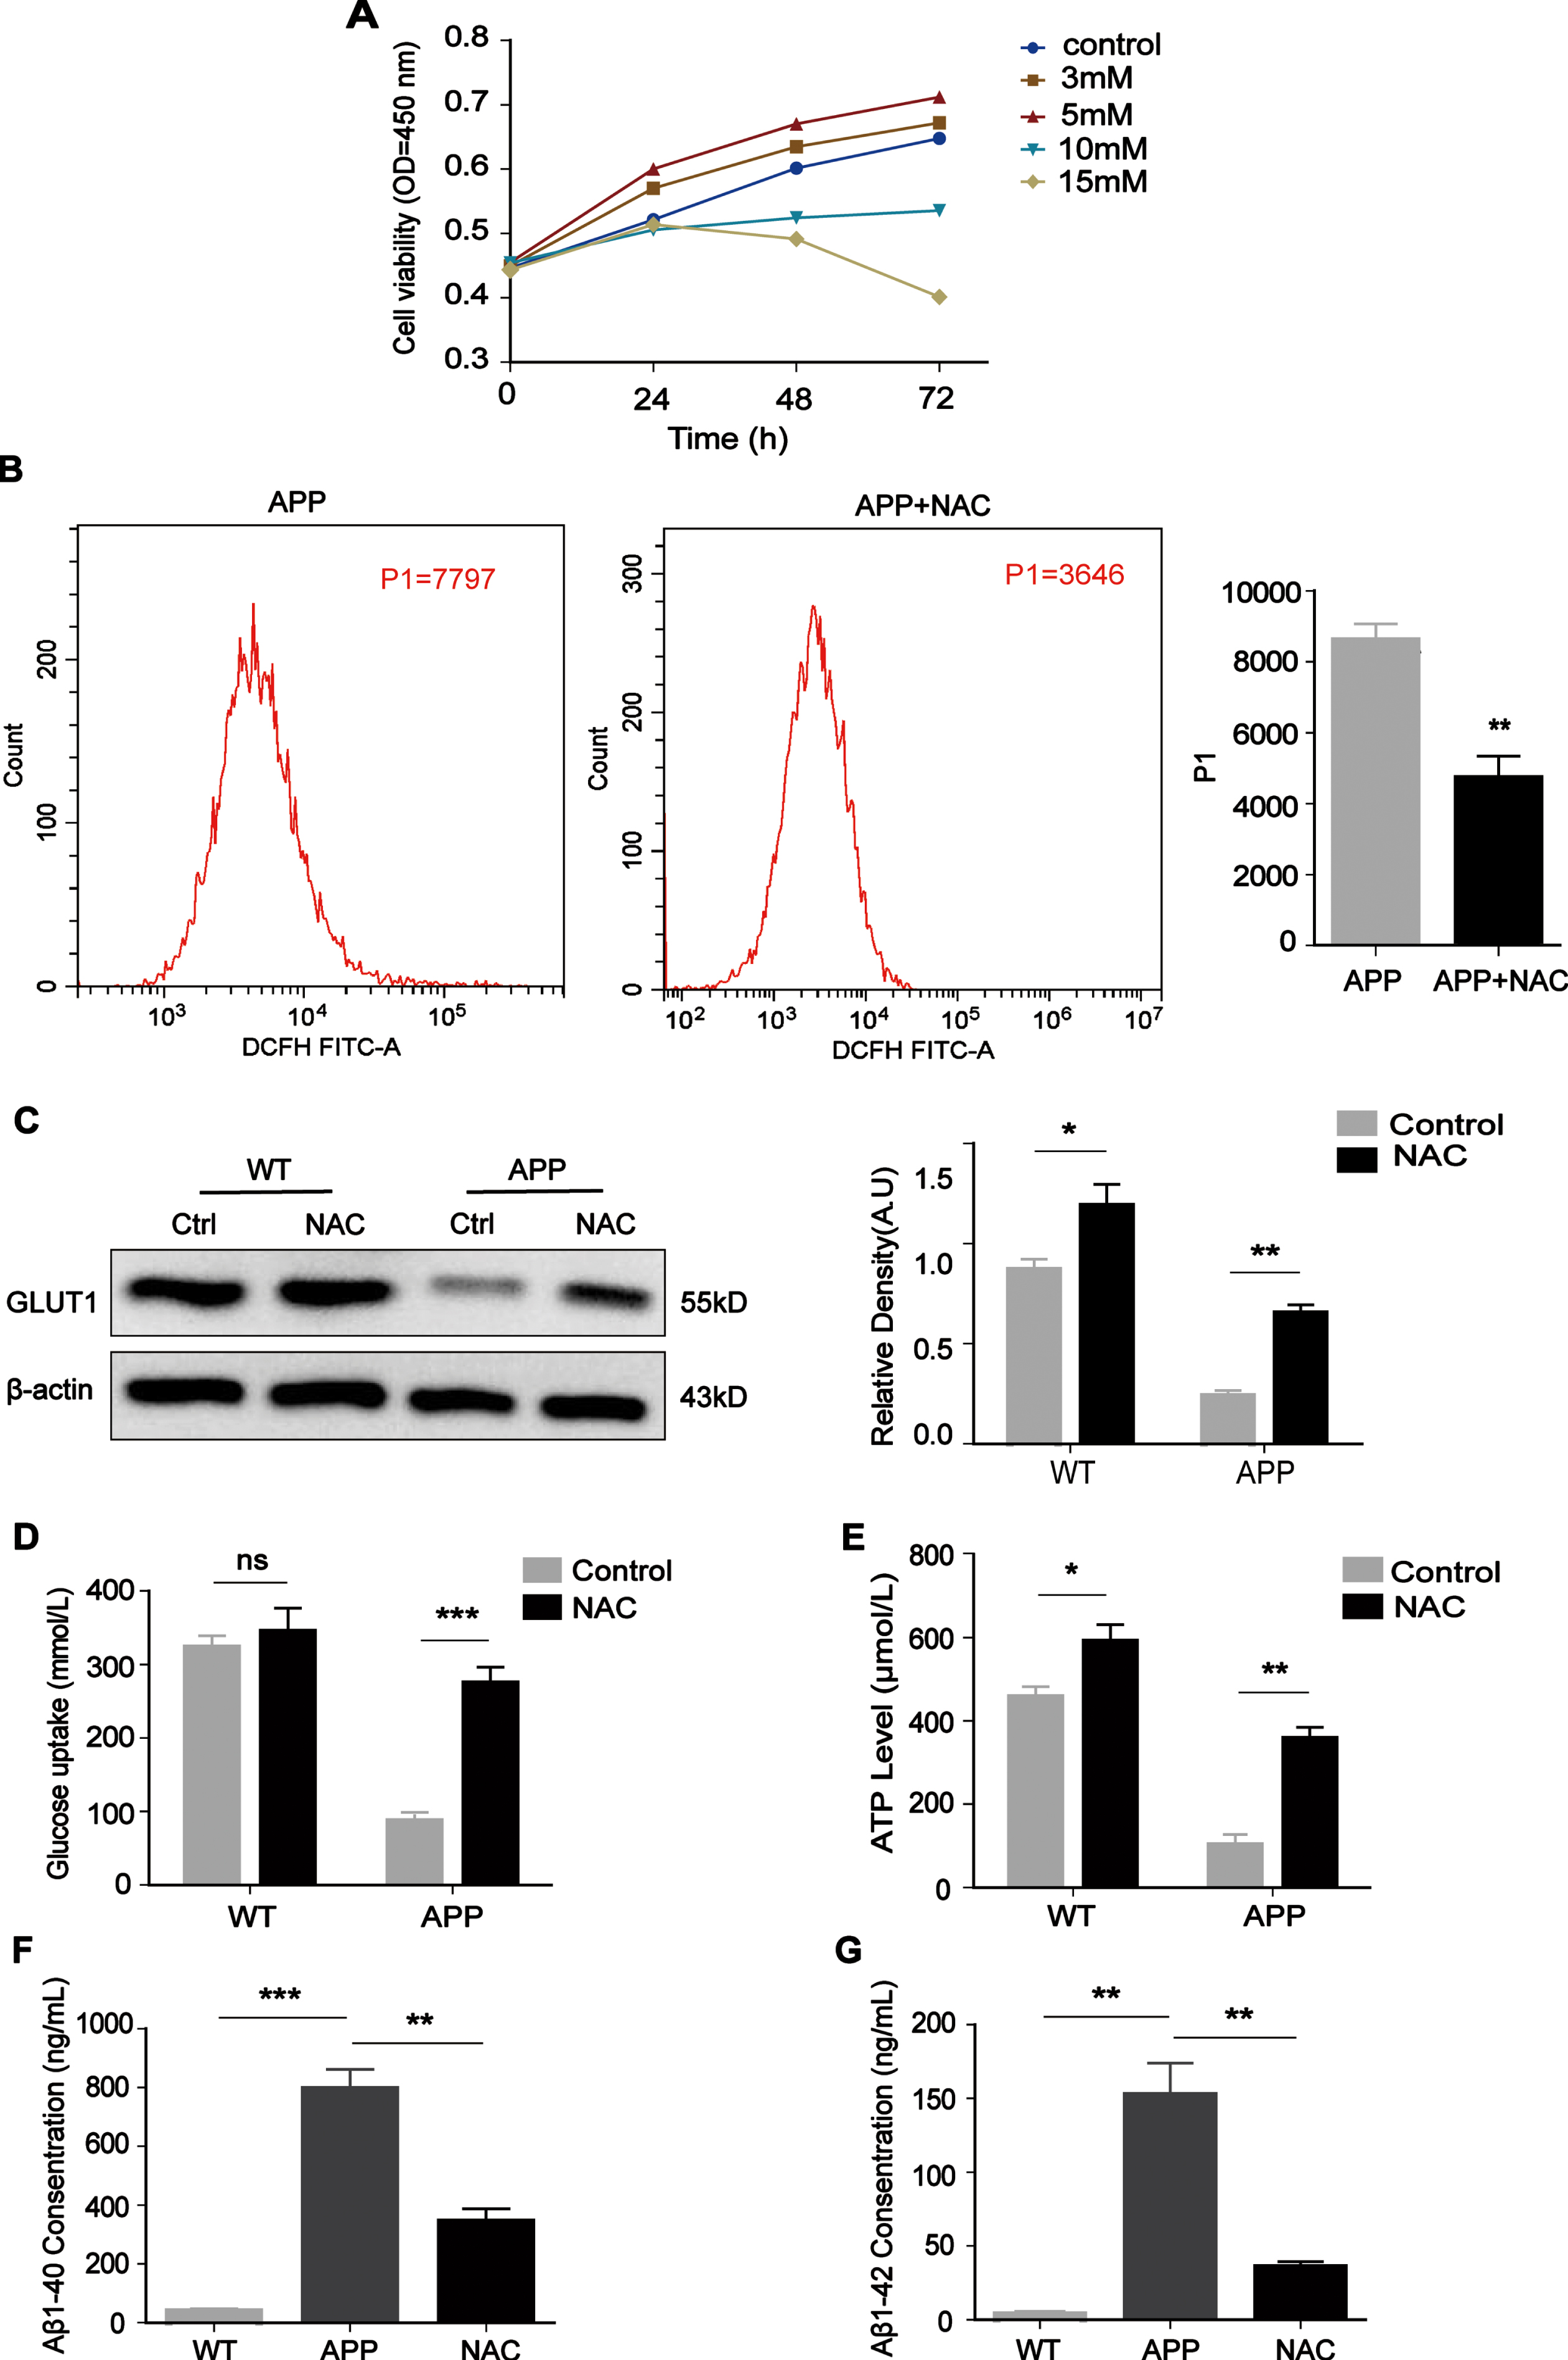
The ROS scavenger NAC increased GLUT1 expression, glucose uptake and ATP levels and decreased Aβ levels in N2a/APP695swe cells. A) The effect of NAC on viability in N2a/APP695swe cells was analyzed by CCK-8 assay, and 5 mM was chosen as the optimal concentration. B) After NAC treatment for 24 h, ROS concentrations decreased in N2a/APP695swe cells. C) GLUT1 expression was analyzed by western blotting after treatment with NAC for 24 h. D, E) Measurement of intracellular glucose uptake and ATP levels. After NAC treatment for 24 h, the glucose uptake and ATP levels were increased. F, G) After NAC treatment for 24 h, the levels of Aβ1 - 40 and Aβ1 - 42 were decreased in N2a/APP695swe cells. The results from one of three experiments are shown. n = 3, *p<0.05, **p<0.01, ***p<0.001.
Phosphorylation of PI3K/Akt pathway members is decreased in N2a/APP695swe cells
To clarify the mechanism by which ROS regulate GLUT1, we further tested the PI3K/Akt signaling pathway, an important upstream pathway that controls GLUT1. Our results suggested that the phosphorylation levels of PI3K (p = 0.0026) and Akt (p = 0.0403) in the N2a/APP695swe group were significantly lower than those in the N2a/WT group. The total protein expression levels of PI3K and Akt were no statistical difference (Fig. 5A, B).

Phosphorylation of PI3K/Akt pathway components was decreased in N2a/APP695swe cells A, B) The levels of PI3K/Akt pathway members were analyzed by western blotting. The numbers 1, 2, and 3 represent three different dates of protein extraction. n = 3, *p<0.05, **p<0.01.
NAC upregulated the PI3K/Akt/GLUT1 pathway, increased glucose uptake and ATP levels, and decreased Aβ levels
Then, we treated N2a/APP695swe cells with NAC and/or the PI3K inhibitor LY294002. LY294002 is a potent inhibitor of PI3K activity based on its quercetin structure, which inhibits PI3K by reversibly binding to the ATP site of PI3K [23]. According to the drug instructions and literature [24], we selected four concentrations (5, 10, 20, and 40μM) from which to determine the optimal concentration of LY294002 for N2a/APP695swe cells. The CCK-8 results showed that the cell viability was significantly reduced after treatment with 20μM LY294002 (Fig. 6A), whereas the cells became shrunken after treatment with 40μM LY294002 for 24 h; thus, we chose 20μM as the drug concentration. We found that p-PI3K, p-Akt, and GLUT1 expression was increased after NAC treatment but decreased after LY294002 addition (Fig. 6B, p = 0.0006, p = 0.0008, p = 0.0009). Similarly, the glucose uptake and ATP levels were significantly reduced after the cells were incubated with LY294002 in medium containing NAC (Fig. 6C and 6D, p = 0.0017, p = 0.0054). Interestingly, the levels of Aβ1 - 40 and Aβ1 - 42 increased after the addition of LY294002 (Fig. 6E and 6F, p = 0.0009, p = 0.0117). These data indicate that maintaining the activity of the PI3K/Akt/GLUT1 pathway is essential for Aβ clearance.
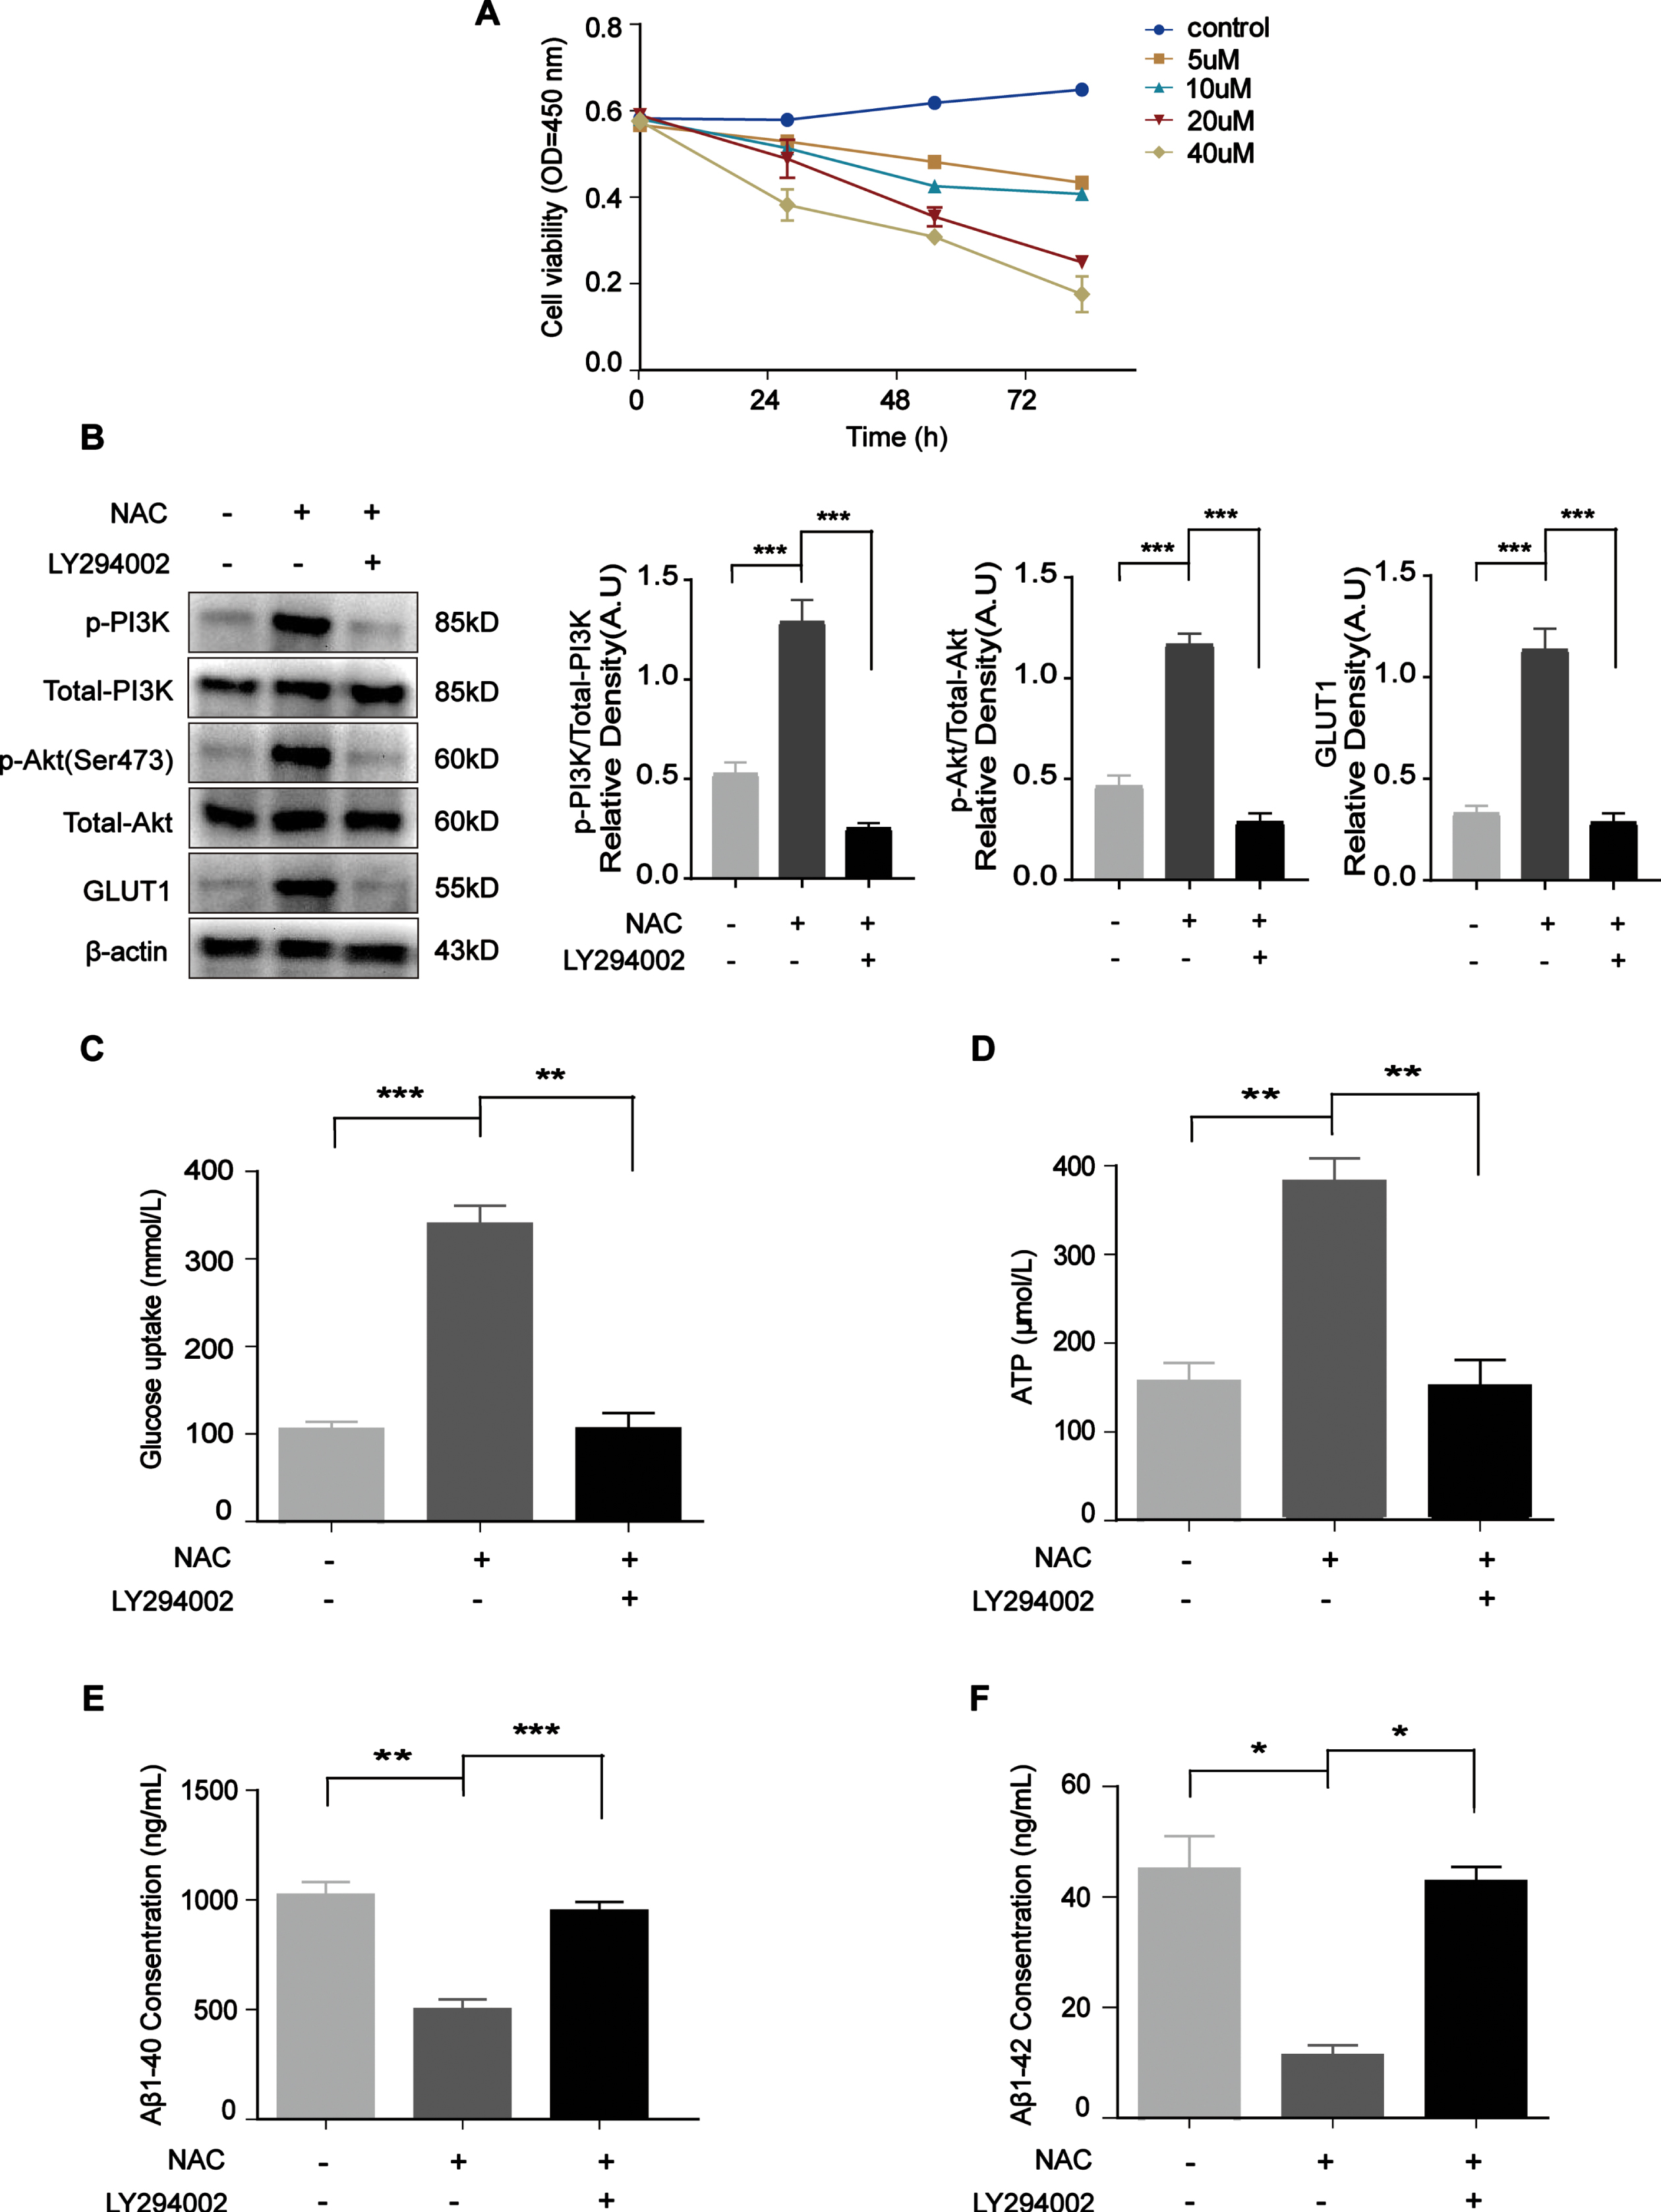
NAC upregulated PI3K/Akt/GLUT1 pathway member levels, increased glucose uptake, and ATP levels, and decreased Aβ levels. A) The effect of LY294002 on viability in N2a/APP695swe cells was analyzed by CCK-8 assay, and 20μM LY294002 was chosen as the optimal concentration. B) Western blot results for p-PI3K/total PI3K, p-Akt/total Akt, and GLUT1 after treatment with NAC and/or LY294002 for 24 h. C, D) The glucose uptake and ATP levels were increased after NAC treatment for 24 h but decreased after LY294002 addition. E, F) N2a/APP695swe cell culture medium was collected to analyze Aβ levels. The levels of Aβ1 - 40 and Aβ1 - 42 were reduced after NAC treatment for 24 h but increased after LY294002 addition. The results from one of three experiments are shown. n = 3, *p<0.05, **p<0.01, ***p<0.001.
Activated PI3K/Akt/GLUT1 increased glucose uptake and ATP levels and decreased Aβ levels in N2a/APP695swe cells
To further demonstrate that the PI3K/Akt pathway improves glucose uptake in a manner dependent on GLUT1, we cotreated cells with SC79, an Akt activator, and WZB117, a GLUT1-specific inhibitor. WZB117 binds to amino acid residues in the central channel region of GLUT1 to form three hydrogen bonds, thereby inhibiting GLUT1 [25]. Likewise, we selected four concentrations (1, 2, 4, and 8μg/mL) based on the drug specifications and the literature [26] to screen the optimal concentration of SC79 for cells. The CCK-8 results showed that cell viability was increased at 4μg/mL SC79 (Fig. 7A). We determined that the optimal concentration of WZB117 was 10μmol/L based on the instructions and CCK-8 assay results because most of the cells died when the WZB117 concentration was 15μmol/L (Fig. 7B). After cells had been incubated with SC79 and WZB117 for 24 h, glucose uptake and ATP levels were markedly and significantly decreased (Fig. 7C and 7D, p = 0.0002, p = 0.0005). The levels of Aβ1 - 40 and Aβ1 - 42 were reduced after SC79 treatment for 24 h but increased after WZB117 addition (Fig. 7E and 7F, p = 0.0212, p = 0.0006).
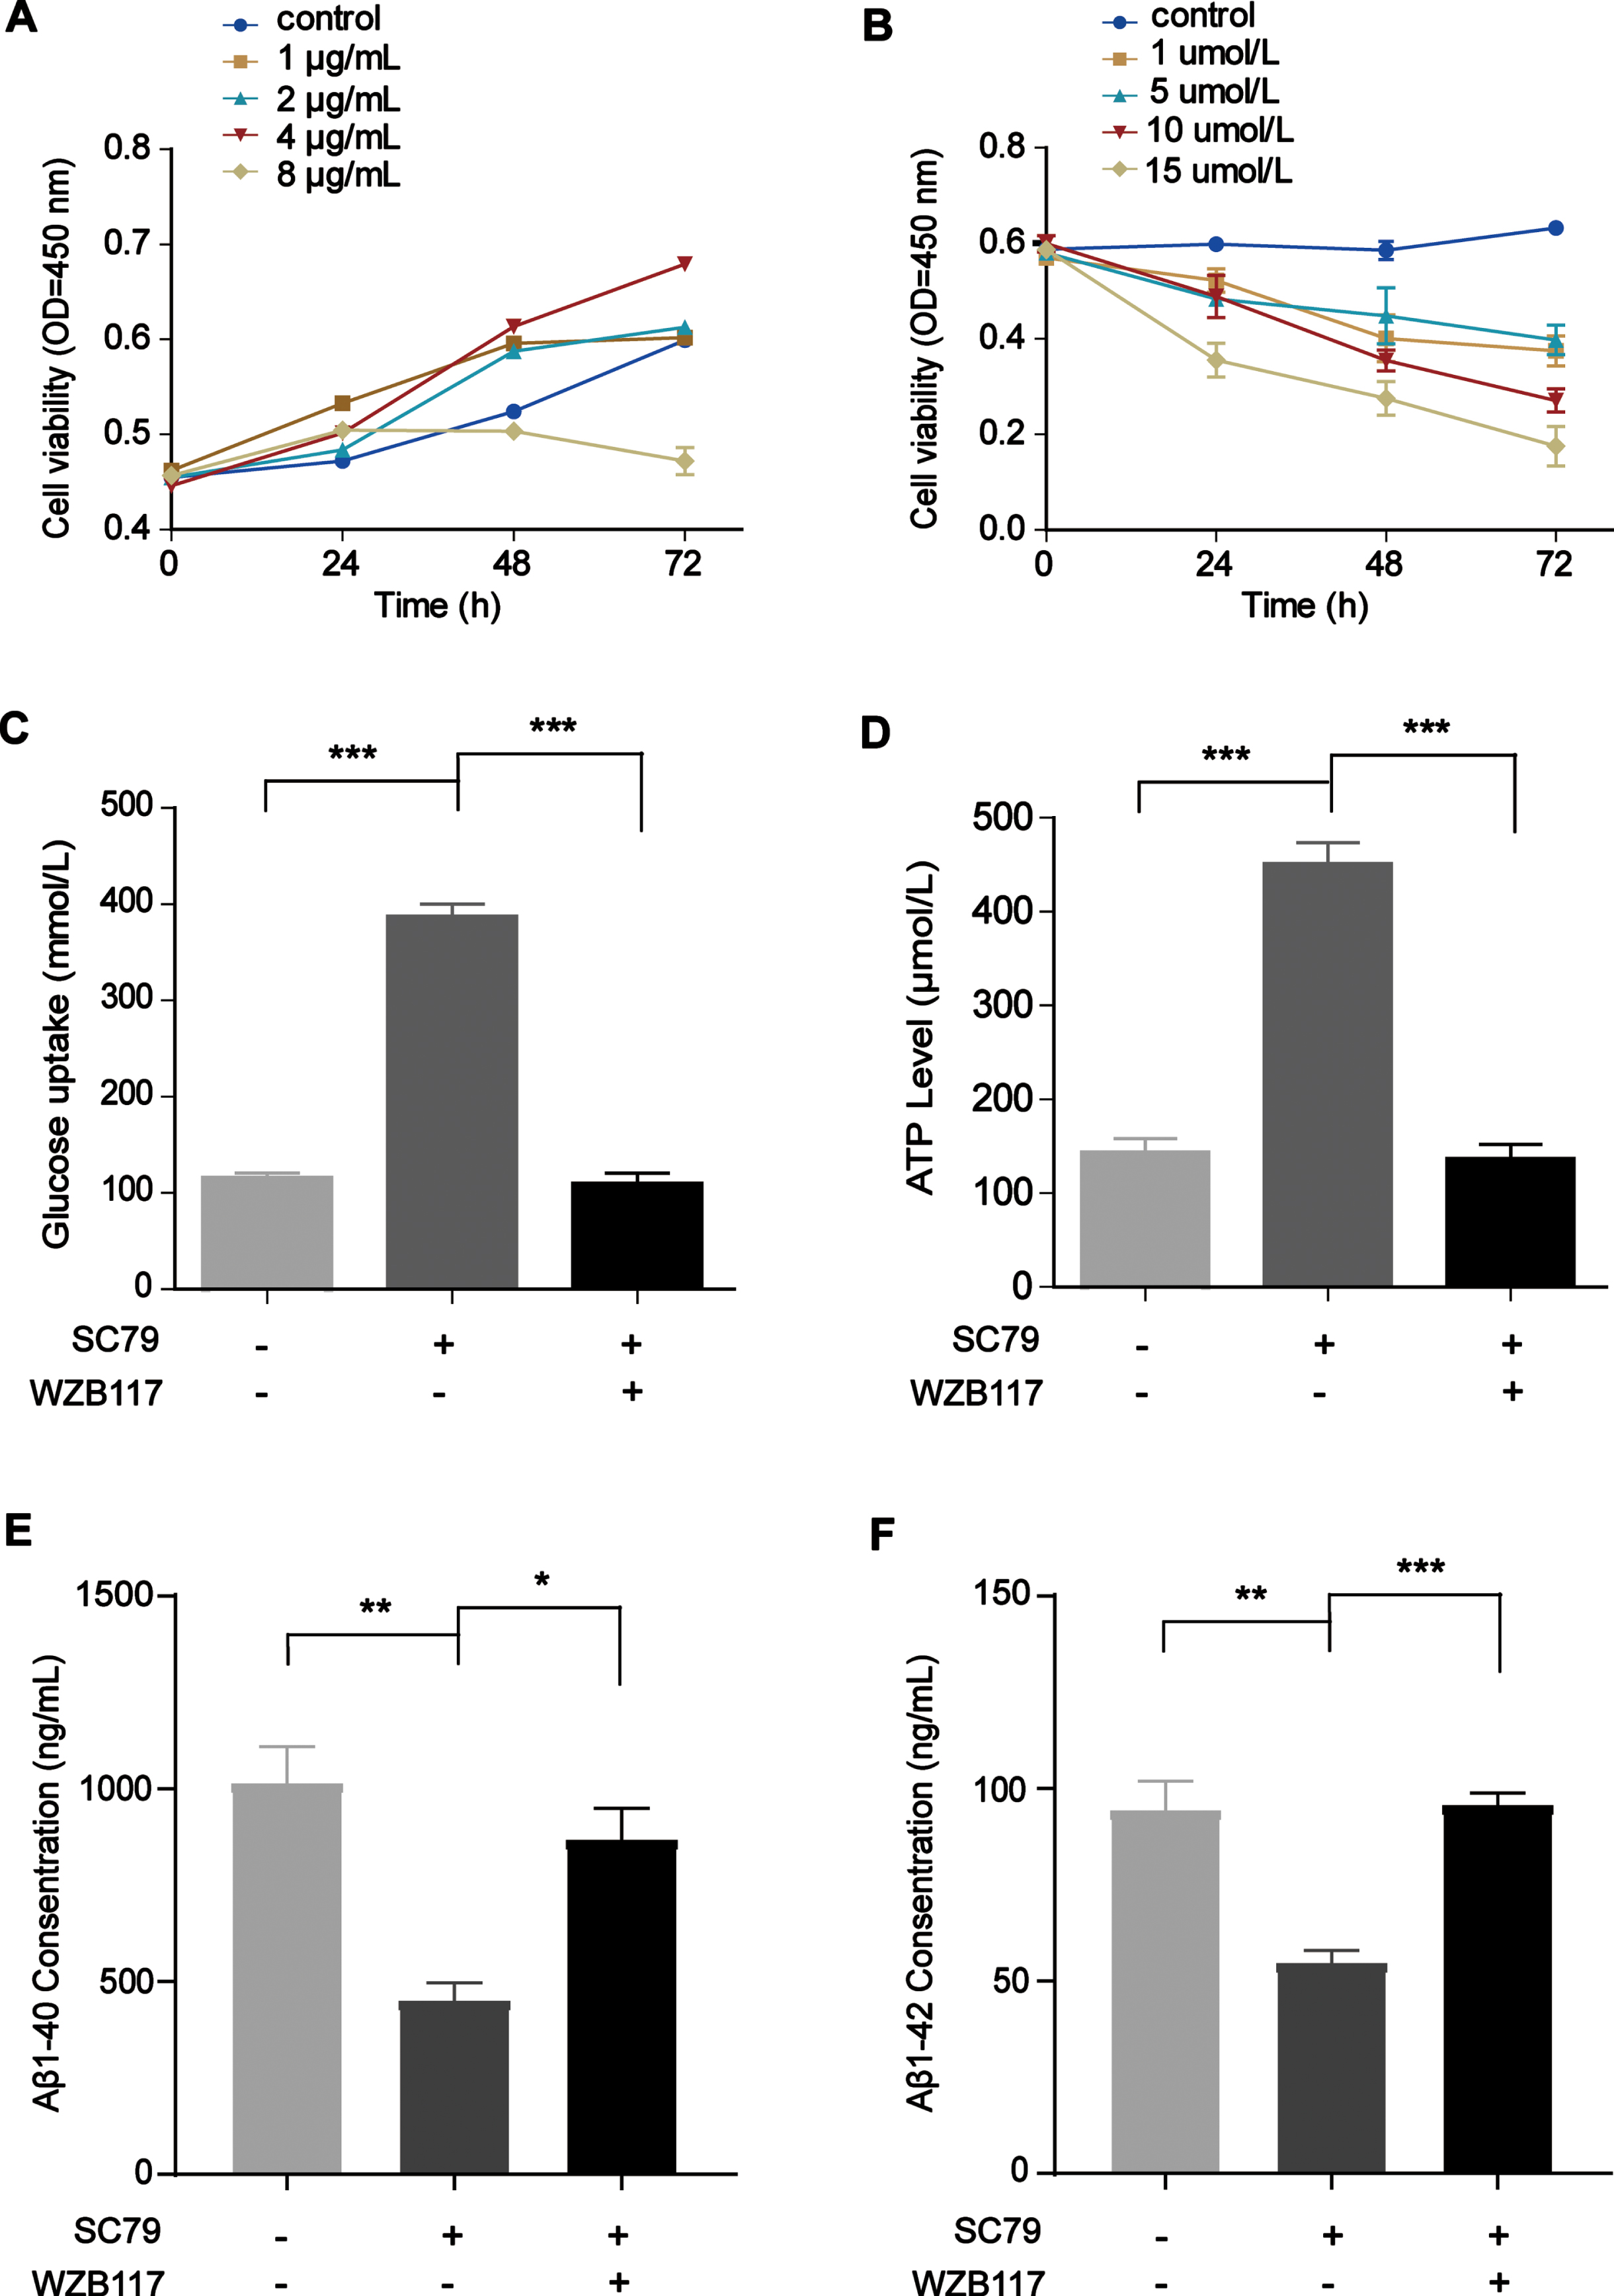
Activation of PI3K/Akt/GLUT1 increased glucose uptake and ATP levels and decreased Aβ levels in N2a/APP695swe cells. A) The effect of SC79 on viability in N2a/APP695swe cells was analyzed by CCK-8 assay, and 4μg/mL SC79 was chosen as the optimal concentration. B) The effect of WZB117 on viability in N2a/APP695swe cells was analyzed by CCK-8 assay, and 10μmol/L was chosen as the optimal concentration. C, D) The glucose uptake and ATP levels were increased after SC79 treatment for 24 h but decreased after WZB117 addition. E, F) N2a/APP695swe cell culture medium was collected to analyze Aβ levels. The levels of Aβ1 - 40 and Aβ1 - 42 were reduced after SC79 treatment for 24 h but increased after WZB117 addition. The results from one of three experiments are shown. n = 3, *p<0.05, **p<0.01, ***p<0.001.
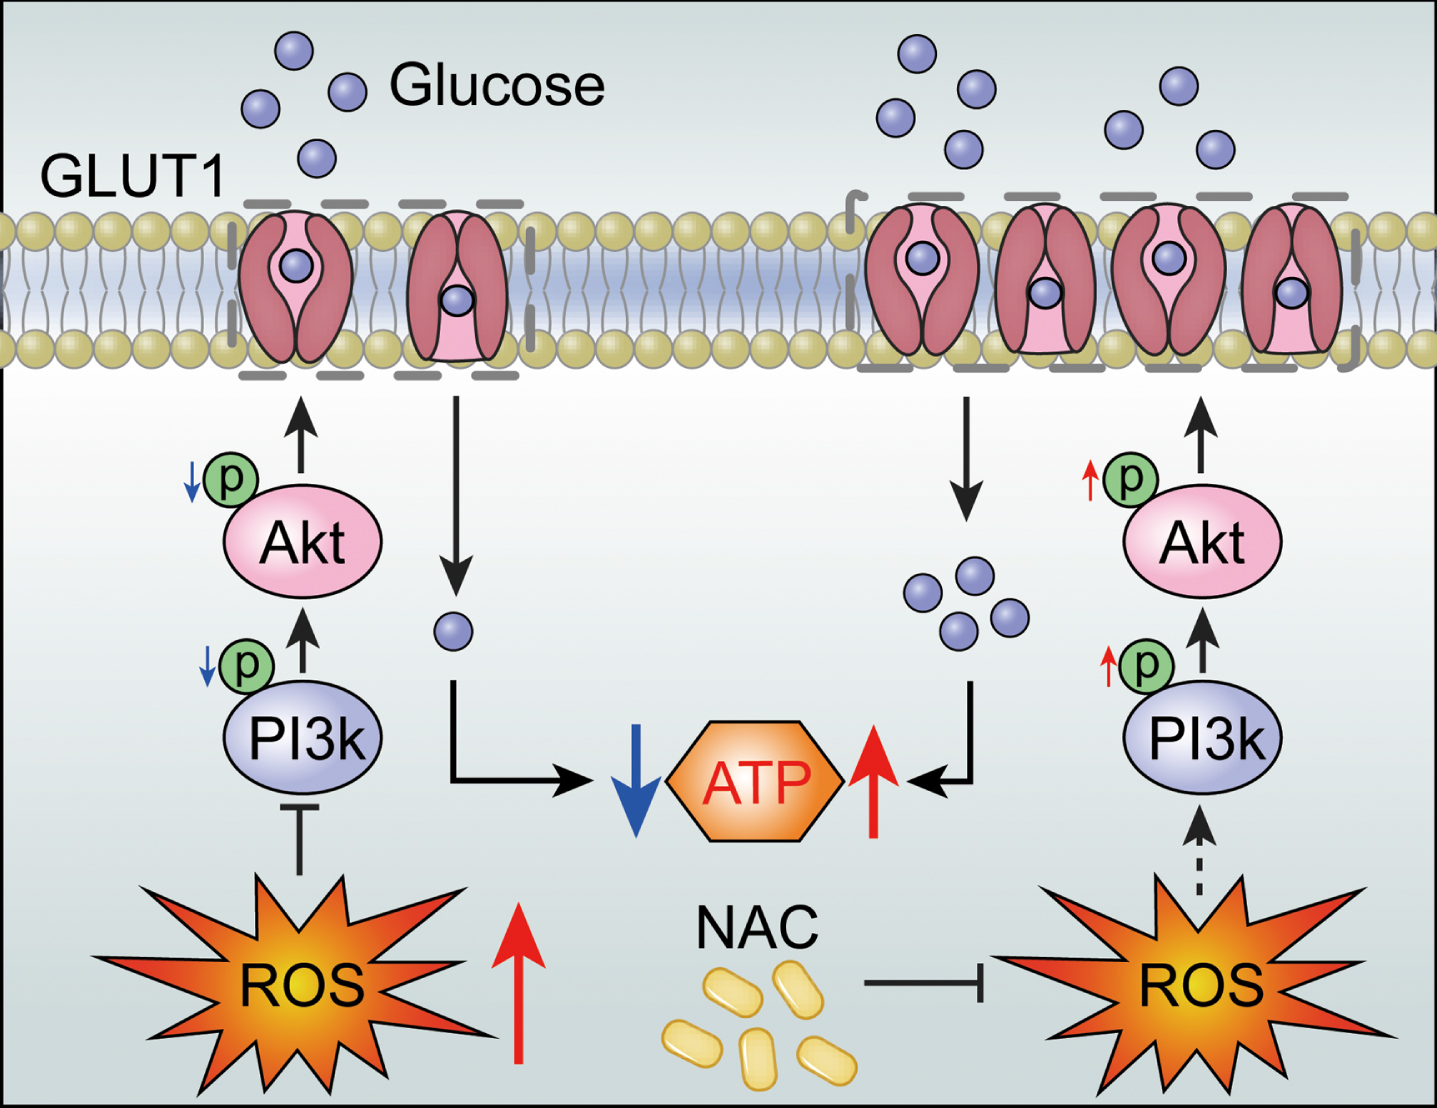
Schematic: ROS reduce PI3K/Akt pathway phosphorylation levels, leading to cellular GLUT1 deficiency and impaired glucose uptake. NAC improves this state.
The pathogenesis of AD is complex. Many mechanisms participate synergistically in the pathogenesis of AD, such as Aβ toxicity, oxidative stress, and glucose metabolism impairment [4, 27]. During AD development, the ability of the brain to utilize glucose is progressively impaired, even to the point of decreasing ATP production by 50% [28]. Glucose is the main source of energy for the nervous system, and only specific transporters can help glucose cross the phospholipid bilayer into cells [29]. Glucose uptake in the brain is mainly reliant on GLUT1 and GLUT3 and is closely related to the levels of these proteins [30–32]. Studies have reported that the accumulation of ROS, the reductions in GLUT1/GLUT3 levels, and the impairment of glucose metabolism all occur in brain regions associated with memory and cognitive function [1, 8]. A previous study found that 4-hydroxynonenal (HNE, an aldehyde product of membrane lipid peroxidation) impaired the glucose transport process; however, GLUT3 protein expression was not altered [33]. In the present study, we found that high levels of ROS, Aβ, and GLUT1 expression were significantly reduced, while GLUT3 expression was no statistical difference. We further found via NAC treatment and overexpression experiments that in vitro ROS blocked glucose metabolism by decreasing GLUT1 expression. Therefore, it is possible that GLUT1 is vulnerable to ROS attack during the shuttling and transport of glucose across the cytoplasm and cytosol and that glucose uptake and glucose metabolism are eventually impaired.
To investigate the mechanism of ROS-induced GLUT1 deficiency, we examined the levels of PI3K/Akt pathway members in N2a/APP695swe cells. Our data showed that ROS reduced GLUT1 expression by suppressing PI3K/Akt pathway activity, resulting in impaired glucose metabolism. A recent review summarizes the role of the PI3K/Akt pathway in AD, and the reviewed findings support our results [34]. The review describes findings that abnormalities of the PI3K/Akt pathway, especially a decrease in Akt phosphorylation, prevent GLUT from transporting glucose into cells and reduce ATP levels. Additional studies have also supported our results. Tahir Ali et al. investigated the antioxidant effects of anthocyanins in vivo and in vitro and found that reductions in the levels of p-PI3K/Akt/GSK3β pathway members were caused by ROS accumulation induced by Aβ oligomers [20]. ROS can affect energy metabolism via PI3K/Akt pathway members, particularly Akt, which is a critical metabolic sensor [35]. Therefore, we believe that maintaining PI3K/Akt signaling levels can help protect neuronal cells from damage related to AD risk factors.
Aβ is produced by sequential cleavage of amyloid-β protein precursor (AβPP) by β-secretase and γ-secretase [36]. ROS can activate γ-secretase to trigger Aβ production [37]. Under normal conditions, the production, degradation, and clearance of Aβ are in a dynamic equilibrium. However, various abnormalities can lead to impaired Aβ degradation or clearance; under such conditions, total Aβ production increases, while Aβ generation does not increase [38–40]. It has been suggested that Aβ deposition in the brain is mainly due to abnormal clearance. Oxidative stress can interfere with the clearance of Aβ by oxidizing low-density lipoprotein receptor-related protein 1 (LRP1), a key Aβ clearance transporter in the brain [41]. Interestingly, it has been reported that GLUT1 deficiency decreases Aβ clearance by reducing LRP1 expression in vivo, thereby accelerating Aβ deposition [13]. Here, we found that Aβ levels were negatively correlated with PI3K/Akt/GLUT1 pathway member levels and ATP levels. Thus, in the present study, the ROS scavenging-mediated reductions in Aβ levels were likely due to a certain degree of restoration of the cellular energy supply and enhancement of the clearance of Aβ. In addition, the clearance of Aβ required the PI3K/Akt/GLUT1 pathway to maintain ATP levels, and Aβ accumulation was correlated with GLUT1 levels. The specific molecular mechanisms require further investigation. Our data suggest that GLUT1 is a therapeutic target for AD that maintains neuronal glucose metabolism and promotes the clearance of Aβ.
In conclusion, the present study found that ROS reduces GLUT1 expression by inhibiting PI3K/Akt pathway activity, which results in impaired glucose metabolism in N2a/APP695swe cells. Our results suggest that the PI3K/Akt/GLUT1 pathway might act as a bridge connecting Aβ, ROS, and neurometabolic disorders in AD. In future studies, we will continue to explore the functions of GLUT1 and other GLUTs (including GLUT3) in transporting glucose and the mechanisms regulating their movement between plasma membranes.
Footnotes
ACKNOWLEDGMENTS
Thanks to all the members of our research team for the constructive discussion and suggestions that shaped this work. This work was supported by the National Natural Science Foundation of China (NSFC: 81671261), the Natural Science Foundation of Chongqing (No. cstc2017jcyjAX0050), the Performance Incentive Guidance for Scientific Research Institution of Chongqing (No. cstc2020jxjl0085) and Fundamental Research Funds for the Central Universities (No. 2019CDYGZD002).