



Abstract
Background
PTEN is a key regulator of neuronal differentiation and neurogenesis. Its role in modulating the PI3K/AKT pathway and oxidative stress responses in neuronal models remains an area of active investigation.
Objective
This study aimed to assess the effects of PTEN knockdown on neuronal differentiation, neuritic growth, and PI3K/AKT pathway activation in SH-SY5Y cells.
Methods
SH-SY5Y cells were treated with PTEN siRNA to induce PTEN knockdown. The level of PTEN inhibition was confirmed, and assays were performed to evaluate neurogenesis and neuritogenesis at 3- and 7-days post-treatment. Protein expression analysis of key components in the AKT/GSK3-β/Tau pathway was conducted to assess their role in neurogenesis. Additionally, the PI3K inhibitor LY294002 was used to examine its impact on PTEN knockdown-induced neuronal differentiation.
Results
PTEN knockdown significantly increased neurite lengths and reduced cytoplasmic size, indicating neuronal differentiation. Protein analysis showed that PTEN inhibition modulated the expression of components in the AKT/GSK3-β/Tau pathway. The PI3K inhibitor LY294002 prevented neuronal differentiation, confirming the involvement of the PI3K/AKT pathway in mediating the effects of PTEN knockdown.
Conclusions
Our findings demonstrate that PTEN plays a crucial role in regulating neuronal differentiation in SH-SY5Y cells. The PI3K/AKT pathway mediates the effects of PTEN knockdown, suggesting PTEN as a potential therapeutic target for neurodegenerative diseases where its dysregulation may contribute to disease progression.
Introduction
Alzheimer's disease (AD) is characterized by a progressive and irreversible decline in memory, primarily affecting elderly individuals over the age of 65. 1 AD is described as a continuum, progressing from preclinical to mild cognitive impairment, followed by the stages of mild, moderate, and severe dementia. 2 The histopathological features are senile plaques derived from abnormal aggregation of amyloid-β (Aβ), neurofibrillary tangles (NFTs) formed by hyperphosphorylation of tau protein, and cerebral atrophy of the hippocampus.1,3 Current primary therapies for AD are based on acetylcholinesterase inhibitors, which confer only symptomatic improvements to patients. 4 Despite the intensive search for new efficient therapies for AD, there are still no drugs capable of blocking the neurodegeneration process.
A strategy recently pursued for AD treatment is the activation of innate neurogenesis in the hippocampus, which involves a neuroprotective mechanism. Unlike previous thoughts, there is evidence that the hippocampus harbors self-renewing and multipotent adult neural stem cells (NSCs).5–7 In patients with AD, the hippocampus area is one of the most affected by the degeneration process. Neurogenesis in the adult hippocampus was found to be impaired at an early stage of the disease, and the maturation of neurons decreases throughout the disease progression. 8
In the context of AD, the role of PTEN (phosphatase and tensin homolog deleted on chromosome 10) emerges as a pivotal factor. Studies have consistently reported a gradual increase in synaptic PTEN and a significant reduction in synaptic density in the brains of individuals with AD. 9 Remarkably, PTEN redistributes within damaged neurons, translocating from the nucleus and cytoplasm to NFTs and other pathological structures within the AD hippocampus, such as neurite filaments and dystrophic neurites within senile plaques. 10 These observations underscore the critical importance of PTEN in the neurodegenerative process associated with AD.
Turning our attention to molecular mechanisms, the phosphatidylinositol-3-kinase (PI3K)/protein kinase B (AKT) pathway stands out as one of the most extensively studied signaling cascade in various AD models. Its exploration aims to unravel its role in regulating neuronal survival and maintaining synaptic plasticity in the brain.11,12 The PI3K/AKT pathway plays a crucial role in promoting cell survival through increased phosphorylation of downstream substrates, including glycogen synthase kinase 3 (GSK3-β), Bcl2 antagonist of cell death (Bad), caspase-9, nuclear factor κB (NF-κB), mammalian target of rapamycin (mTOR), among others.13–16 These molecules have been closely implicated in AD development, with GSK3-β, for instance, being highly activated in AD and contributing to abnormal hyperphosphorylation of tau. 17
An essential feature of this intricate molecular network is the negative regulation of the PI3K/AKT pathway by PTEN. Functioning as a direct antagonist to this pathway, the inhibition of PTEN activates PI3K/AKT, leading to a reduction of apoptosis and interference with proteins linked to antioxidant responses and autophagy. 18 Furthermore, PTEN inhibition not only fosters cell proliferation and neuronal differentiation, 19 but also facilitates axon regeneration,20,21 and neurite outgrowth. 22 In summary, the research focus on the role of PTEN in AD is motivated by its critical functional significance. PTEN is not only a prominent factor observed in the progression of the disease, but it also serves as a crucial regulator that influences the PI3K/AKT signaling pathway. This dual role underscores the importance of investigating PTEN as a promising target for therapeutic exploration in the context of AD.
The present study seeks to evaluate the impact of PTEN inhibition on the promotion of neuroprotection and neurogenesis and investigate the involvement of AKT signaling pathway in these processes, using a neural human model (SH-SY5Y cell line) and the strategy of PTEN inhibition by siRNA. We demonstrated that a reduced PTEN expression can promote neurogenesis and neuritogenesis in SH-SY5Y cells by modulating the AKT signaling pathway, as proved by using a PI3K inhibitor (LY294002), since it prevented neuronal differentiation induced by PTEN siRNA. The insights gained from our study provide valuable information for the development of promising molecular therapeutic targets aimed at addressing neurodegenerative diseases in patients.
Methods
Cell lines and treatment conditions
The human neuroblastoma cells (SH-SY5Y) used were obtained from the Rio de Janeiro Cell Bank (CBRJ, Rio de Janeiro, SP, Brazil) and cultivated in culture flasks (25 cm2) with DMEM + HAM F10 (Sigma-Aldrich, St Louis, MO, USA) supplemented with 10% fetal bovine serum (FBS; Gibco, Grand Island, New York, USA), 1% penicillin solution (100 units/ml) and 1% streptomycin (10 mg/ml) (Sigma-Aldrich) and incubated at 37°C and 5% CO2. To perform PTEN gene inhibition, the siRNA was purchased from Sigma (NM_000314); their sequences (sense strand) were as follows: PTEN, 5′-GUUAAAGAAUCAUCUGGAU-3′ (SASI_Hs01_00196479/PTEN) and PTEN, 5′-AUCCAGAUGAUUCUUUAAC-3′ (SASI_Hs01_00196479_AS/PTEN). Furthermore, a Universal Negative Control #1 siRNA (MISSION® siRNA SIC001-Sigma) was used. According to the manufacturer's protocol, the oligomer was transfected into the cells using lipofectamine™ 2000 (Invitrogen, Waltham, MA, USA – 11668019).
Neuronal differentiation
For the neuronal differentiation protocol of the SH-SY5Y cell line, the cells were cultivated in 6, 12, or 24-well plates in a complete culture medium containing 10% FBS. After 24 h for cell adhesion, treatment with PTEN-siRNA (30 and 70 nM) was performed, which remained in contact with the cells for 5 h using lipofectamine™ 2000. Then, the treatment was removed, and a medium containing 1% FBS was added. The medium was replaced every 2 days, and after 7 days of cell treatment, cells were collected and analyzed (Figure 1). As a positive control for inducing neuronal differentiation in SH-SY5Y cells, we employed 10 μM retinoic acid (RA) obtained from Cayman Chemical Company (Ann Arbor, MI, USA – Catalog No: 11017). The RA was diluted in Dimethyl sulfoxide – DMSO (Sigma-Aldrich, Catalog No: D8418), starting from a stock concentration of 10 mM. To conduct the PI3K inhibition assay, we treated the cells with LY294002 (Life Technologies, Carlsbad, CA, USA – Catalog No: PHZ1144) at a specific concentration of 20 nM, which was achieved by initially preparing a stock solution of 10 mM diluted in DMSO, and subsequently in PBS to reach a working concentration of 10 µM.
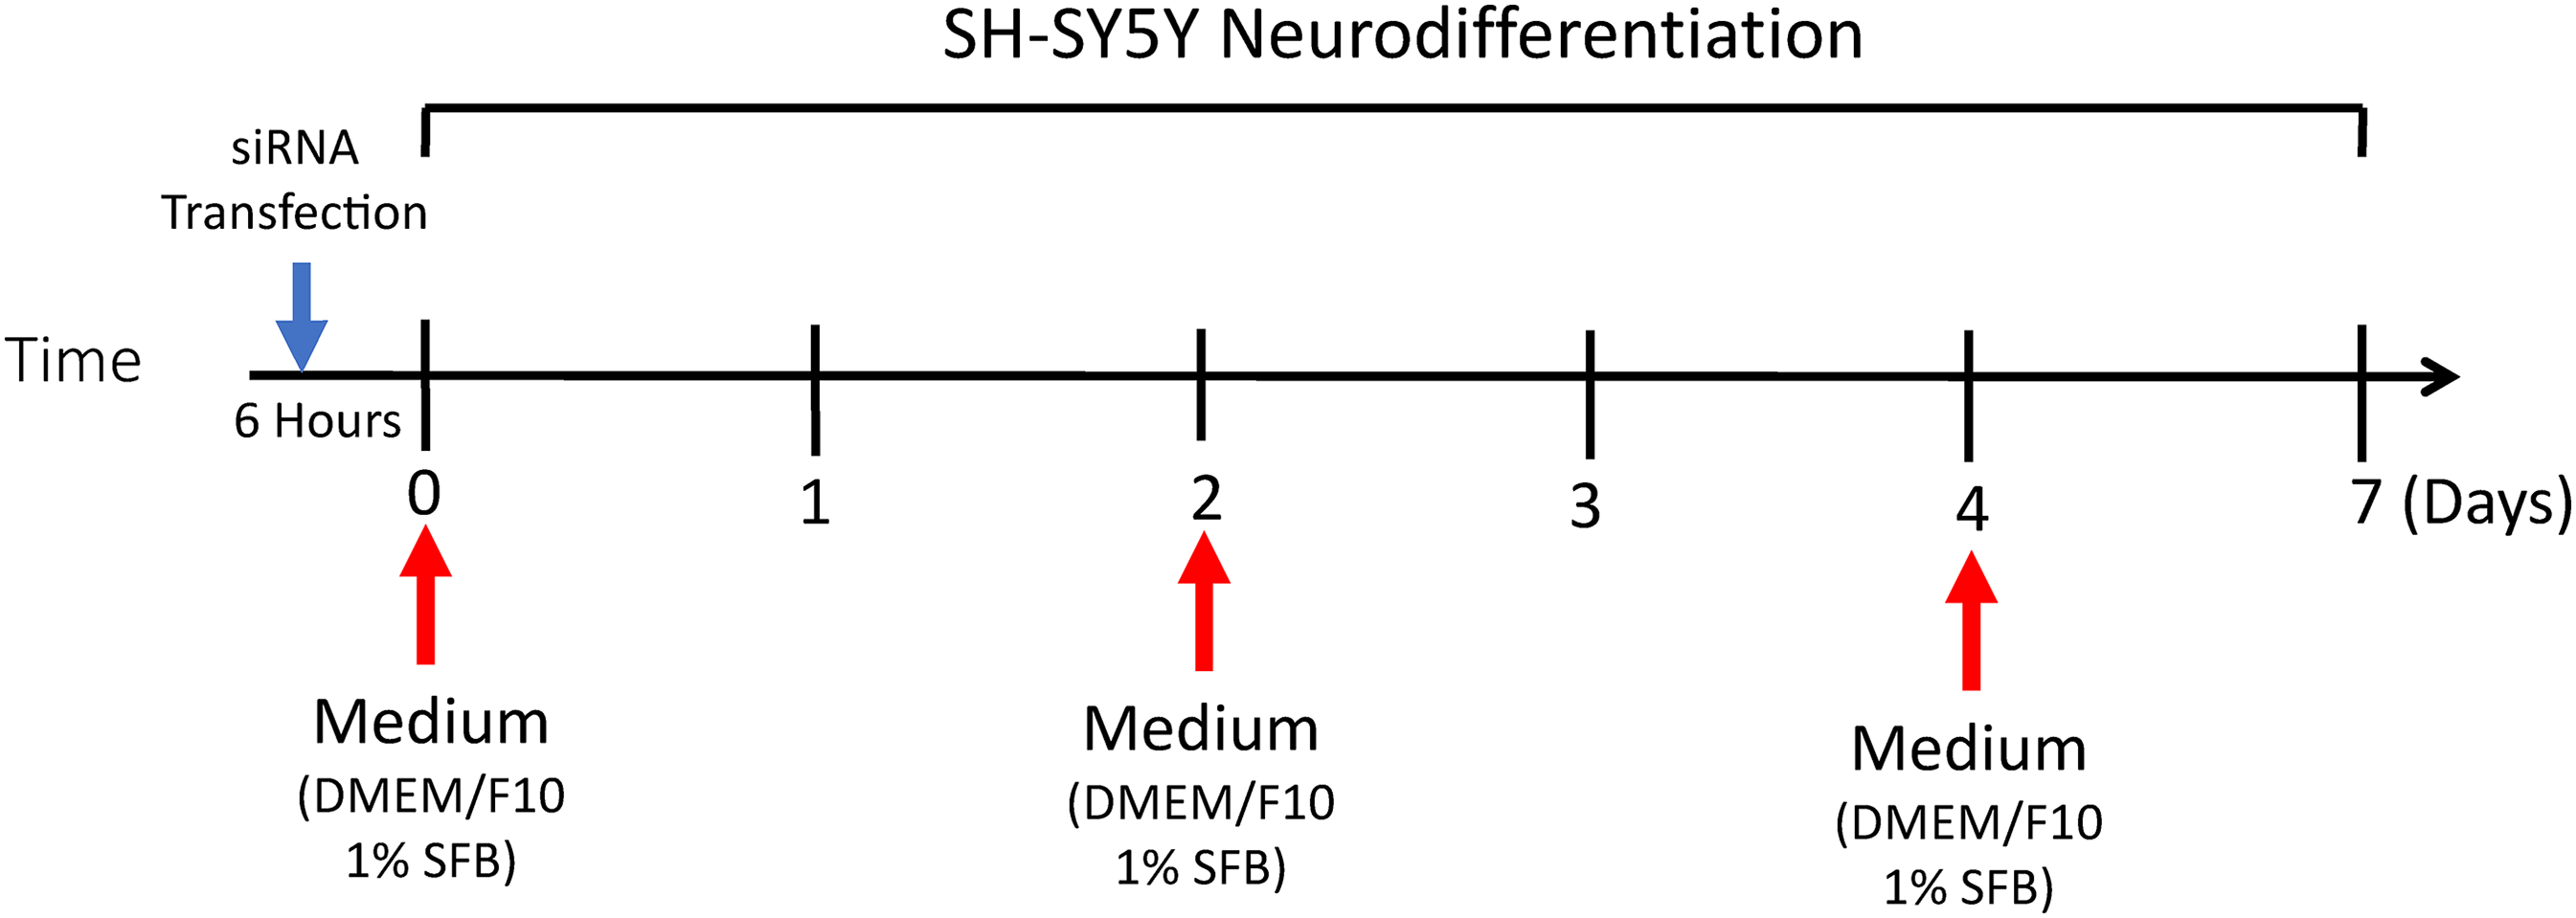
Neuronal differentiation protocol after PTEN inhibition.
Immunofluorescence assay
Briefly, the cells were washed with PBS, then with absolute methanol fixation for 10 min. Later the cells were washed with PBS and then permeabilized for 15 min with Triton X- 100 (Sigma-Aldrich) diluted to a concentration of 0.2% in PBS. The cells were blocked for 60 min in a solution of bovine serum albumin (BSA – Sigma-Aldrich) diluted at 2% in PBS at cold room (4°C). Then, the solution containing the primary antibodies was added: anti-PTEN Rabbit (1:1000 Cell Signaling Technologies, Danvers, MA, USA – #9556), anti-β-III-tubulin Rabbit (1:1000 Abcam, Cambridge, UK – ab18207) for 18 h at 4°C and subsequently washed three times with Tween20 (Sigma-Aldrich) solution diluted to 0.1% in PBS. Then, Alexa Fluor® 488 anti-rabbit secondary antibody (Invitrogen – A11008) solution or Alexa Fluor® 593 anti-mouse secondary antibody solution (Invitrogen – A21201) diluted 1:200 was added for 60 min at room temperature in the dark washed twice with a solution of Tween20 diluted to 0.1% in PBS. The cells were stained with Hoechst 33342 (0.15 µg/mL – Sigma-Aldrich), and then the coverslips were placed on a glass slide and analyzed under a fluorescence microscope (Zeiss).
Protein expression
After PTEN inhibition by siRNA, the cells were subjected to the lysis process for protein extraction using the RIPA Lysis and Extraction Buffer (Thermo Fisher Scientific, Inc., Catalog No: 89900, Waltham, MA, USA) with 1% protease inhibitors HaltTM Protease Inhibitor Cocktail Kit (Thermo Fisher Scientific, Inc. Catalog No: 78429). Then, the quantification of total proteins was performed using the BCA kit (Thermo Fisher Scientific, Inc. Catalog No: PI23227), which was stored at −80°C. Protein expression analysis was performed by Western blot technique using the WesternBreeze™ Chemiluminescent Kit (Thermo Fisher Scientific, Inc. Catalog No: WB7106) following the manufacturer's protocol. The antibodies used were: anti-AKT rabbit (1:1000 dilution; Cell Signaling Technologies – #9272), anti-phosphor-AKT rabbit (Ser473) (1:1000 dilution; Cell Signaling Technologies – #9271), anti-PTEN mouse (1:1000 dilution; Cell Signaling Technologies – #9556), anti-GSK3-β rabbit (1:1000 dilution; Cell Signaling Technologies – #12456), anti-phospho-GSK3-β (Ser9) rabbit (1:1000 dilution; Cell Signaling Technologies – #9322); anti-phospho-Tau (Thr205) rabbit (1:1000 dilution; Cell Signaling Technologies – #49561), anti- β-III-tubulin rabbit (1:1000 dilution; Abcam ab18207), in addition to the endogenous anti- β-Actin rabbit (1:1000 dilution; Cell Signaling Technologies – #4967), or anti-β-tubulin rabbit (1:1000 dilution; Cell Signaling Technologies – #2146), used as a control for normalization. For protein visualization, membranes were scanned using an ImageQuant LAS 500 photodocumenter (GE Healthcare Life Sciences), and bands were quantified using the Image Studio Lite Ver 5.0 (Lite Software). All data were normalized according to the levels of protein expression obtained for the control.
Morphological analysis of SH-SY5Y cells differentiated into neurons
For the morphological analysis of SH-SY5Y cells, 20 photos were initially taken in random fields in a 20x objective for each experimental point in triplicate using an inverted phase microscope (EVOS XL Core Imaging System, Thermo Fisher Scientific, Inc.). The neurites’ length, the cells’ diameter, and the percentage of neuronal differentiation were analyzed. For the length of the neurites, ImageJ software (FIJI) was used, plugin Simple neurite Tracer, where at least 100 cells per sample were quantified in experimental triplicate, with only one neurite per cell being quantified. Furthermore, the diameter of the same 100 analyzed cells was measured. Cells with at least one neurite larger than the cell diameter were considered differentiated for the neurodifferentiation percentage.
Analysis of cell cycle kinetics
The cell cycle kinetics were analyzed after 1, 3, and 7 days of treatment with PTEN siRNA. After the treatments, the culture medium containing the Sub-G1 fraction was collected, and the cells were trypsinized. After centrifugation and washing with a phosphate buffer, the cells were fixed in ice-cold 70% ethanol and stored at −20°C for at least 18 h. For reading, the samples were resuspended in 200 µL of a solution containing propidium iodide solution (5 µg/mL; Sigma-Aldrich P4170), ribonuclease A (50 µg/mL; Sigma-Aldrich R-4875), and triton-100 (0.2%; Synth T2502.08.BJ), incubated for 30 min at room temperature, and analyzed in a CytoSoft 4.2.1 Software Environment flow cytometer (Guava Technologies), with at least 5000 events for each sample. Values were expressed as the percentage of cells distributed in each cell cycle phase and Sub-G1 fraction.
Cell proliferation assay
The analysis of the cell proliferation curve by flow cytometry was performed using the Guava ViaCount Kit (Merck Millipore, Burlington, MA, USA) according to the manufacturer's protocol. The cells were analyzed on days 0, 2, 4, and 7. Cell proliferation was determined by calculating the cell division index, where the number of cells harvested is divided by the number of cells seeded on day 0. The samples were analyzed using the Guava EasyCyte Mini System flow cytometer (Merck Millipore) and the Guava CytoSoft 4.2.1 Software (Guava Technologies), counting 1000 events for each sample.
ROS analysis
The production of intracellular ROS was analyzed after 1, 3, and 7 days of treatment with PTEN siRNA, using the dihydroethidium (DHE- Thermo Fisher Scientific, Inc.; D11347) and mitochondrial ROS by the MitoSOX ™ Red reagent (Thermo Fisher Scientific, Inc.; M36008). The assays were performed according to the manufacturer's protocol. After PTEN inhibition, the cells were incubated with the probes DHE (1.5 µM) and MitoSox Red (1.5 µM) for 30 min and analyzed in a Guava EasyCyte Mini System flow cytometer (Merck Millipore) in the Guava CytoSoft 4.2.1 Software (Guava Technologies), counting 5000 events for each sample. The carbonylcyanide-3-chlorophenylhydrazone (CCCP – Thermo Fisher Scientific, Inc.) was used as a positive control of intracellular ROS in 100 µM for 30 min. For mitochondrial ROS, the hydrogen peroxide (H2O2 − Sigma-Aldrich) was used as a positive control in 100 µM for 30 min.
Analysis of mitochondrial mass
The MitoTracker Green reagent (Thermo Fisher Scientific, Inc. – M7514) was used according to the manufacturer's protocol for mitochondrial mass analysis. Thus, after 7 days of treatment, the cells were incubated with MitoTracker Green at a concentration of 50 nM for 30 min and then analyzed using a Guava EasyCyte Mini System flow cytometer (Merck Millipore) and later using the Guava CytoSoft 4.2.1 Software (Guava Technologies), counting 5000 events for each sample.
Statistical analysis
Statistical analysis was performed using One-way ANOVA or Two-way ANOVA with Tukey post-test. For each assay, results were obtained from at least three independent experiments and expressed as the mean ± SEM. GraphPad Prism, v. 5.0 software was used for statistical analysis and graph construction. p < 0.05 was considered the threshold for a statistically significant difference between results.
Results
PTEN inhibition by siRNA
PTEN inhibition was performed in SH-SY5Y cells using the siRNA method. The transfection efficiency of PTEN siRNA (30 nM and 70 nM) was evaluated by an immunofluorescence assay, which was performed for cells analyzed after 24 h of PTEN inhibition. PTEN protein expression analyzed on days 1, 3, and 7 showed a reduction of the red fluorescence signal for both treatments (30 and 70 nM) (Figure 2(A)). On day 1, it was observed a minor reduction (approximately 15%) of PTEN protein expression by siRNA 30 nM. The highest concentration of PTEN siRNA (70 nM) reduced PTEN expression by approximately 50% (p < 0.001). On the 3rd day, there was a significant (p < 0.05) reduction (approximately 40%) for the lowest siRNA concentration, while the highest concentration significantly reduced PTEN expression by 70% (p < 0.001). At the end of 7 days, the lowest concentration (30 nM) kept affecting PTEN, reaching 50% inhibition (p < 0.01), while at the highest concentration (70 nM), the expression level was found to increase by 150% (p < 0.001) when compared to the negative control. The control siRNA did not affect PTEN expression (Figure 2(B) and (C)). The inhibitory efficiency of PTEN was dose-dependent at the concentrations of 30 and 70 nM.
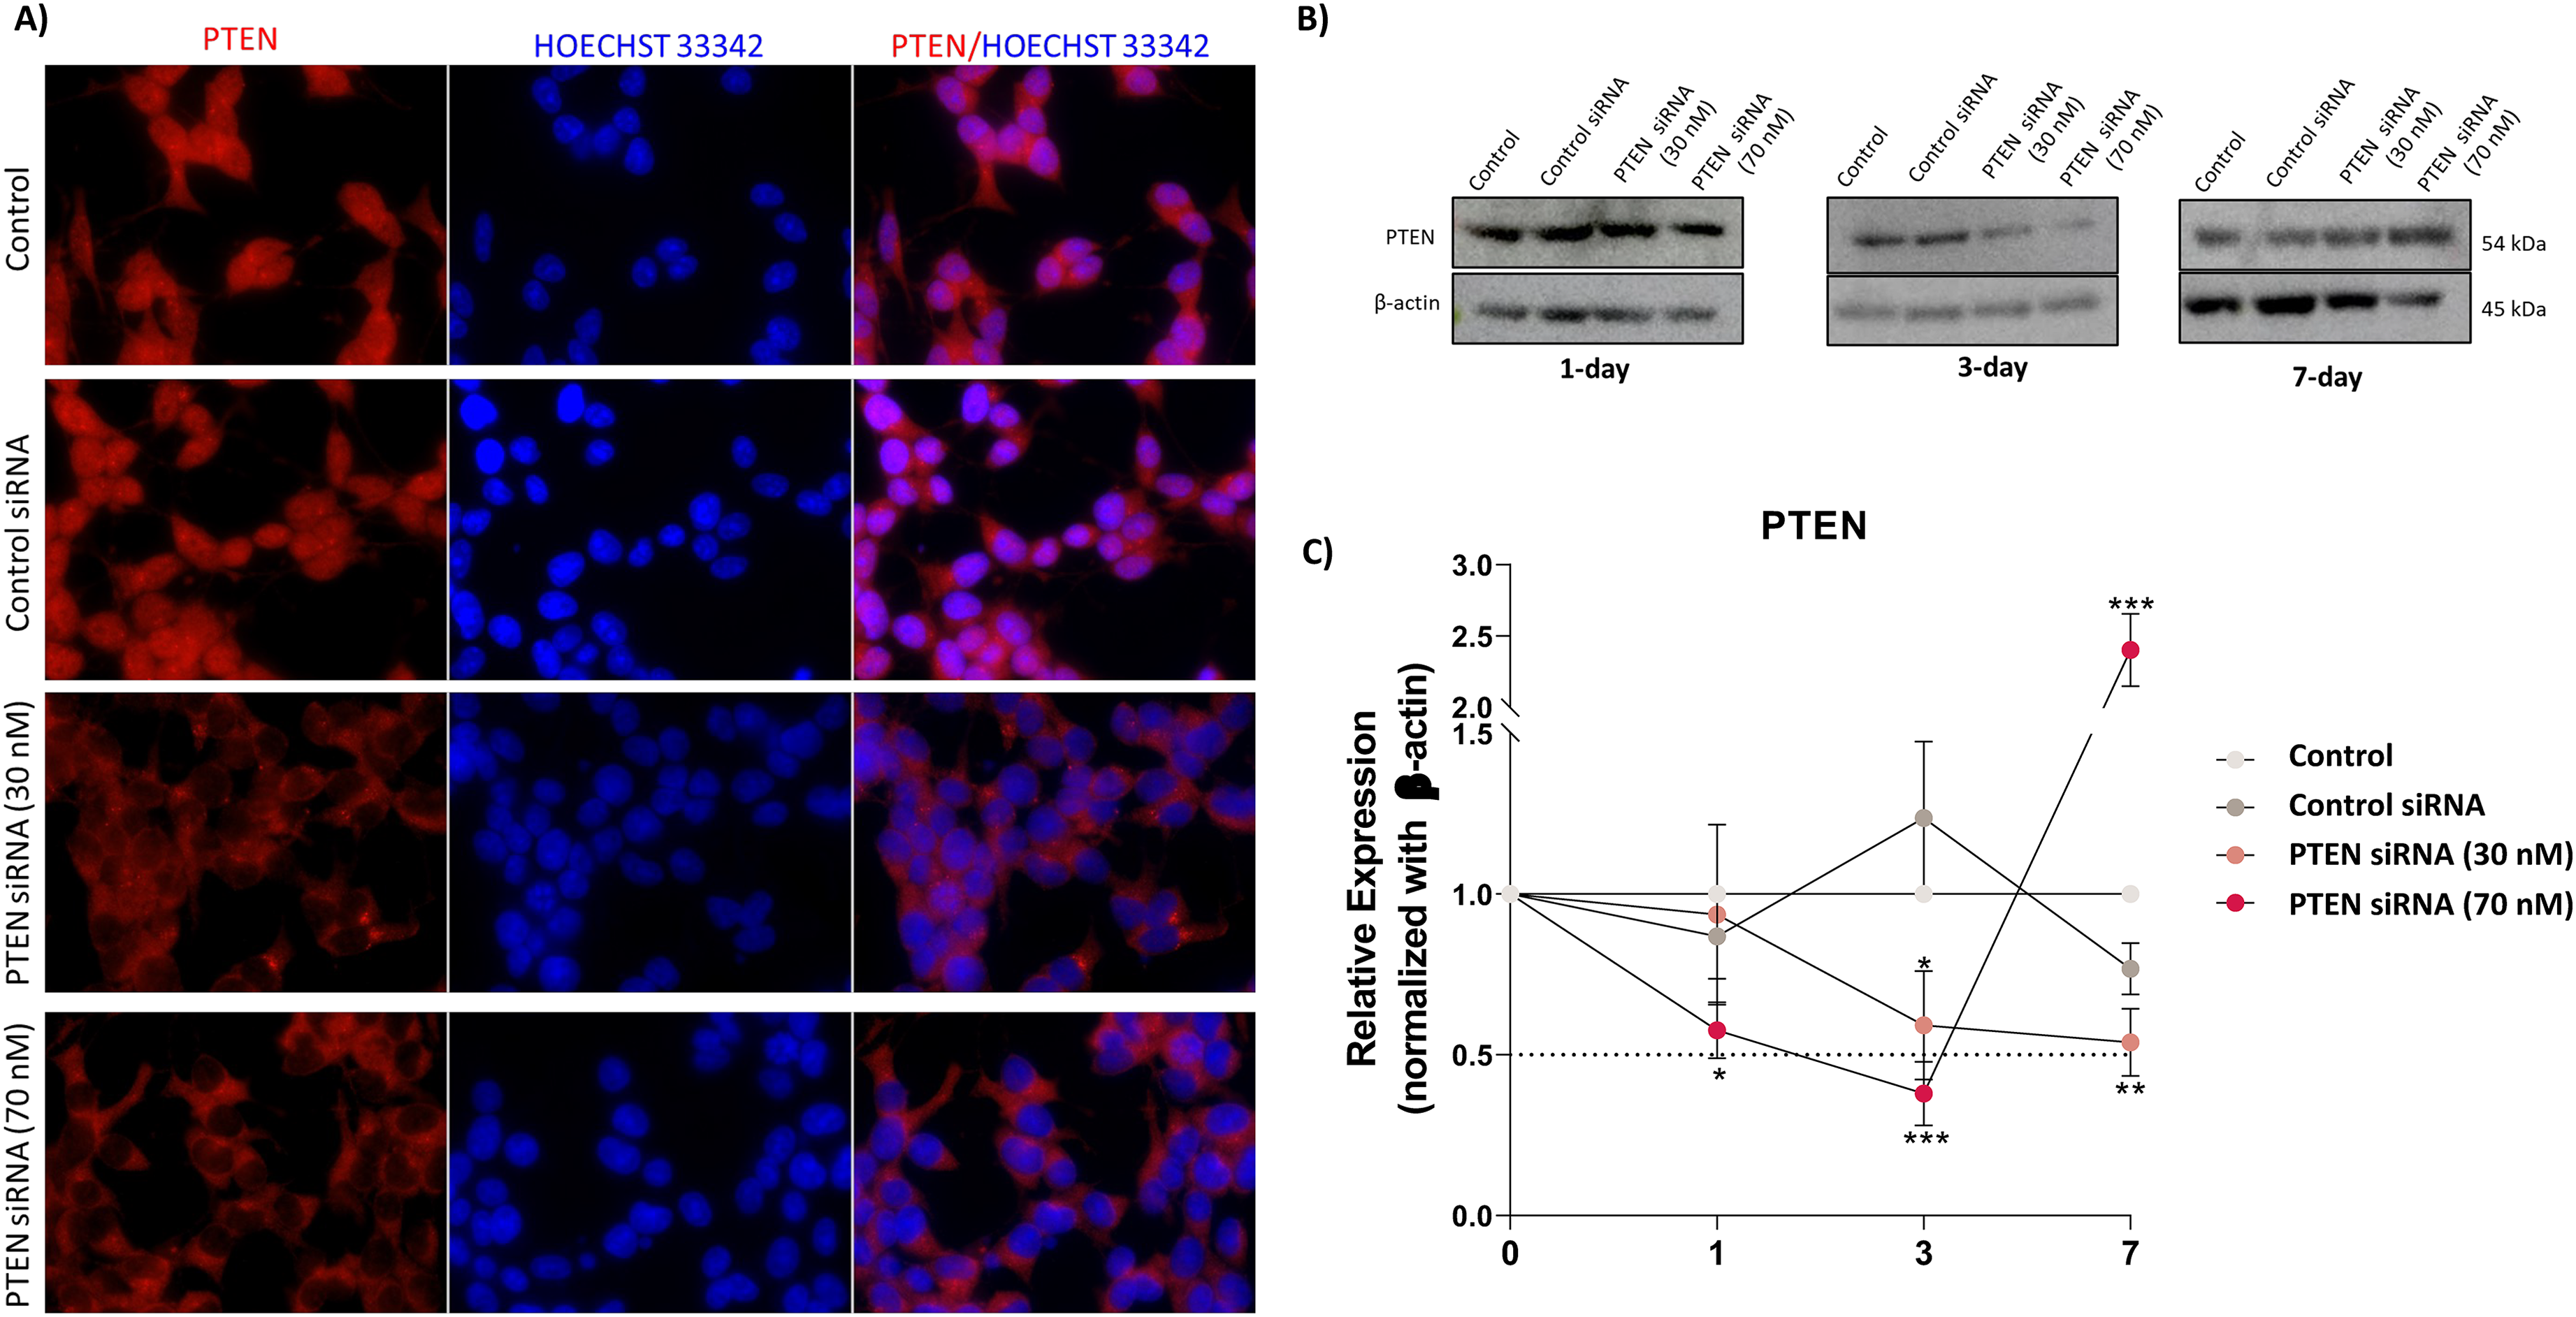
Analysis of PTEN inhibition by siRNA in SH-SY5Y cells. (A) Immunofluorescence of SH-SY5Y cells after 24h of PTEN inhibition by siRNA (30 and 70 nM), showing labeling with anti-PTEN (1:500) and Hoechst 33342 staining (0.15 μg/mL). (B) PTEN (55 kDa) and β-actin (45 kDa) expression after 1-, 3-, and 7-day of PTEN inhibition. (C) PTEN expression levels in siRNA-treated cells. Values were normalized with endogenous β-actin (45 kDa) protein using the Image Studio Lite Ver 5.0 software (Lite Software). The results of expression levels were normalized according to the control values. Statistical analysis was performed by One-way ANOVA with Tukey post-test. Values are expressed as mean ± SEM (N=3). *** p <0.001; ** p <0.01; indicates significant differences when results were compared to the control. Control: DMEM/F10 medium 1% FBS.
PTEN inhibition induces neuronal differentiation and neuritogenesis
Morphological characterization of the neuronal differentiation was performed after 3 and 7 days following PTEN inhibition at 30 and 70 nM siRNA in SH-SY5Y cells. Retinoic acid (RA, 10 µM) was used as a positive control for neuronal differentiation. In both siRNA concentrations, morphological changes were observed, such as neurite formation and reduction of cytoplasm mass, which remained after 3 and 7 days of differentiation, similarly to those observed for RA (Figure 3). These observations suggest that PTEN inhibition may induce neuron differentiation in SH-SY5Y cells.
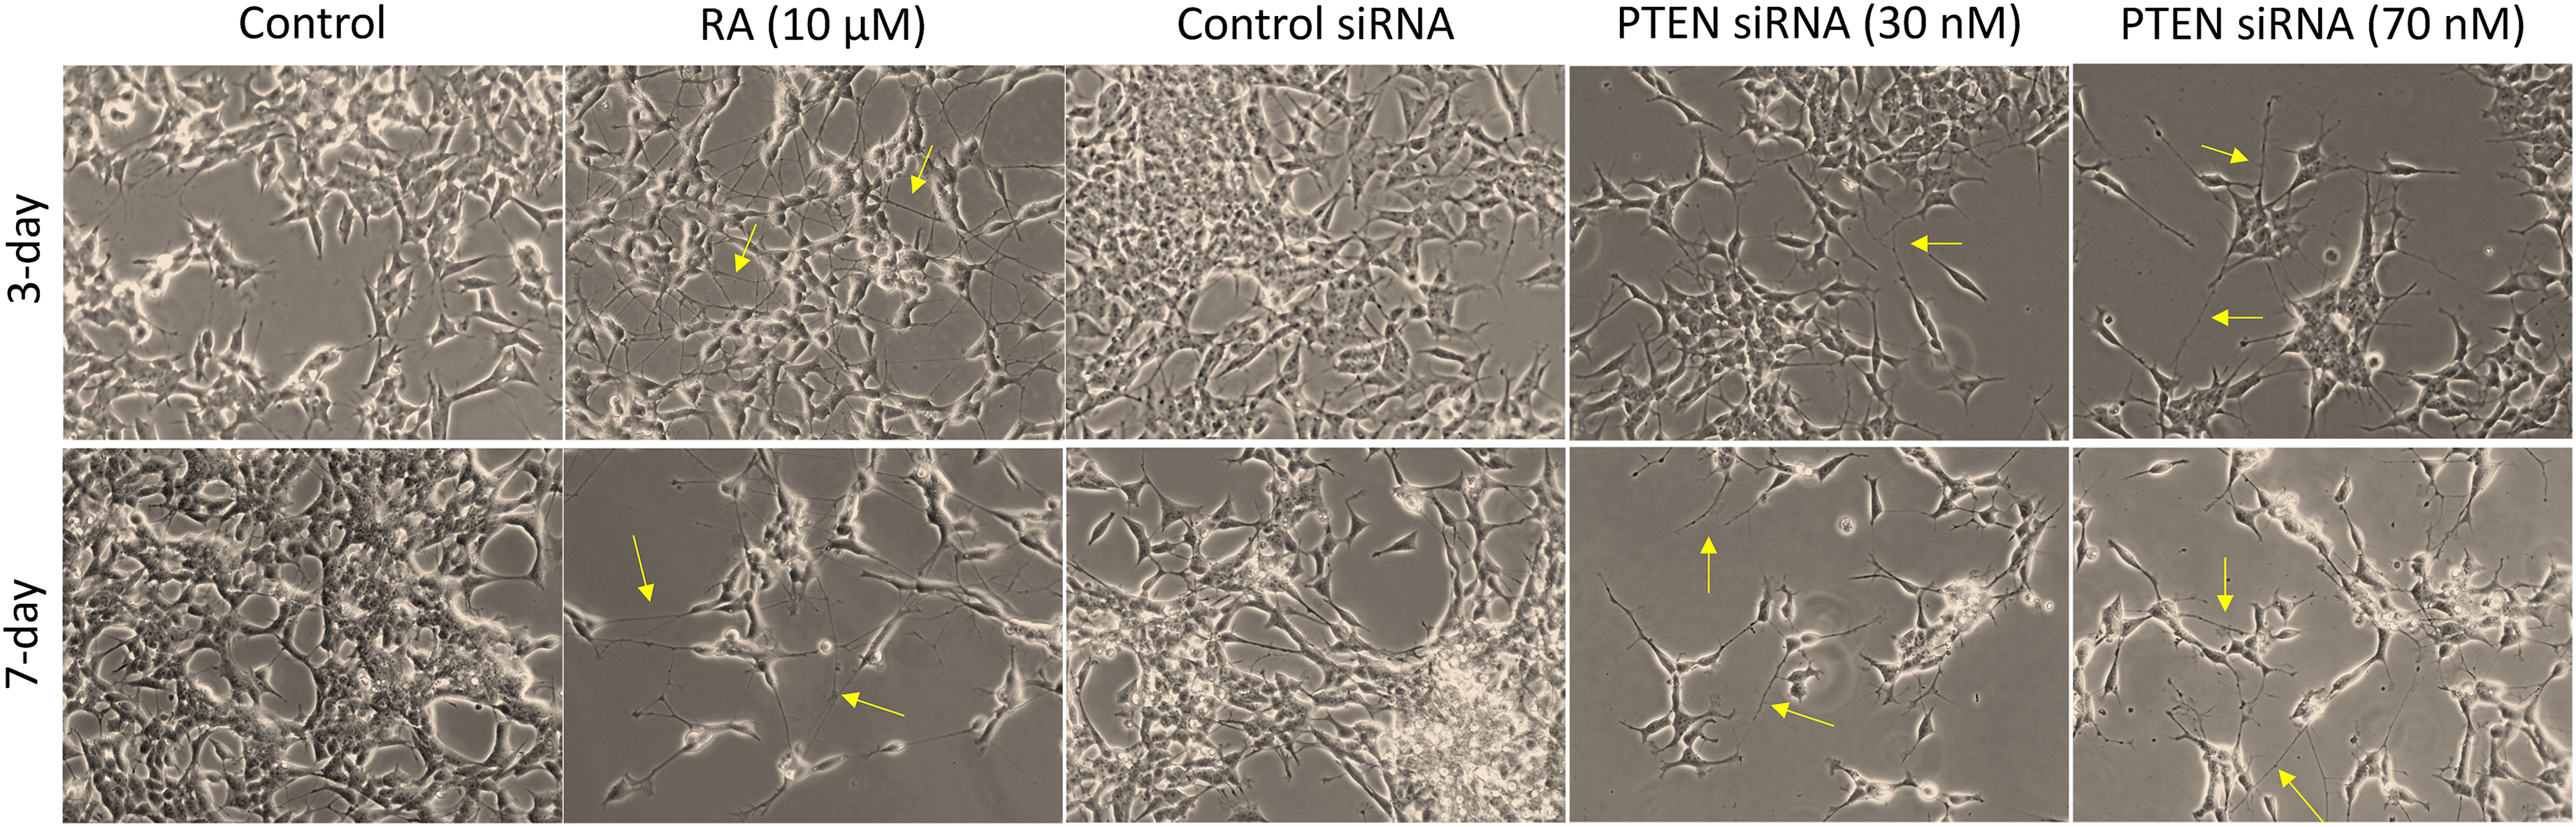
SH-SY5Y cells analyzed after 3 and 7 days of treatment with PTEN siRNA. Morphological changes and neurodifferentiation can be observed under 20x magnification using an inverted microscope (EVOS XL Core Imaging System, Thermo Fisher Scientific, Inc.). Control: DMEM/F10 medium 1% FBS. Arrows indicate neurite formation.
For the evaluation of neurite growth, as expected, both siRNA concentrations led to a significant increase in neurite size on 3-day of inhibition, remaining until the 7th day. At the 3-day, a significant increase in neurite size (68.58 µm, p < 0.001) was observed for the RA differentiated cells compared to the negative control (27.44 µm). When assessed whether PTEN inhibition induced an increase in neurite growth, it was observed that both PTEN siRNA treatments induced a significant (p < 0.001) increase in neurite size when compared to the siRNA control (42.39 µm), with an average size of 59.38 µm (30 nM siRNA) and 60.93 µm (70 nM siRNA) and when compared to the negative control. For the control siRNA, we also found a significant increase (p < 0.001) in neurite size (42.39 µm), which is expected because of the stress caused by the siRNA procedure in this cell model (Figure 4(A)).
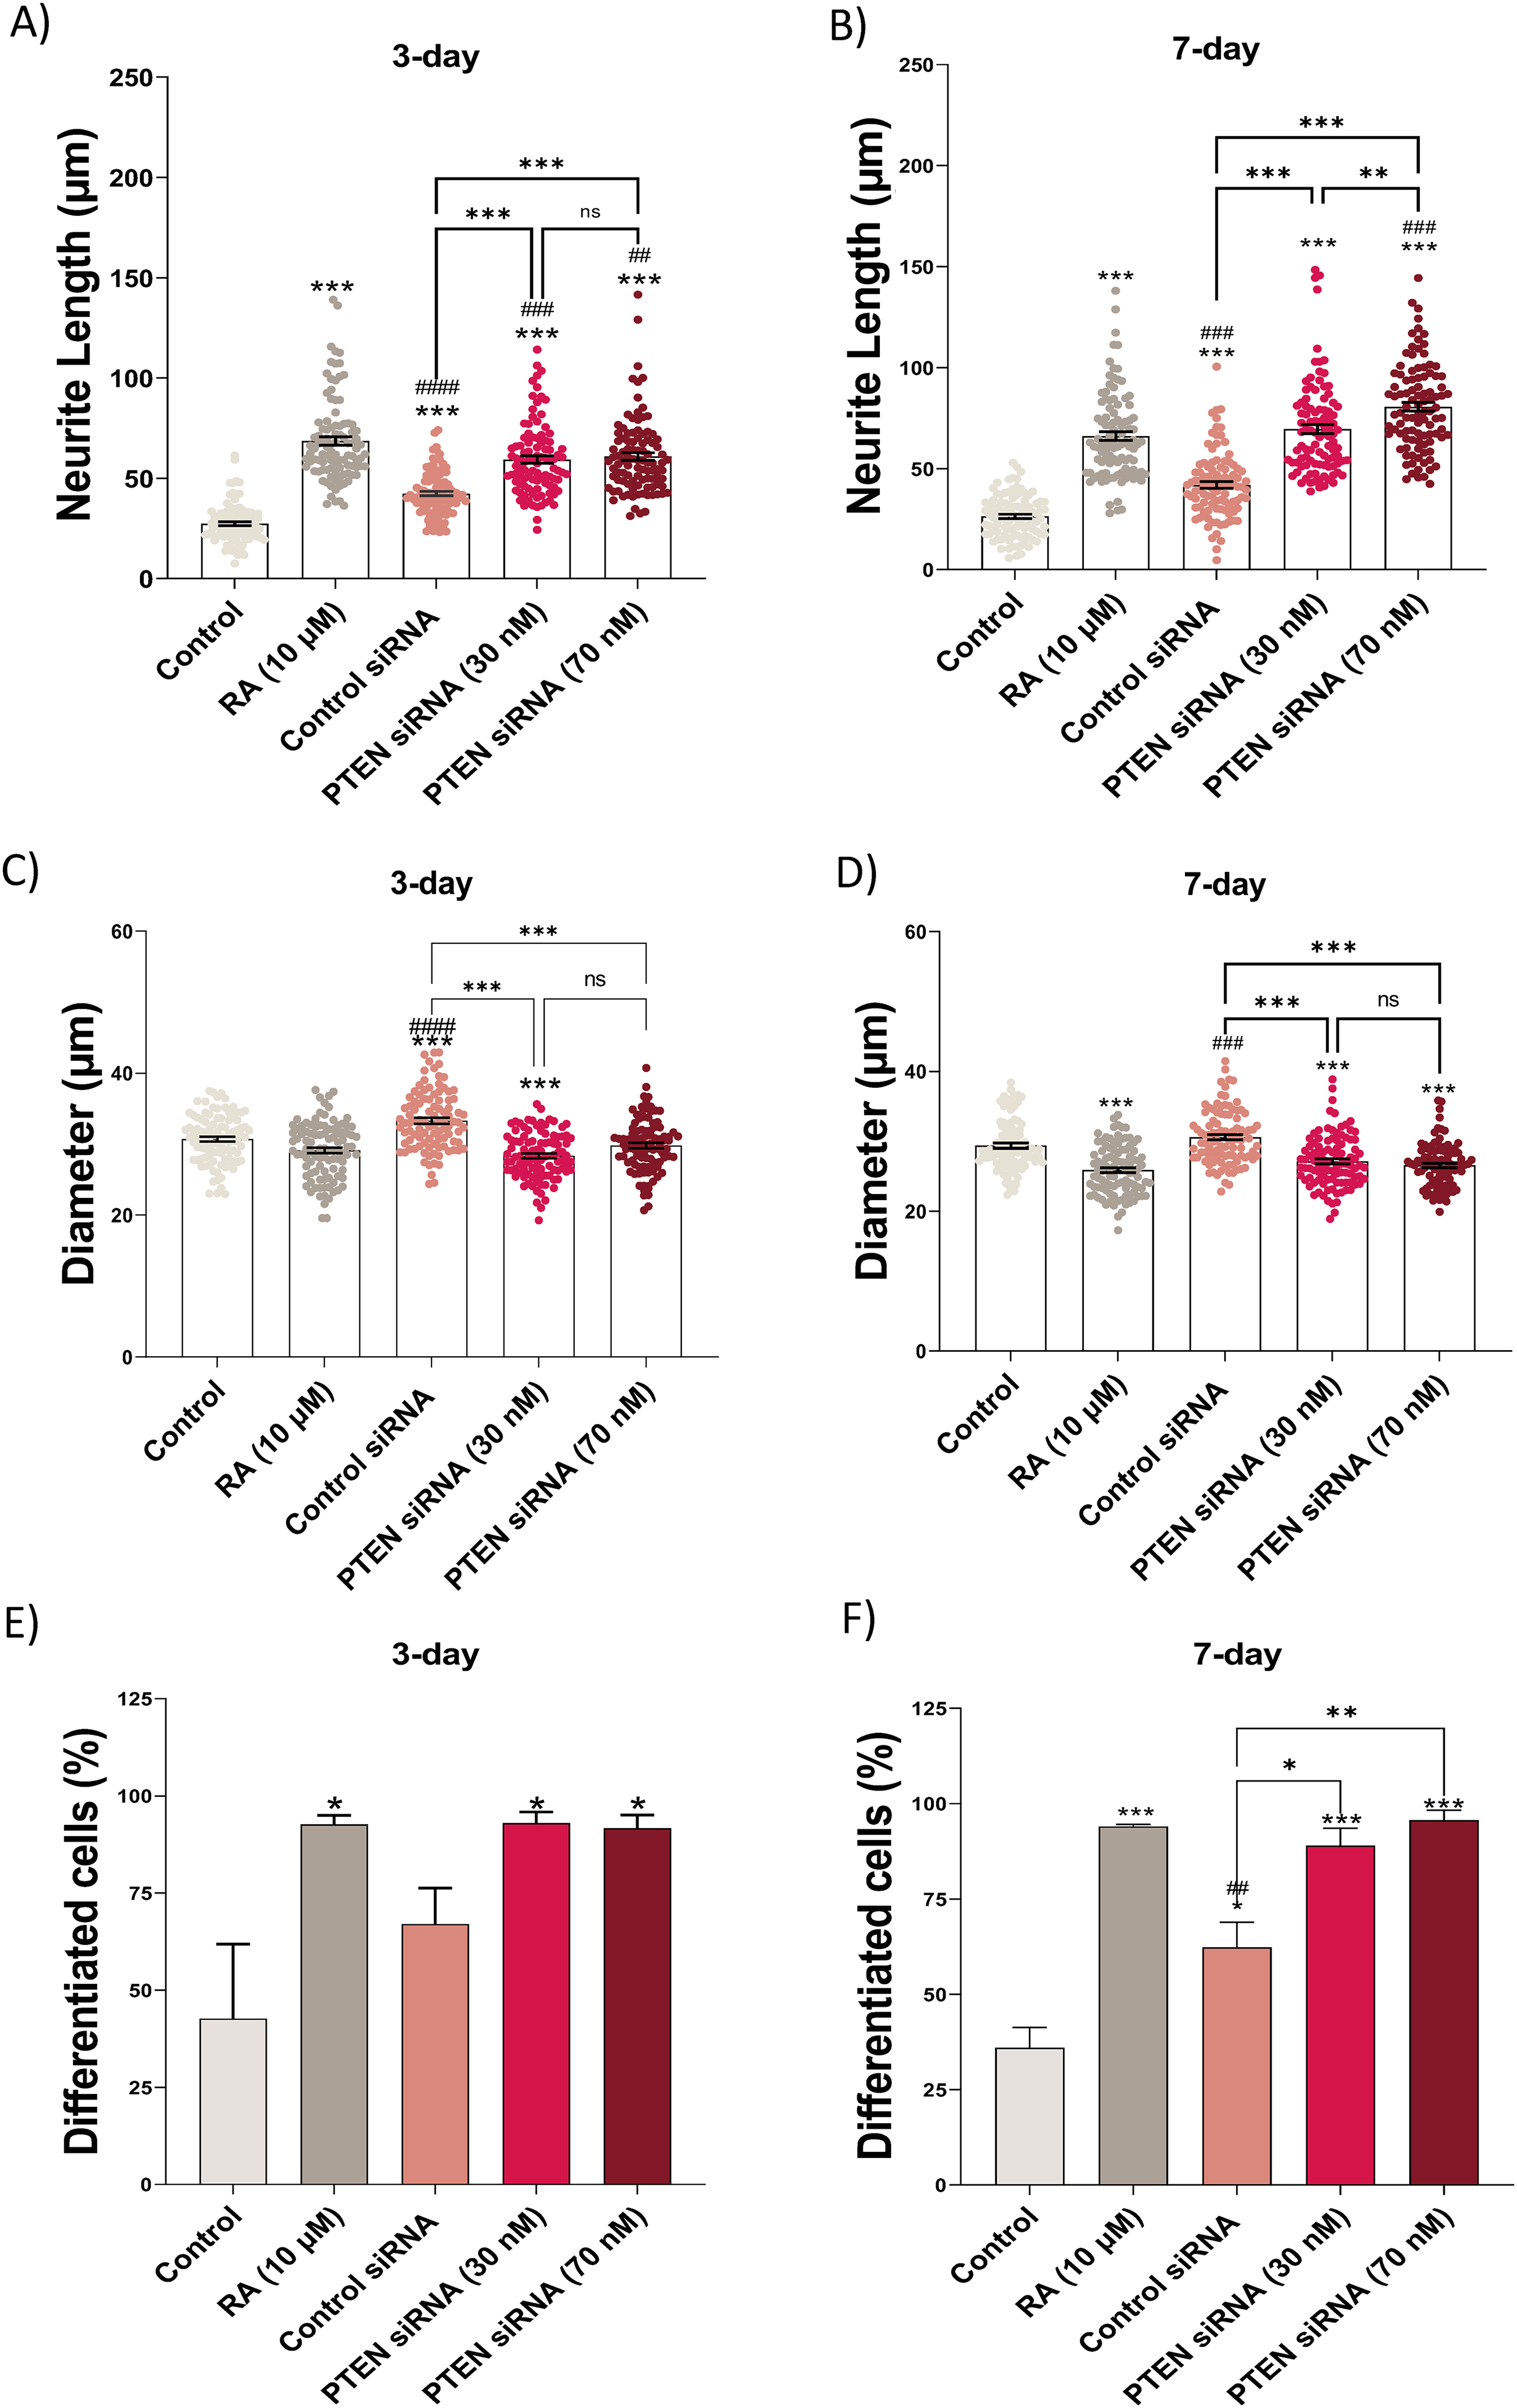
Induction of neurodifferentiation after PTEN gene inhibition. The average length of neurites was evaluated after 3 (A) and 7 days (B), as well as analysis of cell diameter after 3 (C) and 7 days (D) of differentiation. ImageJ (FIJI) software was used, and 100 cells were randomly analyzed. The percentage of neuron-differentiated cells was also evaluated at 3 (E) and 7 days (F). Only those with at least one neurite with a length larger than the diameter of the cell body were considered as differentiated neurons. Statistical analysis was performed by One-way ANOVA with Tukey post-test. Values were expressed as mean ± SEM (N=3). *** p <0.001; ** p <0.01; * p <0.05 indicates significant differences when results were compared to the control. ### p <0.001; ## p <0.01 indicates significant differences when results were compared to the RA group. ns: non-significant. Control: DMEM/F10 medium 1% FBS.
For the analyses performed on the 7-day of differentiation, RA promoted a significant increase (p < 0.001) in neurite size, with an average of 66.52 µm when compared to the control (26.36 µm). The siRNA control held up with a mean of 42.29 µm (p < 0.001). The treatments with PTEN siRNA (30 and 70 nM) led to measurements of 69.64 µm and 80.64 µm, respectively, with a significant increase compared to the control (p < 0.001) and the siRNA control (p < 0.001). Interestingly, the highest (70 nM) PTEN siRNA treatment promoted a significant increase (p < 0.01) in neurite size when compared to the 30 nM treatment, as well as when compared to the RA-positive control (p < 0.001) (Figure 4(B)). These data demonstrate that the highest PTEN inhibition promoted a more noticeable increase in neuritogenesis in SH-SY5Y cells than the positive RA control for differentiation.
Once cells initiate the neuronal differentiation process, cell diameters decrease. Then, we also evaluated the average cell diameter after 3 and 7 days of PTEN inhibition. On day 3, similar values were obtained for the control group (30.71 µm) and siRNA control (33.30 µm). In contrast, cells submitted to 30 nM PTEN siRNA, and RA showed a significant (p < 0.001) reduction in cell diameter, being 28.35 µm and 29.13 µm, respectively, but without difference relative to the highest PTEN siRNA treatment (Figure 4(C)). For the evaluation performed after 7 days of PTEN inhibition, the treatments with RA (25.87 µm; p < 0.001) and PTEN siRNA 70 nM (27.14 µm, p < 0.001) showed a significant reduction in the mean cell diameter compared to the control group (29.36 µm). However, the treatment with PTEN siRNA 30 nM (30.58 µm, p < 0.001) did not show a significant difference in cell diameter. A significant difference was not observed in the diameters of cells treated with the control siRNA (29.36 µm) (Figure 4(D)). Thus, these results demonstrate that both PTEN inhibition treatments significantly reduce SH-SY5Y cell diameters, like what occurs in RA-induced neuronal differentiation.
For the neurodifferentiation analysis, the quantification of 100 cells was performed. Only those cells with at least one neurite with a length larger than the diameter of the cell body were considered differentiated neurons. On day 3, RA and PTEN siRNA (30 nM and 70 nM) were able to induce a significant increase (p < 0.05) in the percentage of neurodifferentiated cells when compared to the control group. The siRNA control, on the other hand, did not induce a significant increase in the percentage of differentiated cells (Figure 4(E)). After 7 days of PTEN inhibition, the percentages of neurodifferentiated cells were maintained for both treatments. A significant increase in the percentages of differentiated cells was observed at 94% for RA (p > 0.001), 89% for 30 nM PTEN siRNA (p > 0.001), and 95% for 70 nM PTEN siRNA (p > 0.001). However, there was a significant increase (62%) when comparing the siRNA control group (p > 0.05) with the negative control. Additionally, a notable difference was found for the comparison between PTEN siRNA treatments (30 and 70 nM) and the control siRNA (Figure 4(F)). These data indicate that PTEN inhibition can rapidly increase neuritogenesis and induce neurodifferentiation.
PTEN inhibition induces an increase of β-III-tubulin
The induction of neurodifferentiation was assessed by analyzing the expression of β-III-tubulin, a neuron marker, in cells analyzed after 3 and 7 days following PTEN inhibition. Initially, we applied an immunofluorescence assay for the analysis of β-III-tubulin expression. Treatments with RA, PTEN siRNA 30 nM, and 70 nM show an increase in fluorescence intensity (green) and morphological changes that are characteristic of differentiated neurons (Figure 5(A)). When evaluating the expression of β-III-tubulin protein, PTEN inhibition (70 nM siRNA) showed a propensity for increased β-III-tubulin expression, compared to the control (Figure 5(B) and (c)). The same was observed regarding the increase in mitochondrial mass, which is one of the critical characteristics of neuronal differentiation, and a significant increase (147.8%) was observed only in the treatment with RA compared to the negative control; this increase was already expected for RA-treated cells, due to its ability to induce a massive neuronal differentiation (Figure 5(D)).
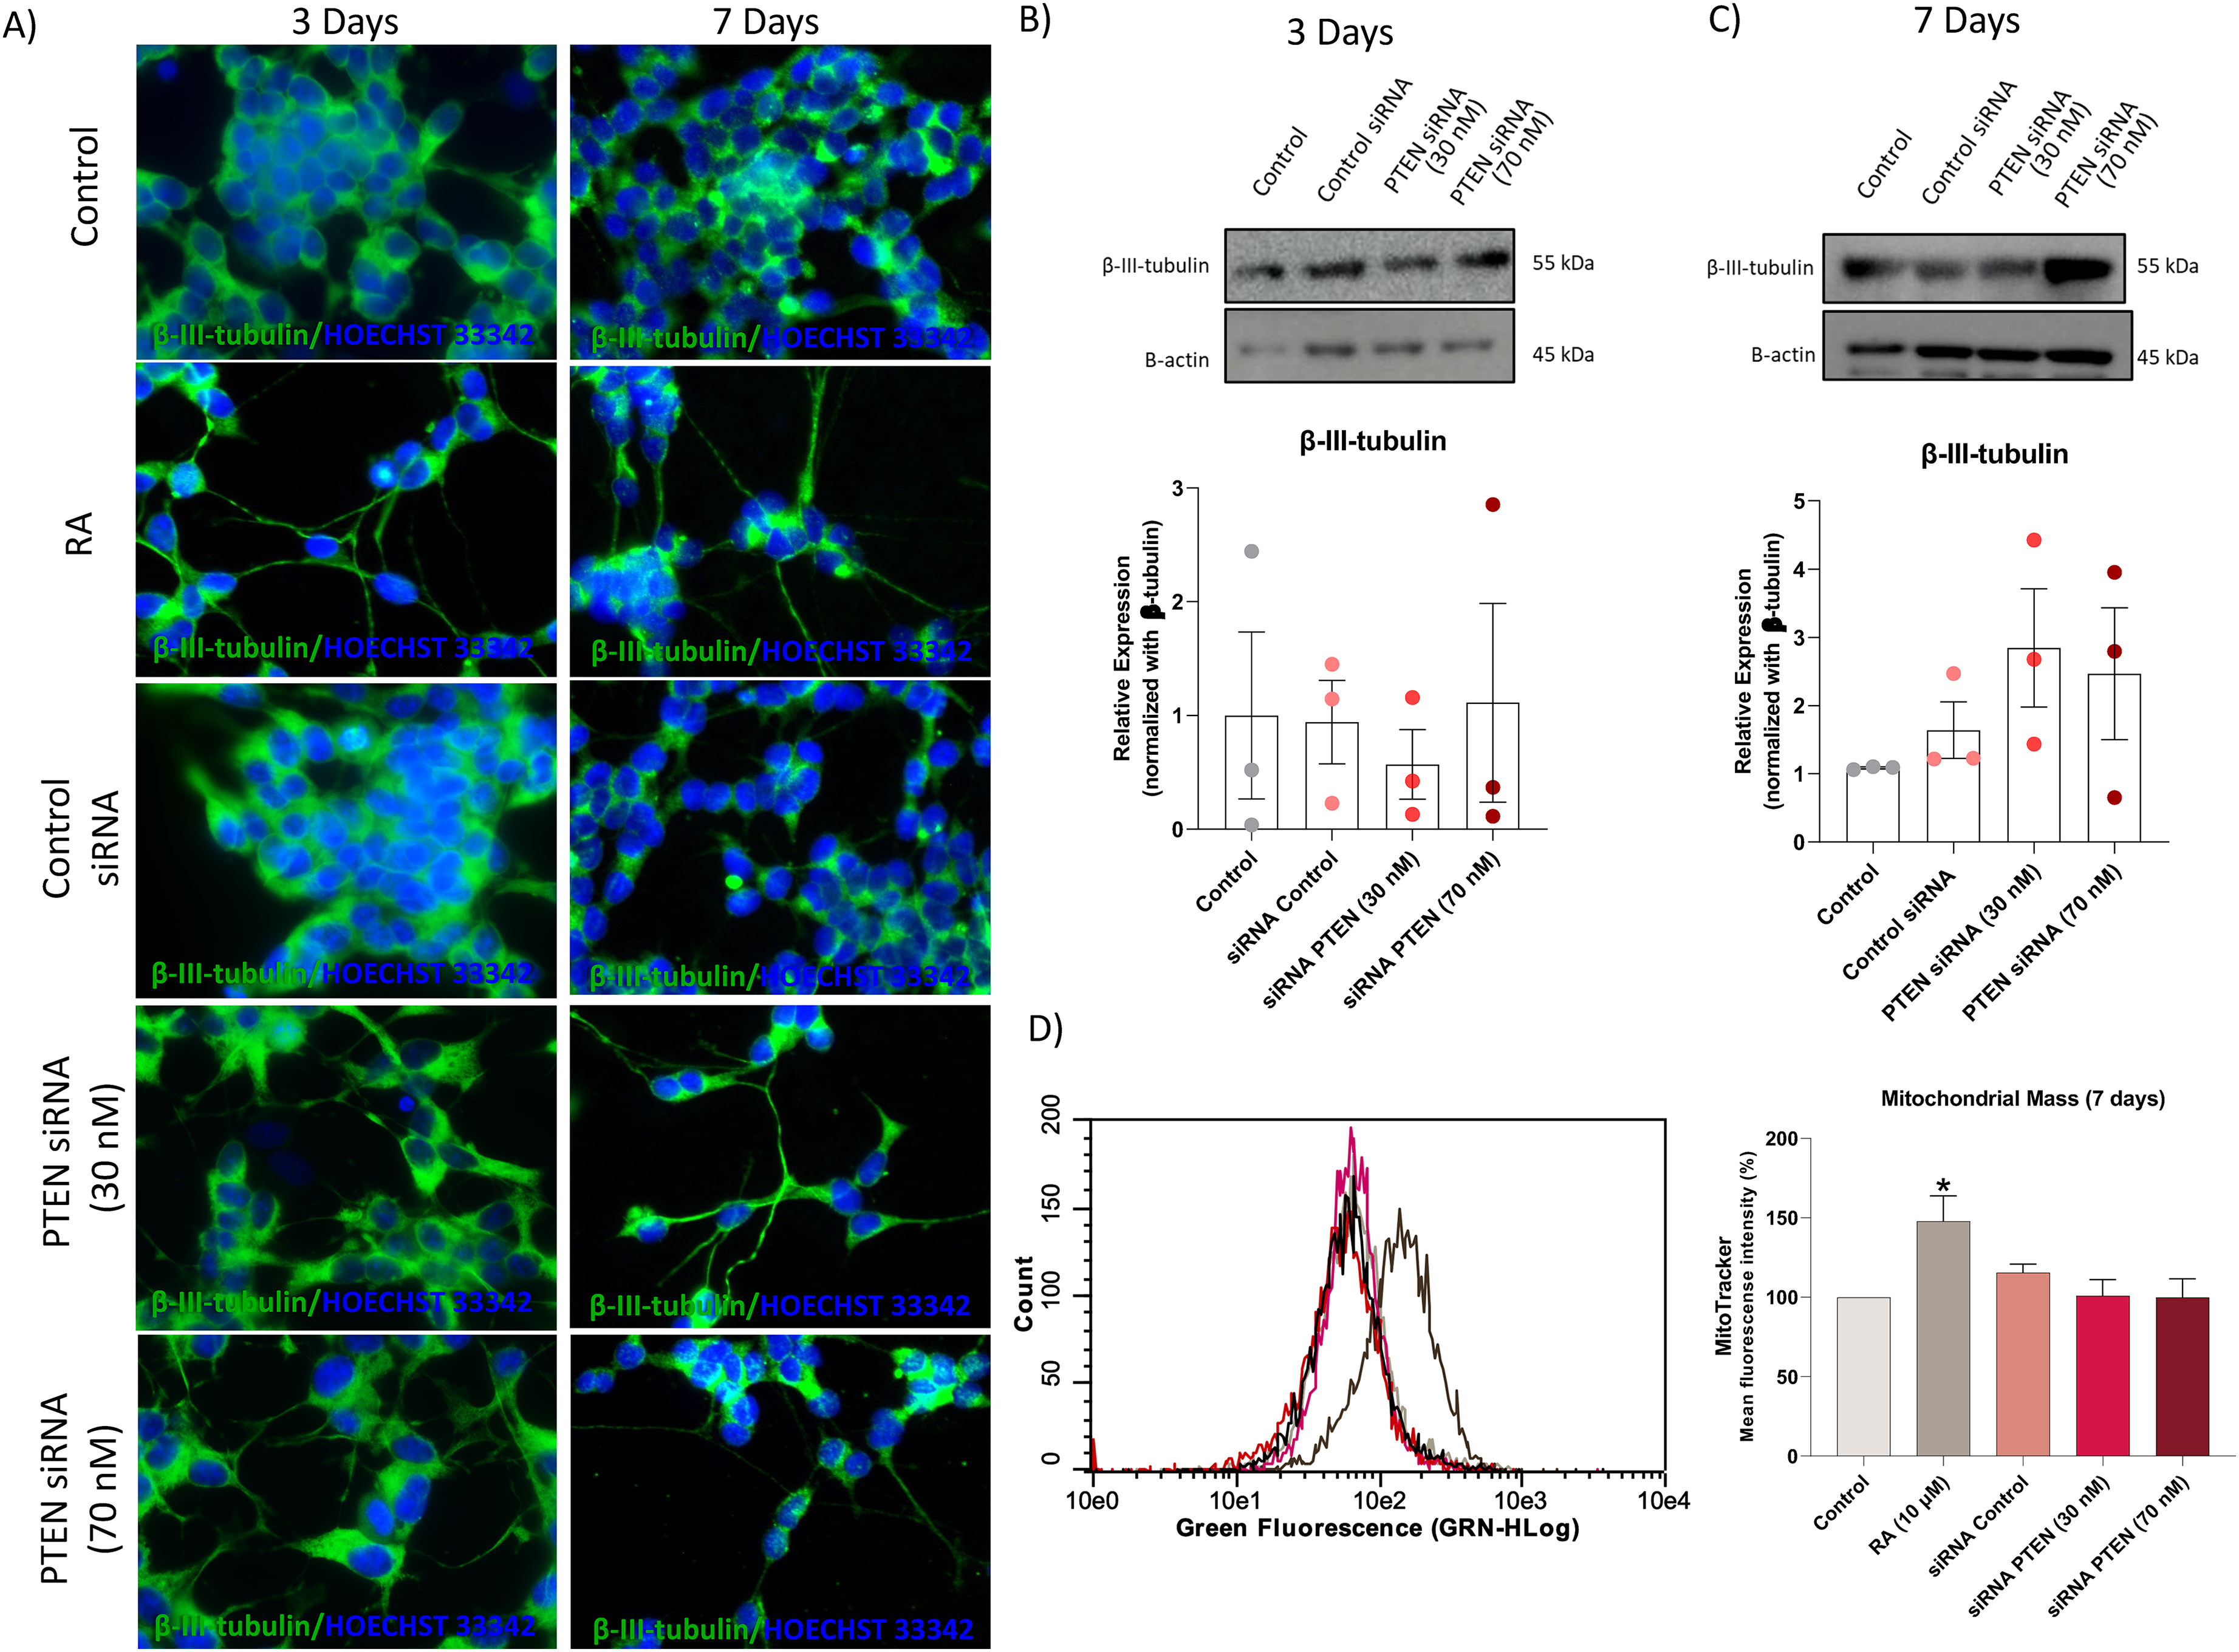
Neurodifferentiation assay in SH-SY5Y cell line. A) Representative immunofluorescence images showing the cytoskeleton labeled with anti-β-III-tubulin (1:500) and Hoechst 33342 staining (0.15 μg/mL) after 7 days of differentiation. Protein expression of β-III-tubulin (55 kDa) and β-actin (45 kDa) after PTEN inhibition by siRNA for 3 (B) and 7 days (C) was evaluated. Values were normalized with endogenous β-actin (45 kDa) protein using Image Studio Lite Ver 5.0 software (Lite Software). D) The mitochondrial mass measured by Mitotraker green (50 μm) staining can be seen in the histogram, which shows the average fluorescence intensities, and a representative graph is displayed for 7 days of treatment. Statistical analysis was performed by One-way ANOVA with Tukey post-test. Values are expressed as mean ± SEM (N=3). * p <0.05 indicates a significant difference compared to the control. Control: DMEM/F10 medium 1% FBS.
Inhibition of PTEN does not alter cell cycle progression
Analysis of cell cycle kinetics indicated that none of the treatments performed with PTEN siRNA (30 and 70 nM) and control siRNA induced significant changes in cell cycle kinetics evaluated at different time points (1, 3, and 7 days) (Figure 6). Only the RA-neuronal differentiation control induced a significant increase (p > 0.001) in the proportion of cells at the G0/G1 phase compared to the negative control, as expected for the positive control (Figure 6(C)). Furthermore, no changes in the proportion of cells at the Sub-G1 fraction were observed for all conditions tested (Figure 6).
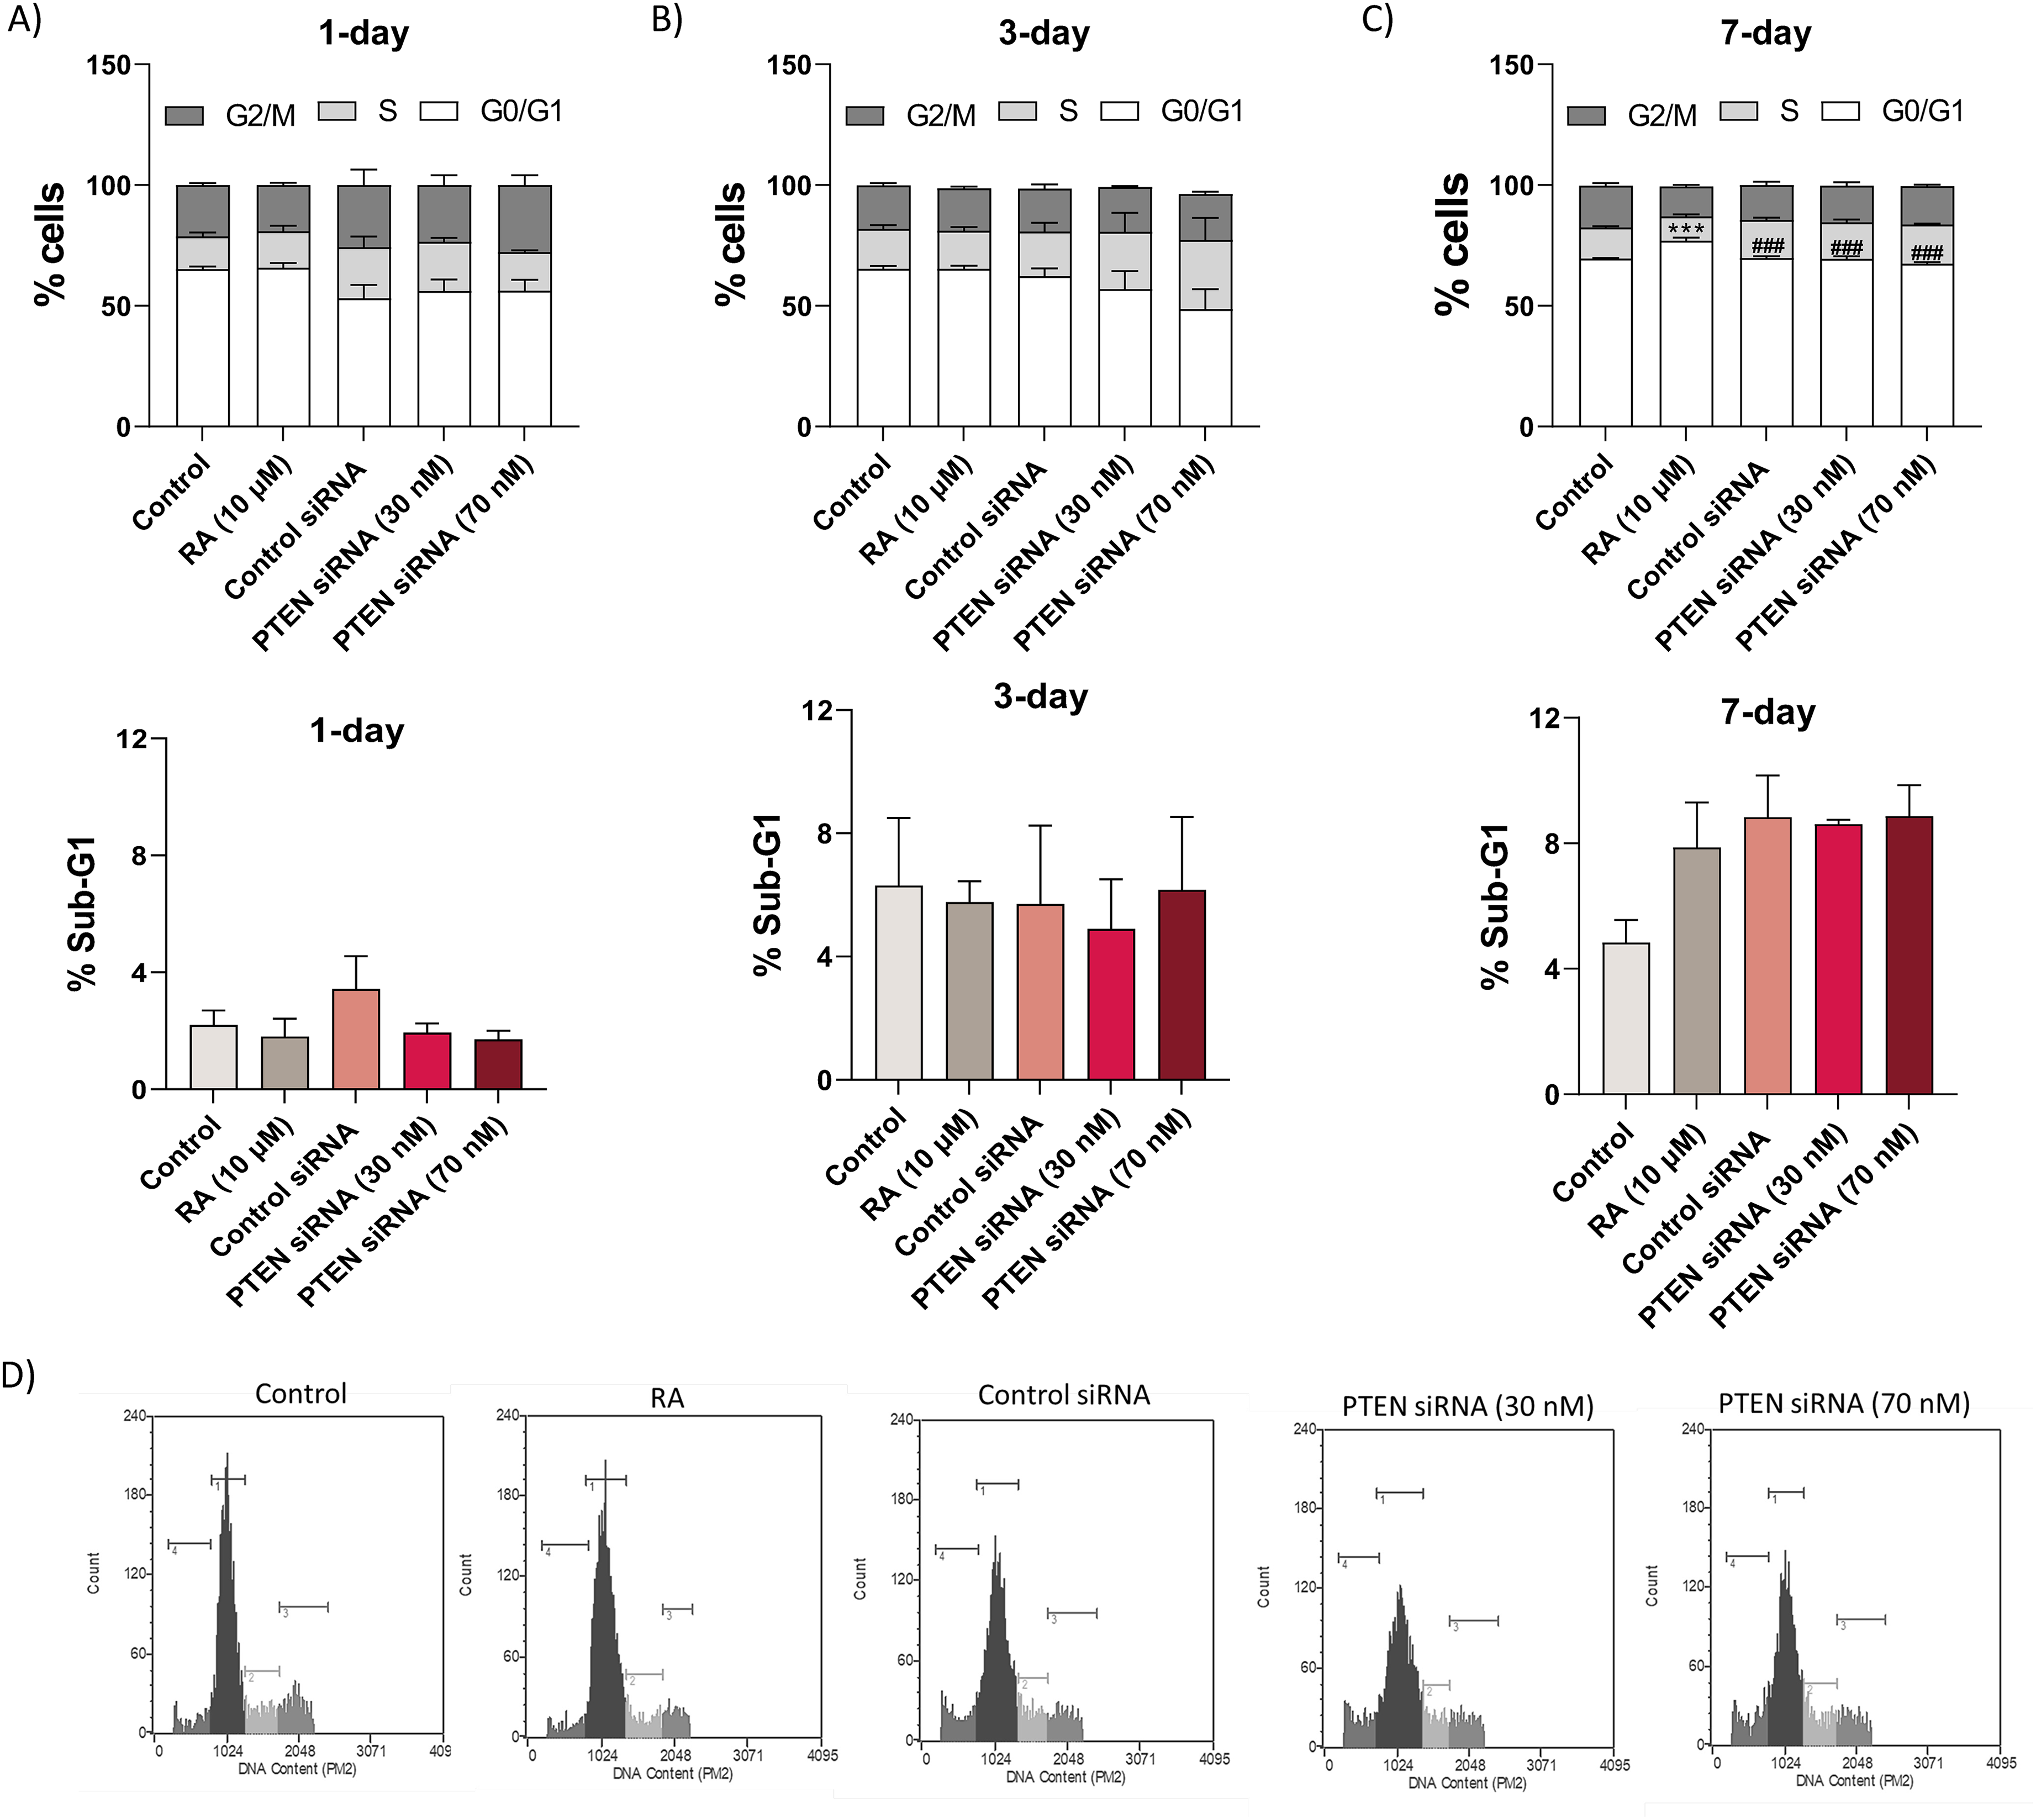
Cell cycle kinetics assessed during 7 days of neurodifferentiation in SH-SY5Y cells treated with PTEN siRNA. Cell cycle analysis for differentiated cells was performed using PI staining, and the proportions of cells were determined for each cell cycle phase and Sub-G1 fraction at different time-points: day 1 (A), day 3 (B), and day 7 (C). (D) Distribution of cells at different cell cycle phases and Sub-G1 after 7 days of PTEN siRNA treatments. One-way ANOVA statistical analysis with Tukey post-test was performed. Values are expressed as mean ± SEM (N=3). *** p <0.001 indicates a significant difference when compared to the control. ### p <0.001; ## p <0.01 indicates a significant difference when results were compared to RA. Control: DMEM/F10 medium 1% FBS.
Cell proliferation index following 7 days of neurodifferentiation induced by PTEN inhibition
The cell proliferation index in response to PTEN siRNA treatments (30 nM and 70 nM) was analyzed for 7 days after PTEN inhibition. The cell proliferation rates were calculated as the number of cell duplications on days 2, 4, and 7 for the different treatments. As expected, the RA (positive control) showed decreased cell duplication rate after differentiation. However, none of the PTEN siRNA or siRNA Control treatments changed the cell proliferation index in the SH-SY5Y cells (Figure 7).

Cell proliferation index in response to PTEN siRNA treatments, analyzed by flow cytometry, during the period of neurodifferentiation, aiming to count the number of viable cells using the ViaCount cell viability kit (Merck Millipore). Statistical analysis was performed by Two-way ANOVA with Tukey post-test. Values are expressed as mean ± SEM (N=3). *** p <0.001 indicates a significant difference when compared to the control. ### p <0.001; ## p <0.01; # p <0.05 indicates a significant difference when results were compared to RA. Control: DMEM/F10 medium 1% FBS.
PTEN inhibition does not increase ROS in SY-SY5Y cells
Evaluation of intracellular ROS (superoxide radical-DHE) indicated that none of the treatments employed induced any increase or decrease at the 1-, 3- or 7-day times (Figure 8(A)–(C)). Regarding mitochondrial ROS production (superoxide radical-MitoSox), no change was observed after 24 h of PTEN inhibition (Figure 8(D)); however, we observed that at the 3-day time after PTEN inhibition at both 30 nM (p < 0.05) and 70 nM (p < 0.01) concentrations, as well as in control siRNA (p < 0.05), there was a significant reduction in the production of mitochondrial superoxide radical when compared to RA treatment (Figure 8(E)). In contrast, after 7 days of PTEN inhibition, the normalized values, and the RA treatment induced a significant increase (p < 0.01) in the production of mitochondrial superoxide radical compared to the control (Figure 8(F)). These results demonstrated that PTEN inhibition by siRNA was not able to induce a significant increase in ROS generation in SH-SY5Y cells.
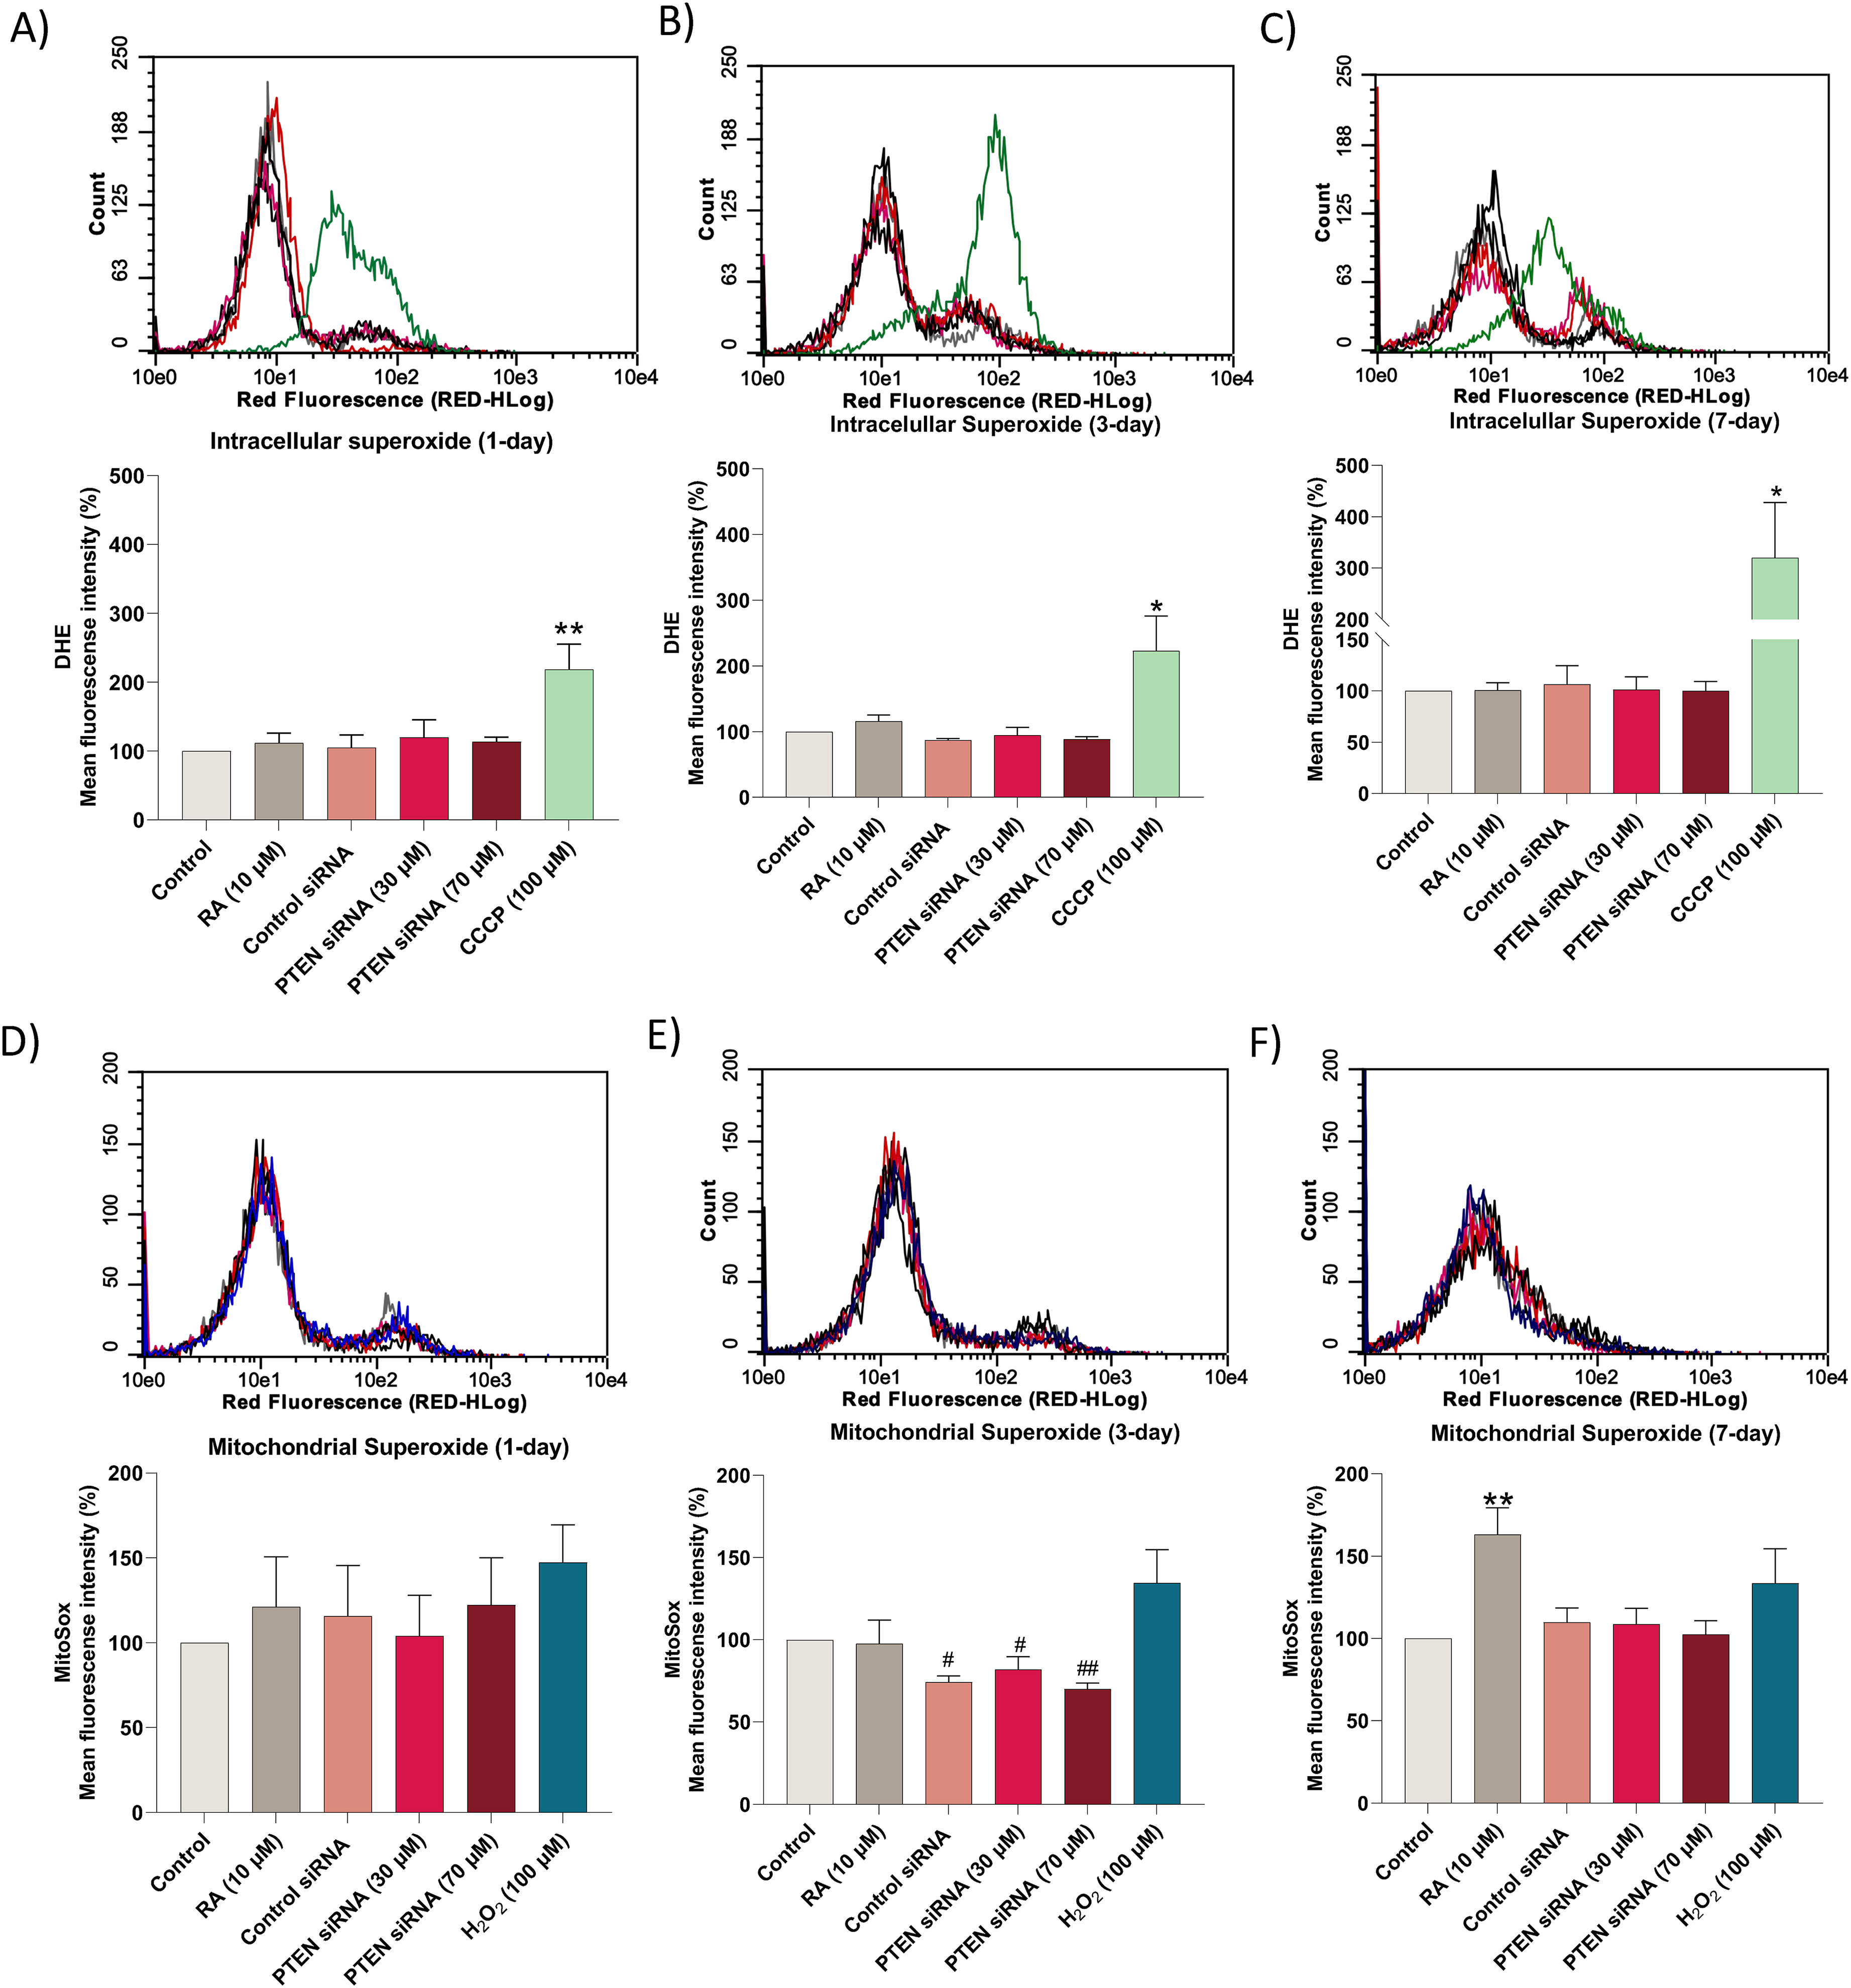
Effects of PTEN inhibition on superoxide production. Intracellular ROS levels were measured by flow cytometry with DHE dye after 1 (A), 3 (B), and 7 days (C), as well as mitochondrial ROS levels, which were measured with MitoSox red dye after 1 (D), 3 (E) and 7 days (F). Values are expressed as mean ± SEM. At least three independent experiments were performed. The carbonylcyanide-3-chlorophenylhydrazone (CCCP) was used as a positive control for the induction of intracellular ROS, by treating cells with 100 μM for 30 min. For mitochondrial ROS, the hydrogen peroxide (H2O2) was used as a positive control at a concentration of 100 μM for 30 min. Statistical analysis was performed by One-way ANOVA with Tukey post- test. Values are expressed as mean ± SEM (N=3). **p < 0.01; *p < 0.05 indicates statistically significant differences compared to the negative control. ##p < 0.01 and #p < 0.05 indicate statistically significant differences compared to RA. Control: DMEM/F10 medium 1% FBS.
PTEN knockdown induces AKT pathway
The AKT protein is activated when it is phosphorylated at Ser473, which in turn acts to inhibit GSK3-β by phosphorylation at Ser9. The GSK3-β protein is closely related to the formation of NFTs in AD, as a consequence of its increased phosphorylation that can lead to the abnormal hyperphosphorylation of the Tau protein. 23 The abnormal phosphorylation of tau at Thr205 is associated with AD. 24 Thus, we sought to evaluate whether PTEN knockdown would interfere with the modulation of the AKT/GSK3-β/Tau pathway. We found that PTEN knockdown shows evidence of an up-regulation of phospho-AKT (Ser473), phospho-GSK3-β (Ser9), and down-regulation of phospho-Tau (Thr205) after 7 days of treatment (Figure 9(A)–(F)). This data suggests that PTEN knockdown could modulate key components in the AKT/GSK3-β/Tau pathway, indicating its potential role in influencing neuronal differentiation pathways.
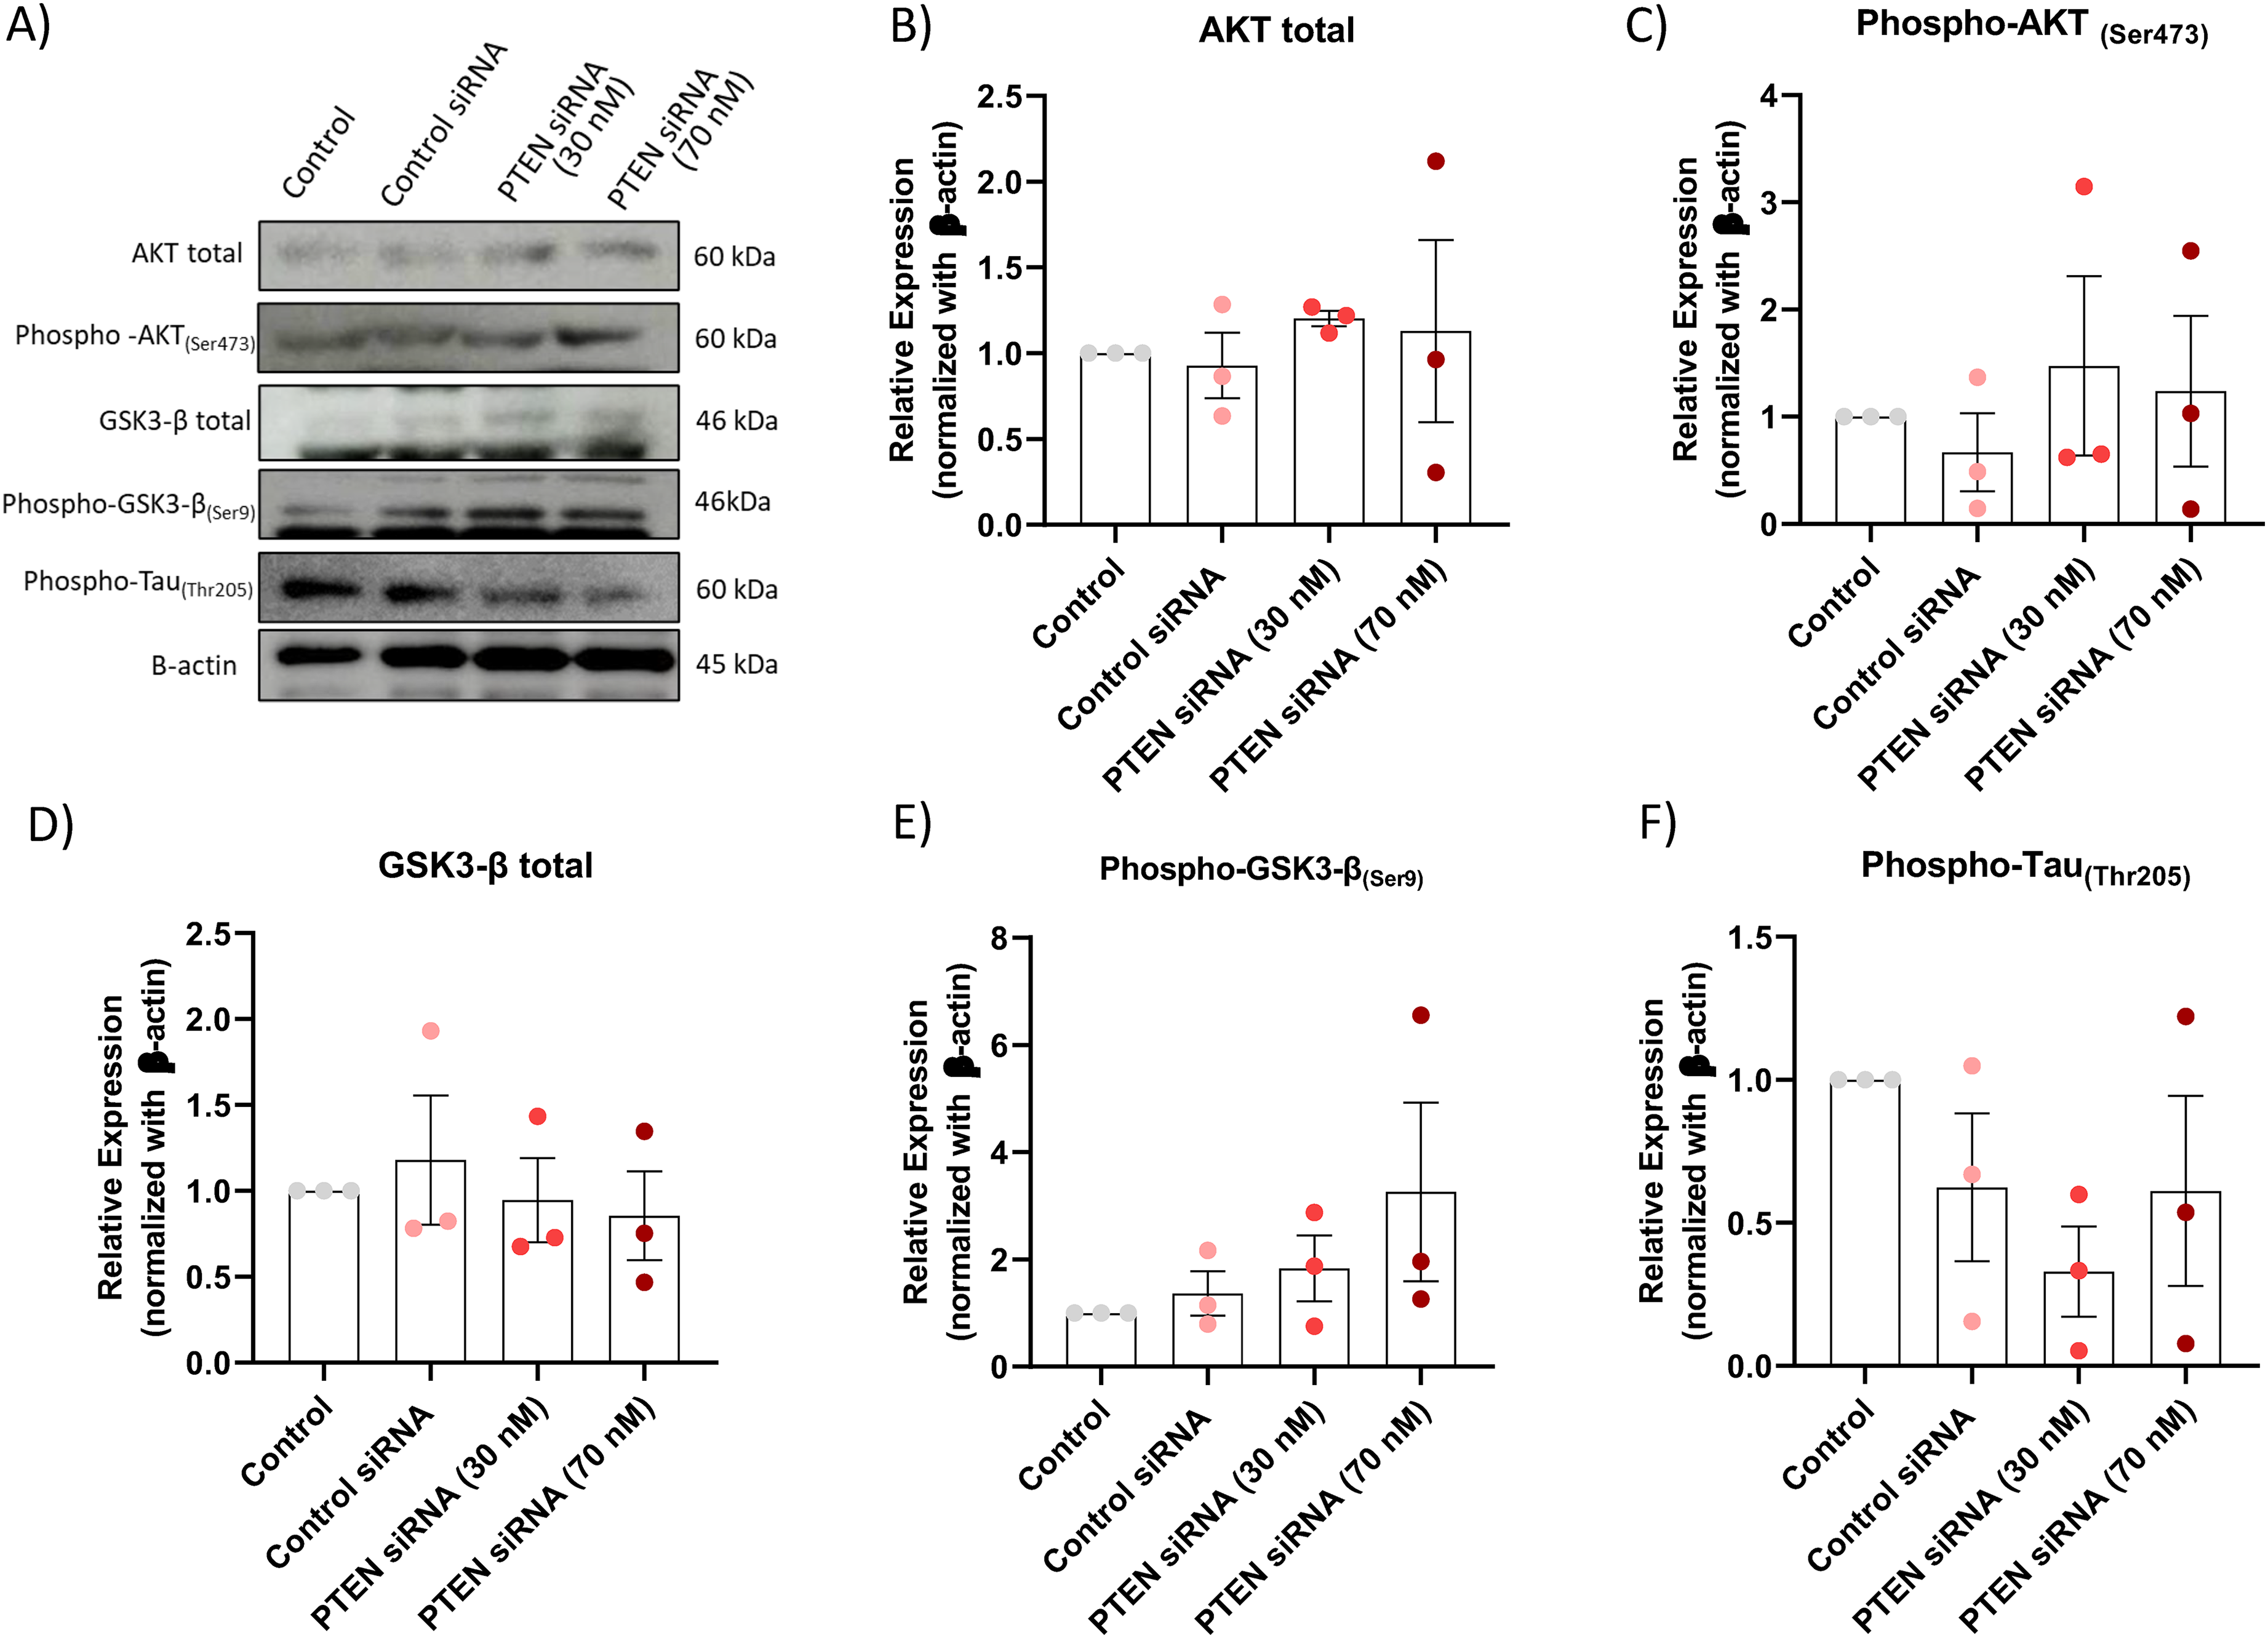
Protein expression after 7 days of PTEN knockdown in SH-SY5Y cells. A) Expression of AKT total (∼60 kDa), phospho-AKT(Ser473) (∼60 kDa), phospho-GSK3-β total (∼46 kDa), GSK3-β(Ser9) (∼46 kDa), phosphor-Tau (Thr205) (∼60 KDa), and β-actin (∼45 kDa) analyzed by Western blotting. The images were obtained in the same gel/blot and image contrast adjustment was performed when needed for better viewing. The uncropped blots are shown in Supplementary data. (B) Protein expression of AKT total (∼60 kDa); (C) phospho-AKT(Ser473); (D) phospho-GSK3-β total; (E) GSK3-β(Ser9) and (F) phospho-Tau (Thr205) (N=3). The values were normalized with the endogenous β-actin protein, using the software Image Studio Lite Ver 5.0 (Lite Software). Three independent experiments were performed. Values are expressed as mean ± SEM (N=3). Three or four independent experiments were performed. Statistical analysis: One- way ANOVA, post-test Tukey.
PI3K/AKT inhibitor LY294002 prevents neurogenesis and neuritogenesis in PTEN-knocked cells
Next, experiments were performed to confirm the results obtained in experiments with PTEN knockdown, aiming to demonstrate that PTEN/AKT signaling can modulate neuronal differentiation and neuritogenesis. We used the PI3K inhibitor LY294002 concomitantly with the siRNA treatment. SH-SY5Y cells were treated with PTEN siRNA (30 and 70 nM) and control siRNA in combination or not with LY294002 (20 µM), and the results were analyzed after 3 days. We found that the PI3K inhibitor LY294002 can prevent the differentiation and neurite growth induced by PTEN siRNA (Figure 10(A) and (B)). In addition, LY294002 significantly (p < 0.05) reduced the average diameter size of SH-SY5Y cells with and without siRNA treatment (Figure 10(C)). These data showed that the PTEN knockdown led to neuronal differentiation and neuritogenesis by activating the AKT signaling pathway, suggesting that PTEN may be an interesting therapeutic target to be investigated in AD.
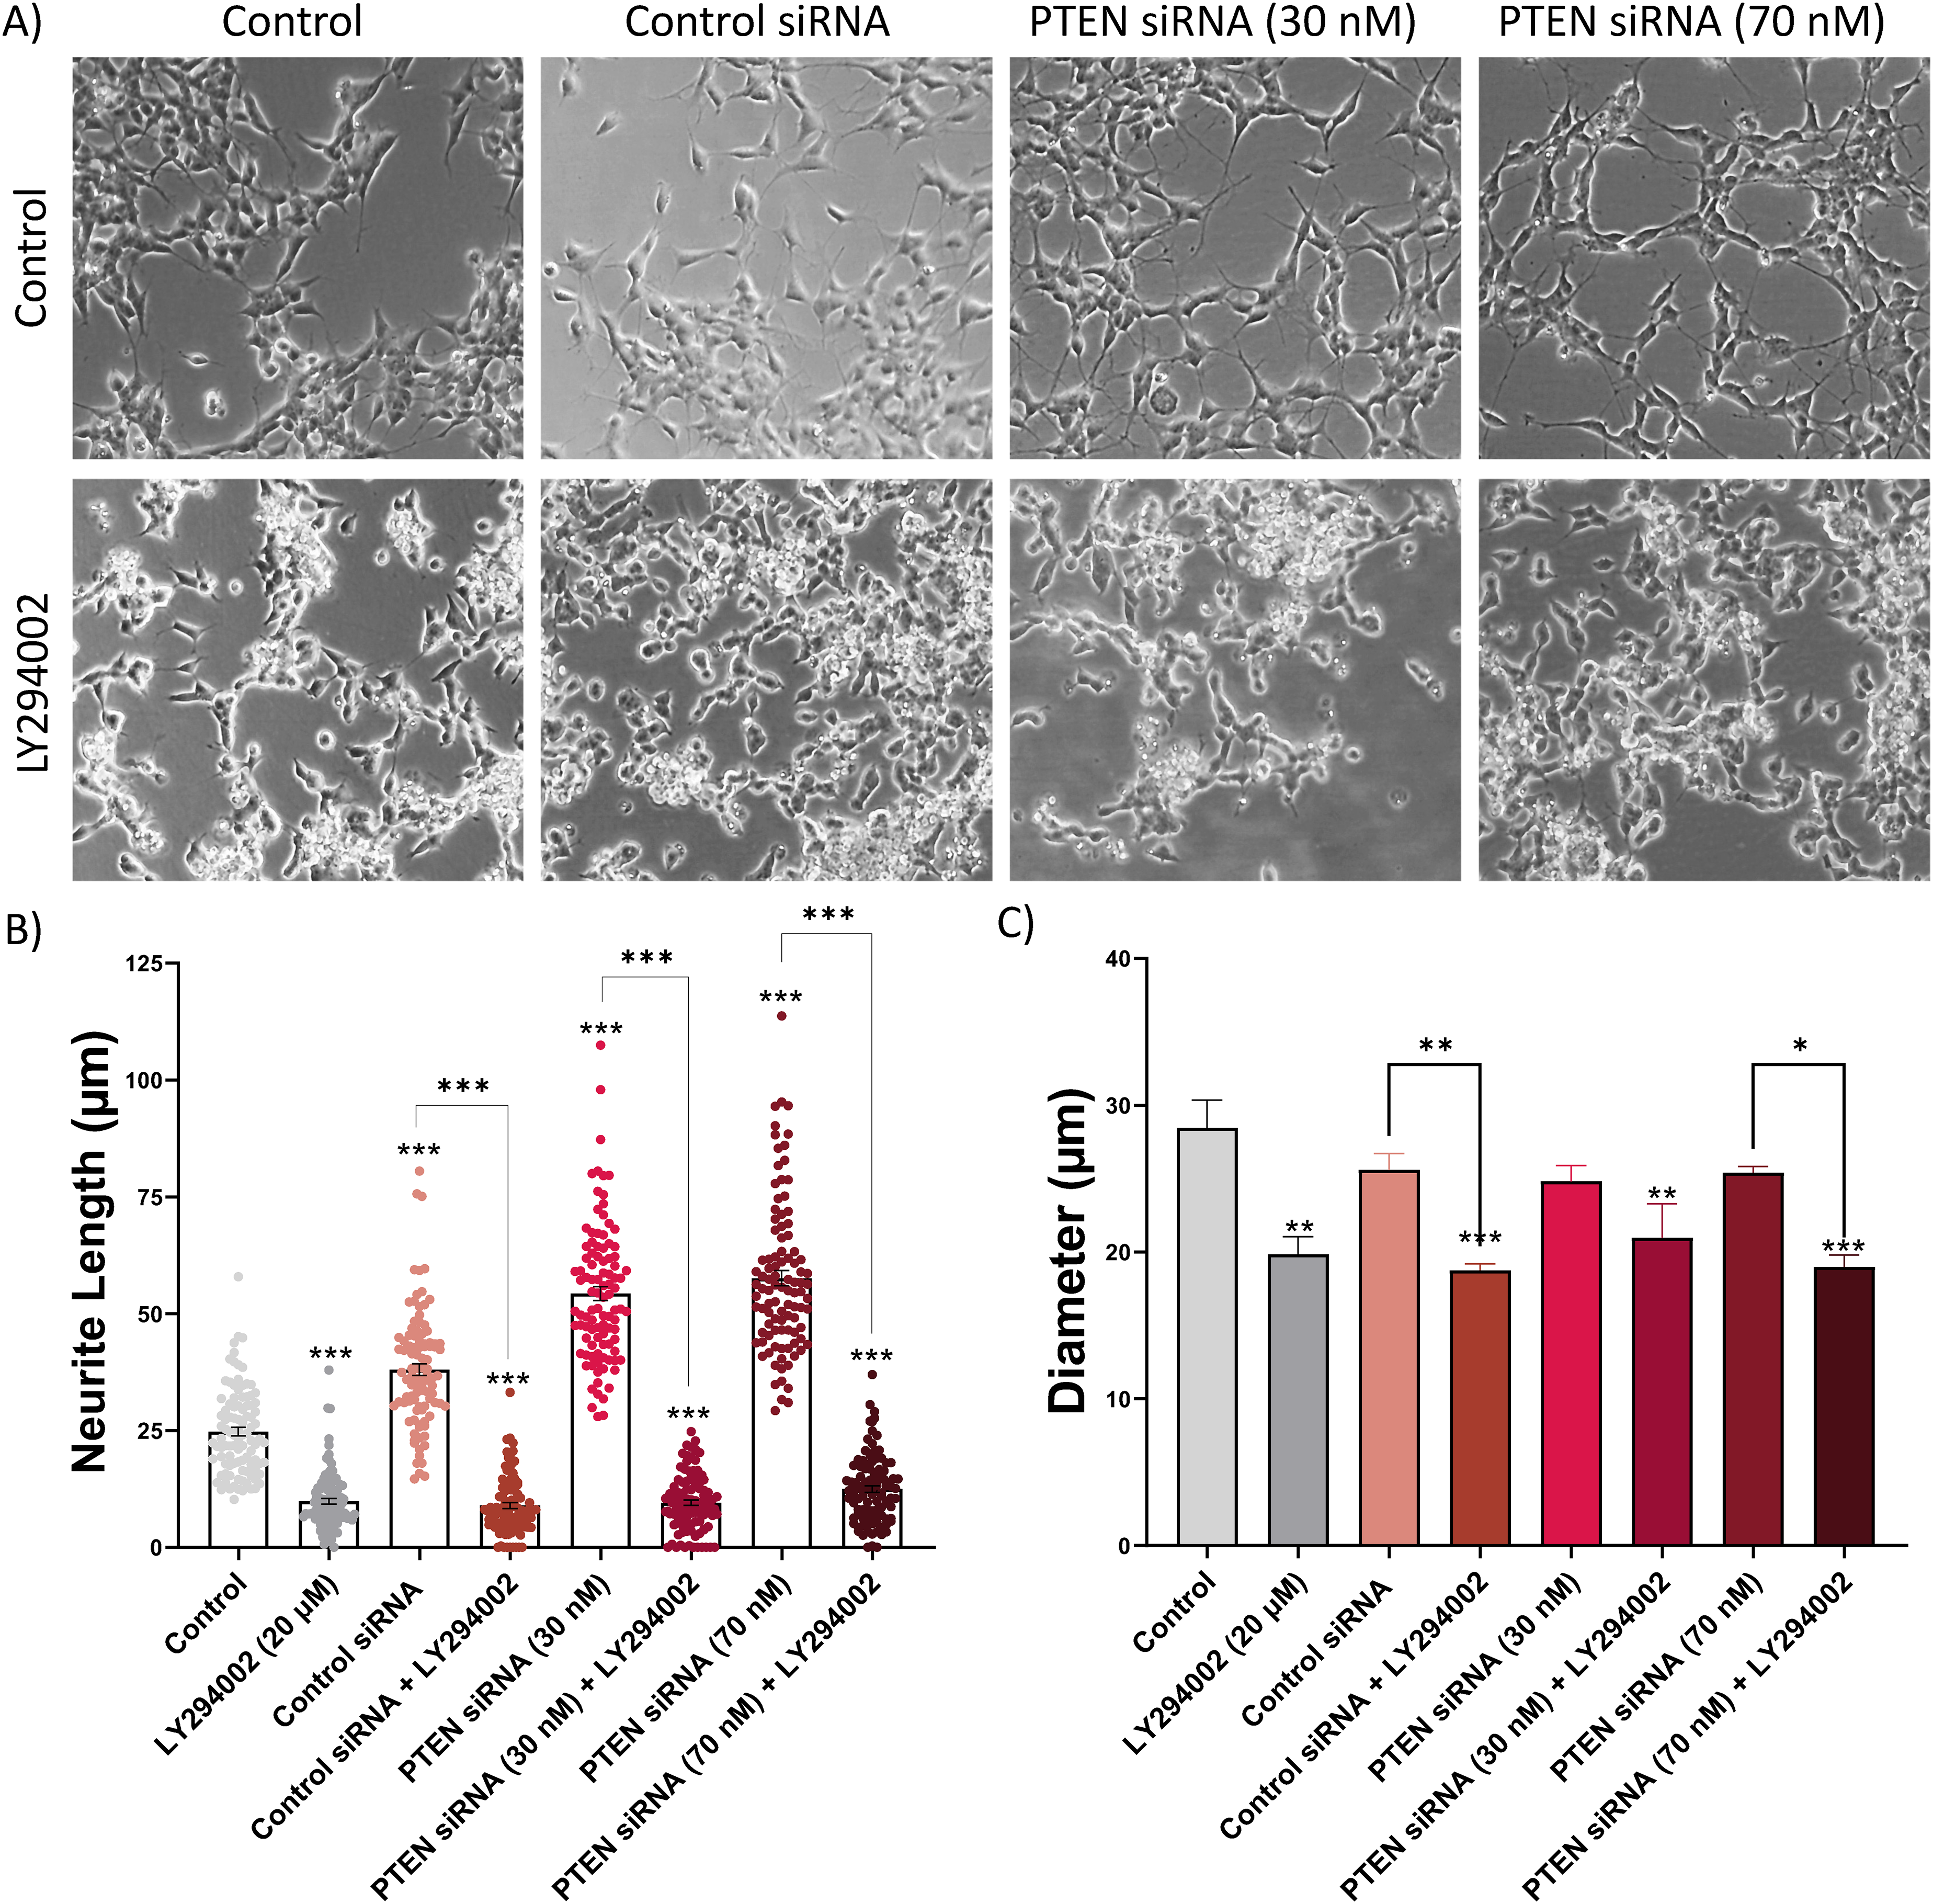
The PI3K/AKT inhibitor LY294002 prevents neurogenesis and neuritogenesis in PTEN knockdown cells after 3 days of PTEN siRNA. (A) Morphological changes can be observed under 20x magnification using an inverted microscope (EVOS XL Core Imaging System, Thermo Fisher Scientific, Inc.). (B) The average length of neurites was evaluated on day 3, (C) as well as the analysis of cell diameter. ImageJ (FIJI) software was used, and 100 cells were randomly analyzed. One-way ANOVA statistical analysis with Tukey post-test. Values were expressed as mean ± SEM (N=3). *** p <0.001; ** p <0.01; * p <0.05 indicates significant differences when results were compared to the control or between groups. Control: DMEM/F10 medium 1% FBS.
Discussion
Drug treatments for AD are primarily designed to treat the cognitive, behavioral, and psychological symptoms of dementia. 25 However, the clinical efficacy of these treatments is only modest, and despite the efforts in designing new therapy modalities, the search for novel therapies that may be promising and efficient to provide preventive and curative fronts against AD remains. 3
Recently, searching for new therapeutic targets for AD seems to be a more effective choice among all types of modalities based on molecular targets that are implicated in the mechanisms involved in the development (or progression) of the disease. Based on the evidence that the hippocampus harbors self-renewing and multipotent adult neural stem cells (NSCs),5–7 the activation of neurogenesis and neuritogenesis might be a great possibility for therapy intervention, aiming to achieve neuroprotective effects.
The PI3K/AKT pathway promotes cell survival by increasing the phosphorylation of downstream substrates, being negatively regulated by PTEN, which regulates cell proliferation and neuronal growth. In this context, we studied the impact of PTEN knockdown in neurons differentiated from SH-SY5Y cells, and the results showed that PTEN inhibition by siRNA PTEN induced neuronal differentiation and neuritogenesis by regulating the AKT signaling pathway. However, when evaluating the cell proliferation index, we did not observe changes in any of the PTEN siRNA treatments.
Firstly, we characterized the efficiency of PTEN inhibition by siRNA in the SH-SY5Y cell model, and we found approximately a 50% reduction of PTEN protein expression, which remained for three days and up to at least seven days after PTEN siRNA treatment. The most potent downregulation of PTEN was observed on day three for siRNA 70 nM. Similar results regarding the efficiency of PTEN inhibition were previously reported in different cell models.26,27 In a study of PTEN inhibition with siRNA performed in dorsal root ganglion neurons, a reduction in PTEN protein levels was observed in a time-dependent manner, measured at 24 h, 48 h, and 72 h, and the most substantial reduction occurred at 72 h, 26 similarly to that observed in this work. It is noteworthy that the transient inhibition of PTEN proved to be sufficient to support neuronal differentiation and neuritogenesis in SH-SY5Y cells. This sustained effect persisted even after PTEN expression levels returned to the baseline level, underscoring the importance of this signaling pathway. Consequently, we found it coherent to proceed with the use of cells under this condition for subsequent phenotypic and mechanistic experiments. Furthermore, PTEN inhibition induced significant morphological changes that were indicative of neuronal differentiation, including neurite growth and reduced cell cytoplasm, starting from the third day and persisting until the seventh day in SH-SY5Y cells. The role of PTEN in axonal outgrowth is already well-reported in the literature. For example, under the condition of neuroglobin overexpression, it was shown the promotion of axonal growth in cultured cortical neurons due to PTEN suppression and a consequent increase in AKT phosphorylation. 22 In another study, pharmacological inhibition of PTEN caused a dose- and time-dependent increase in neuritogenesis in hESC-derived neural progenitor cells. 28 Another study showed that the conditional deletion of PTEN led to a persistent increase in the self-replication capacity of neural stem cells. 29 All these findings are consistent with our results regarding the impact of PTEN knockdown on neurite growth and neuronal differentiation.
It has been reported that the neuronal differentiation process can lead to an increase in mitochondrial mass, due to the high energy demand of neurons. 30 However, in this work, PTEN knockdown induced neuronal differentiation, but without promoting changes in mitochondria mass or oxidative stress; similarly, cell proliferation and changes in cell cycle progression were not found in PTEN-silenced SH-SY5Y cells. Studies with retinoic acid (RA), a positive control for differentiation of SH-SY5Y cells, promote morphological cellular changes, trigger a decrease in cell proliferation and cell cycle arrest, as well as promote an increase in mitochondrial content. 31 The inhibition of PTEN expression by the microRNA-29a-3p was also found to affect SH-SY5Y cell proliferation and neurite growth. 32
It is already well described in the literature that the Akt pathway can be an effective approach to prevent the progression of neurodegeneration. Since active Akt promotes neuronal cell survival by increasing the phosphorylation of downstream substrates, including Bad, FOXOs, GSK3β and caspase-9, the intervention on key components of this pathway might provide a promising strategy to be applied in the field of molecular targets in neurodegenerative diseases, and this is in agreement with literature data. 13 In the present work, we demonstrated that PTEN knockdown was able to promote an increase in the AKT-activated form and a reduction in the GSK3-β active form. On the other hand, studies have shown that PTEN knockdown can reduce okadaic acid-induced hyperphosphorylation of tau in SH-SY5Y cells, and consequently increases cell proliferation and survival. 33 This effect may occur as a consequence of PTEN suppression on the AKT activation, thus inhibiting GSK3-β, an enzyme responsible for Tau hyperphosphorylation in AD.33,34 In agreement with these findings, Song et al. also found that PTEN knockdown activated the AKT/GSK3-β signaling pathway, thus inducing cell proliferation and differentiation of PC12 cells. 19
Furthermore, seeking to demonstrate that the AKT pathway is essential for the results obtained in this work, we used the PI3K inhibitor LY294002 in experiments with PTEN siRNA treatments. Under this condition, we found that LY294002 prevented neurite formation and growth in silenced PTEN siRNA cells, thus confirming that the PI3K/AKT pathway is crucial for the neurodifferentiation and neuritogenesis of these cells. Similar data reported by Song et al. (2018) showed that PI3K inhibitor LY294002 can reverse sh-PTEN-induced cell differentiation and proliferation in PC12 cells, whereas in another study, the compound bpV(pis), a PTEN inhibitor, attenuated LY294002-induced AKT inhibition in SH-SY5Y cells. 34
The information obtained in the present study demonstrates the importance of the PTEN/AKT/GSK3-β axis in the regulation of the mechanisms underlying neuronal survival and differentiation (Figure 11). These findings support the assumption that this pathway can be an interesting approach, especially regarding the use of PTEN protein as a promising molecular target for the treatment of neurodegenerative diseases, including AD.
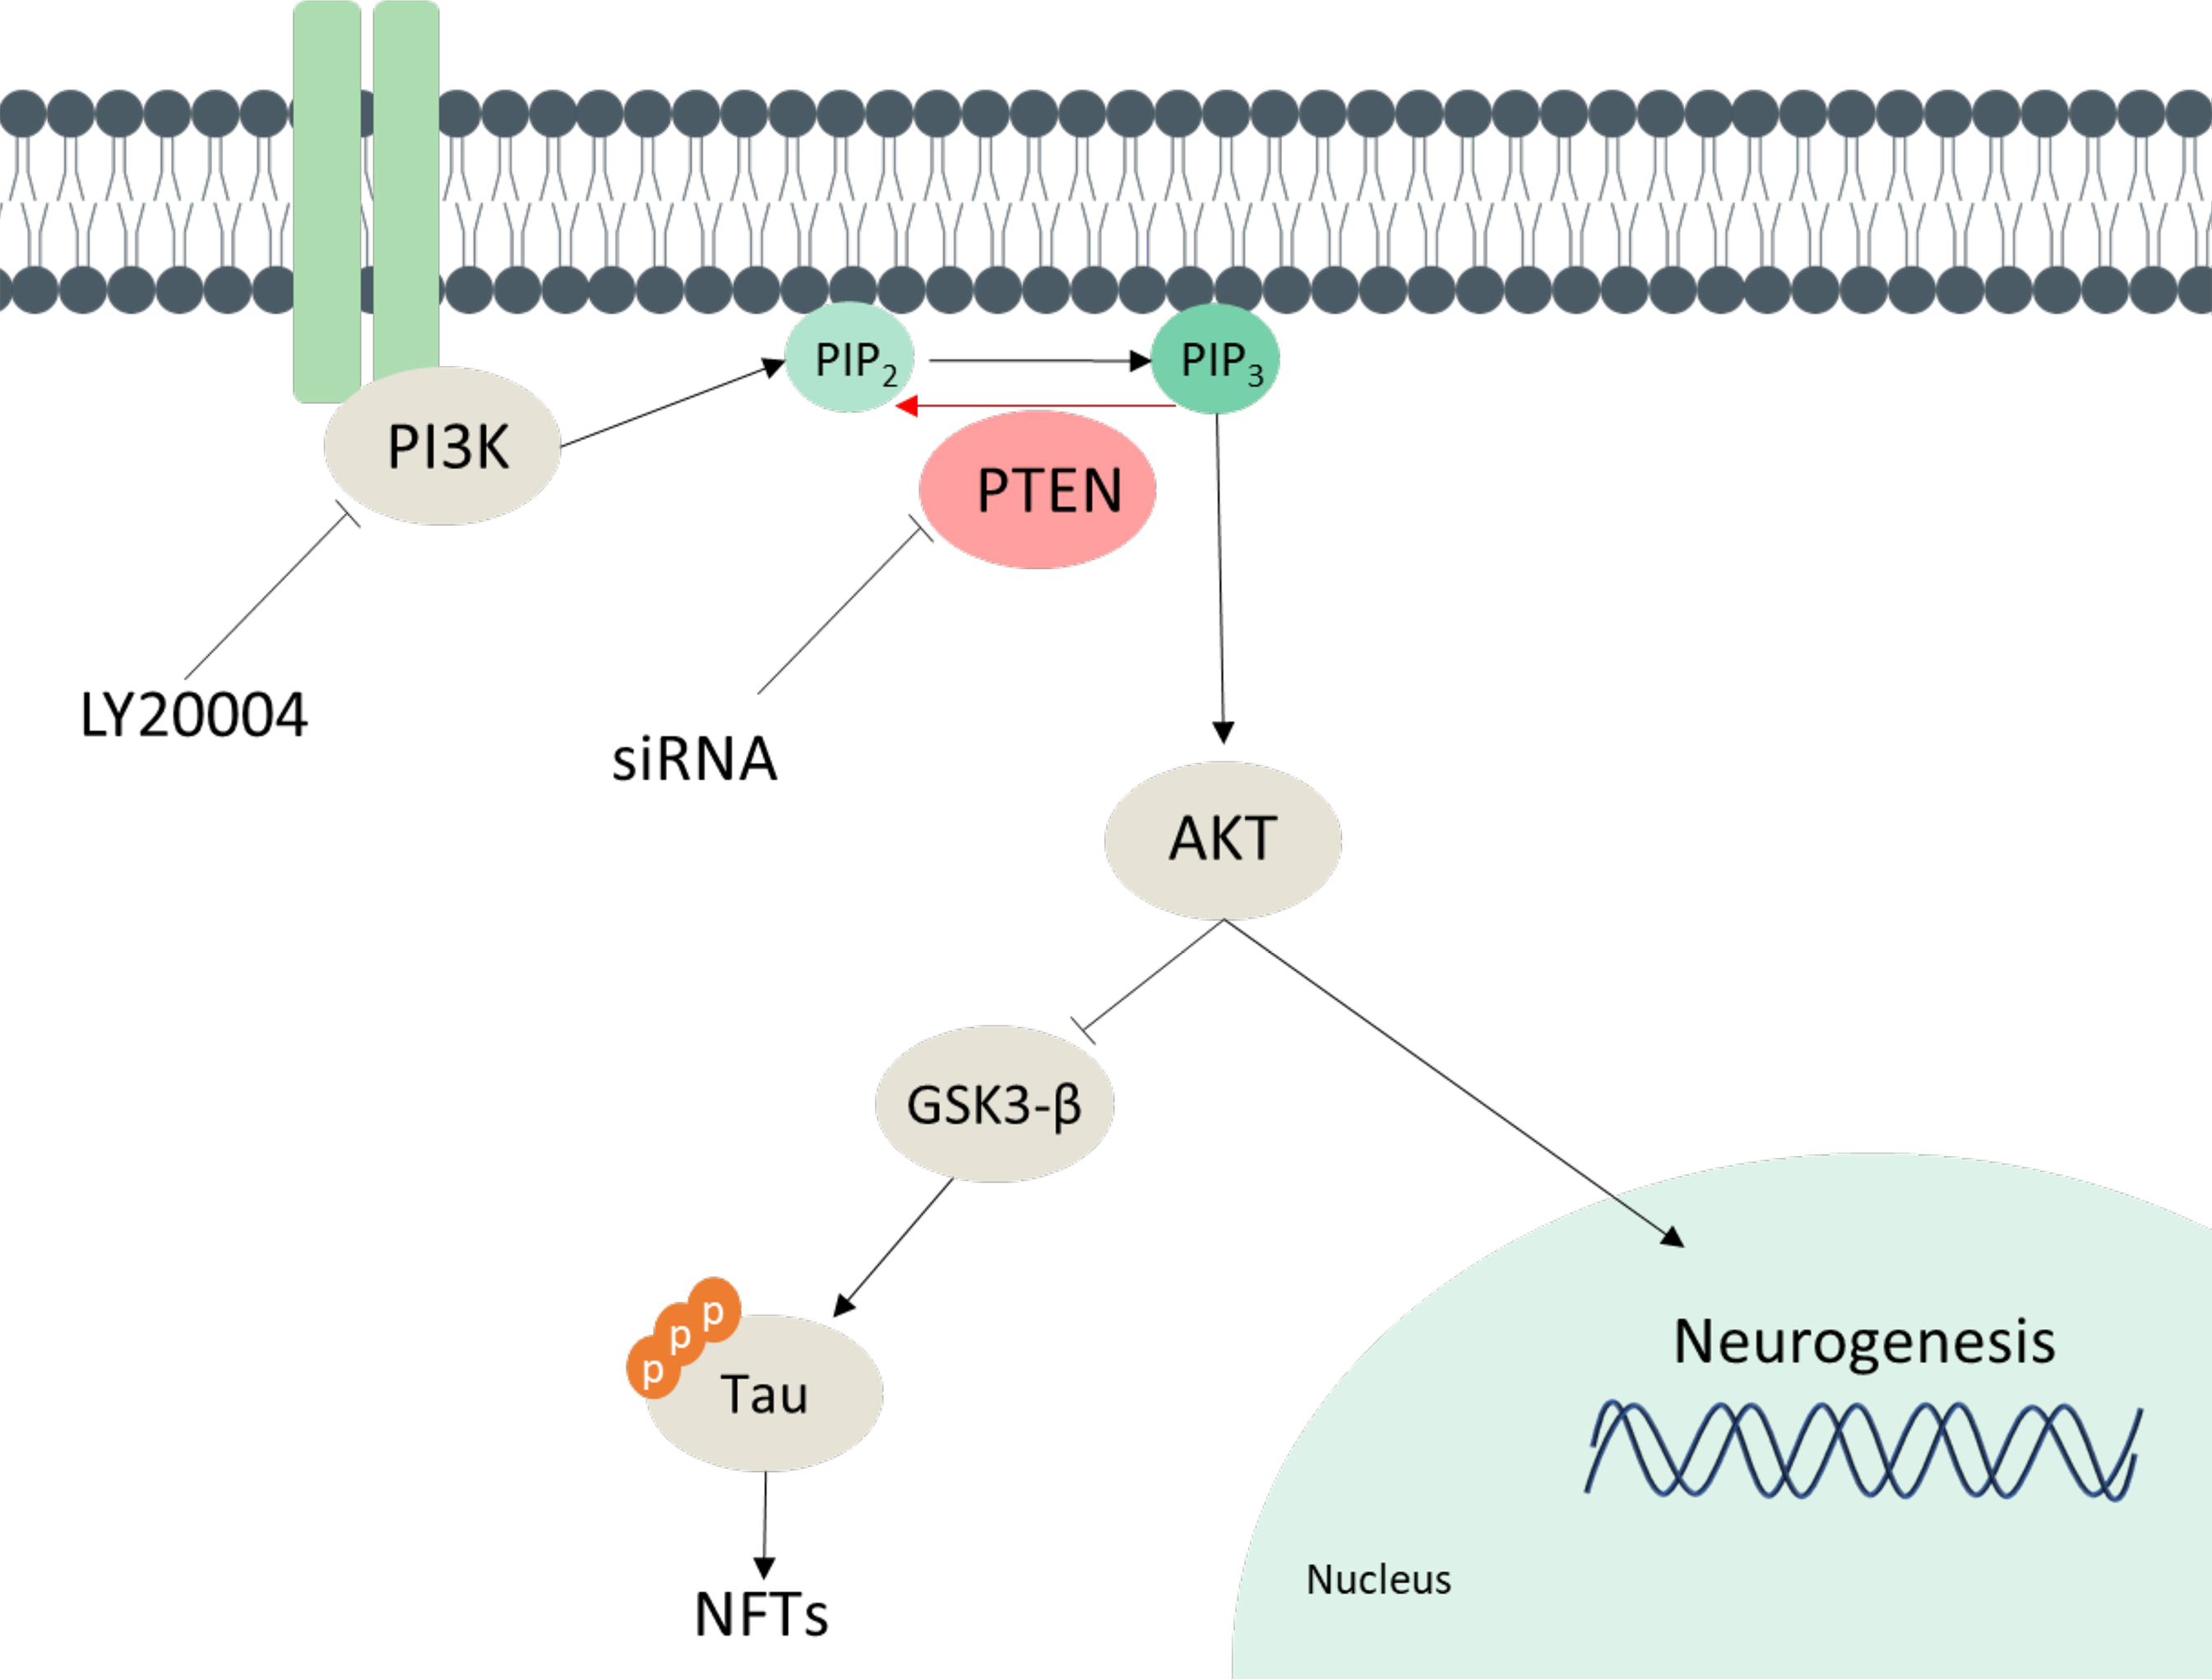
Schematic representation of the PI3K/AKT signaling pathway. PI3K converts phosphatidylinositol (3,4)-biphosphate (PIP2) to phosphatidylinositol (3,4,5)-trisphosphate (PIP3), which activates protein kinase B (AKT). The AKT pathway regulates various cellular functions, such as inhibiting glycogen synthase kinase 3-β (GSK3-β), or inducing the expression of genes involved in neurogenesis. The PI3K/AKT signaling pathway can be regulated at several steps in the signaling cascade. Phosphatase and tensin homolog (PTEN) protein induces dephosphorylation of PIP3 into PIP2 and is a negative regulator of PI3K/AKT signaling. When PTEN was knocked down by siRNA, it was possible to observe a positive regulation of AKT signaling, which can be reversed by the compound LY294002, a chemical PI3K inhibitor, thus inducing a negative regulation of this pathway.
Conclusions
In conclusion, using the PTEN knockdown strategy, we demonstrate that PTEN can promote neurogenesis and neuritogenesis in SH-SY5Y cells through modulation of the AKT signaling pathway, as corroborated by the finding that AKT activation led to reduced expression of GSK3-β, ultimately reducing tau phosphorylation. Therefore, the current findings provide pertinent insights supporting PTEN as a promising molecular target for intervention, given its notable impact on enhancing neurogenesis and adult neuritogenesis. These results may contribute with valuable information for the formulation of novel and promising treatment modalities for individuals with neurodegenerative diseases.
Footnotes
Acknowledgments
The authors are grateful to Luiz A. Costa Junior for technical assistance. The financial support provided by The São Paulo Research Foundation (FAPESP), National Council for Scientific and Technological Development (CNPq, Brazil), and Coordination for the Improvement of Higher Education Personnel (CAPES, Brazil) is also acknowledged.
Author contributions
Funding
The authors disclosed receipt of the following financial support for the research, authorship, and/or publication of this article: This research was funded by the Fundação de Amparo à Pesquisa do Estado de São Paulo (FAPESP, Proc. 2018/21709-1), Conselho Nacional de Desenvolvimento Científico e Tecnológico (CNPq, Proc. 309854/2017-2, Proc.311533/2021-3 and Proc.142096/2019-9), and Coordenação de Aperfeiçoamento de Pessoal de Nível Superior—Brasil (CAPES)—Finance Code Consent for Publication 001.
ORCID iDs

Declaration of conflicting interests
The authors declared no potential conflicts of interest with respect to the research, authorship, and/or publication of this article.
Data availability statement
The data supporting the findings of this study are available on reasonable request from the corresponding author.