
Abstract
Background:
Homocysteine, a methionine metabolite, is a recognized risk factor for accelerated age-related cognitive decline and dementia.
Objective:
In the light of studies indicating increases in brain activity and brain functional connectivity in the early stages of age-related cognitive decline, we undertook a study to examine the relationship between plasma homocysteine levels and brain functional connectivity in a group of late middle-aged males at risk of cognitive decline due to high body mass index and a sedentary lifestyle.
Methods:
Brain functional connectivity was measured using the steady state visual evoked potential event related partial coherence while 38 participants performed a memory task where each trial comprised an object recognition task followed by a location memory task.
Results:
We observed a significant transient peak in the correlation between plasma homocysteine levels and fronto-parietal brain functional connectivity immediately before the presentation of the memory location component of the task. Significantly, this correlation was only apparent if the participant pool included individuals with homocysteine concentrations above 11μmole/L.
Conclusion:
Our findings suggest that the increased brain functional connectivity observed in the earlier stages of age-related cognitive decline reflects pathognomonic changes in brain function and not compensatory changes engaged to enhance task performance. Our findings also suggest that homocysteine interferes with the inhibition of cortical networks where this inhibition is necessary for optimum task performance. Finally, we observed that the effect of homocysteine on brain functional connectivity is only apparent at concentrations above 11μmol/L.
INTRODUCTION
Alzheimer’s disease (AD) and its prodrome mild cognitive impairment (MCI) are currently the most common examples of age-related cognitive impairment [1], with deficits in memory constituting the most common symptom in those so diagnosed [2, 3]. Neuroimaging studies indicate that while late-stage AD is characterized by reduced brain activity and functional connectivity, especially in the temporal and frontal cortices, earlier stages of AD and MCI are associated with a more complex pattern [4].
One of the earlier reports of early-stage changes described brain activity in individuals genetically at increased risk of AD, examined brain activation during a memory learning and recall task, in two groups matched for age and cognitive status. The groups differed by APOE status, with groups being homozygous for the APOE3 allele or either heterozygous or homozygous for the APOE4, the latter being associated with greater risk of developing AD earlier and with a more rapid decline. While memory performance did not differ between the groups, the APOE4 allele group exhibited greater activity in the hippocampal, parietal, and prefrontal regions. Furthermore, the increased level of activity in the APOE4 group was correlated with the rate of cognitive decline over the subsequent two years [5].
Further fMRI brain imaging studies of age-related cognitive deficits have revealed broadly consistent findings of increased brain activity and brain functional connectivity (FC) during cognitive tasks in subjects diagnosed with AD, MCI or those at an increased genetic risk of age-related cognitive decline when compared with age matched controls. This is most prominent in the default mode network (DMN) and hippocampus during a memory retrieval task with higher hippocampal activity being associated with poorer cognitive task performance [5, 6]. Electroencephalography (EEG) and magnetoencephalography studies have also reported increased frontal and temporal FC in participants diagnosed with either MCI or AD or their asymptomatic relatives when compared with normal controls [7–9].
Long-term changes in FC appear to be associated with specific cognitive phenotypes in the development of MCI and AD. Specifically, increased FC is observed in early preclinical stages of compromised cognition associated with subjective cognitive impairment (SCI) [10, 11] with this trend reversing during the transition from MCI to AD where a reduction in FC occurs, albeit from a higher value [12]. While some researchers speculate that the increased activity and FC in SCI and MCI may represent a compensatory process to partially offset compromised cognitive capacity [9, 13], others have suggested that the increased activity and FC are a direct manifestation of the neuropathological processes mediating MCI and AD [9, 14].
Apart from age and the APOE4 genotype, the metabolite homocysteine represents a significant risk factor for the development of MCI and AD [15, 16]. Elevated plasma homocysteine (tHcy) levels are associated with accelerated brain shrinkage and cognitive decline [16, 17], especially in advanced age [18], and are implicated in the etiology of dementia [16, 19]. Based on the studies reviewed in an international consensus statement on tHcy and dementia [16], it has been suggested that the threshold tHcy level above which brain shrinkage and cognitive decline are apparent in the aged brain is approximately 11.3μmol/L.
Homocysteine is a potentially toxic metabolite generated by cellular folate and methionine cycles. It is effectively downregulated by optimal levels of folate and vitamins B6 and B12 operating synergistically with other B vitamins [20]. Elevated tHcy levels are also a risk factor for a number of systemic disorders including cardiometabolic diseases [21] as well as being associated with the canonical markers of dementia, namely tau tangles and amyloid plaques [22, 23].
Importantly for the current study, there is a strong relationship between systemic and central tHcy levels such that plasma and central levels are highly correlated [24]. Elevated plasma tHcy is an independent marker of brain infarcts and atrophy [25, 26]. All these pathological processes are observed, to a lesser degree, in non-clinical cognitive senescence, raising the possibility that higher tHcy levels may be involved in poorer cognitive performance in non-clinical populations. Indeed, deterioration of long-term memory performance is one of the most common cognitive deficits associated with elevated tHcy in healthy older cohorts [27, 28].
Other studies have examined the link between dietary factors and FC [29], with higher plasma tHcy levels being associated with lower grey matter volume, larger ventricular volume and increased white matter hyperintensities [30]. Unsurprisingly, B vitamin plasma levels are lower in patients diagnosed with dementia and those at risk of cognitive decline [31, 32].
One approach to understanding the neural mechanisms of age-related cognitive dysfunction is to study them in middle-aged cohorts who are at risk of accelerated cognitive decline [33]. Thus, in the current study, we investigated the relationship between FC, tHcy and cognitive performance in a group of cognitively intact males who are considered at risk of cognitive decline due to their sedentary lifestyle and high body mass index [34]. Brain FC was estimated using the steady state event related visual evoked potential partial coherence (SSVEP-ERPC) while participants performed a location memory retrieval task.
Our choice of the SSVEP-ERPC methodology was based on several factors. Firstly, unlike fMRI the methodology offers high temporal resolution estimates of brain FC enabling one to identify cognitive task components associated with specific FC changes [35]. In addition, The SSVEP-ERPC is highly resistant to the most common sources of EEG noise and artifacts [36]. Finally, the methodology has been found to be especially sensitive to both FC changes associated with cognitive processes as well FC correlates of neurocognitive disorders such as attention deficit hyperactivity disorder [37].
The design of the task used in this study enabled us to estimate FC for the trials where location was correctly recalled (correct trials, FCc) and FC for the trials where the location was not correctly recalled (incorrect trials, FCi). If we assume that unsuccessful trials are indicative of poorer cognition, then we would expect FC during such incorrect trials (FCi) to be larger than that during correct trials (FCc). Given the reviewed studies pointing to higher FC being associated with more compromised cognition, we would expect higher individual performance on the memory task to be associated with lower FC. Furthermore, we would expect higher tHcy levels to be associated with larger values of functional connectivity during the incorrect trials (FCi).
Based on the above, we hypothesized that: 1) Individual FC measured during incorrect trials (FCi) would be larger than FC measured during correct trials (FCc); 2) Plasma tHcy levels would be positively correlated with FC recorded during the incorrect trials (FCi); 3) Individual performance levels on the memory task will be negatively correlated with FC.
MATERIALS AND METHODS
Swinburne University of Technology Human Research Ethics Committee approved this study as approval number 03/35 and the conduct of the study was performed in accordance with the relevant guidelines and regulations.
Participants
Participants were recruited from the general public through newspaper advertisements and Swinburne University notice board pamphlets. Participants comprised 38 at-risk males due to high body mass index (BMI) and sedentary lifestyle. These were selected according to the following inclusion and exclusion criteria.
Inclusion criteria include: age, 50–65 years; BMI, greater than 25; health, assessed by general practice physician as in good health; exercise, does not exercise regularly; handedness, right-handed; non-smoker.
Exclusion criteria: regular consumption of vitamin or herbal supplements; epilepsy or any other neurological disorder.
Assessments
All cognitive tests and brain electrical activity recordings were conducted at the Brain Sciences Institute, Swinburne University of Technology.
Participants were asked to abstain from alcohol for 24 h prior and tea or coffee for 2 h prior to their scheduled brain activity recording session.
Homocysteine and other blood parameters were assessed from fasting blood sample collected and analyzed by Melbourne Pathology Pty Ltd. Plasma homocysteine levels were assayed using the Abbott AxSYM Homocysteine assay (Fluorescence Polarization Immunoassay) with EDTA as the anticoagulant.
Participant details are included in Table 1.
Participant details
Task
Participants performed a retrieval memory task and the findings reported are restricted to data recorded during the retrieval memory task. Prior to the retrieval memory task, participants engaged in a memory encoding task where they passively viewed a series of images of everyday objects, each presented on a video screen for 3.0 s. Each object was in one of four locations (left, right, top, and bottom) near the viewing area boundaries. After a period of approximately 2 min, participants performed a retrieval memory task where they saw an object presented twice, each for a duration of 2.5 s as illustrated in Fig. 1 (Retrieval). During the first 2.5-s interval of each trial, they were required to indicate whether the object had been viewed in the encoding task by pressing one of two buttons (Yes or No). During the second 2.5-s interval of each trial, participants were required to indicate the location of the previously viewed object by pressing a button corresponding to one of four possible locations (left, right, top, bottom). At the end of each 2.5-s image presentation interval, the object was replaced with a 0.5-s fixation cross. The entire duration of the task was 282 s.
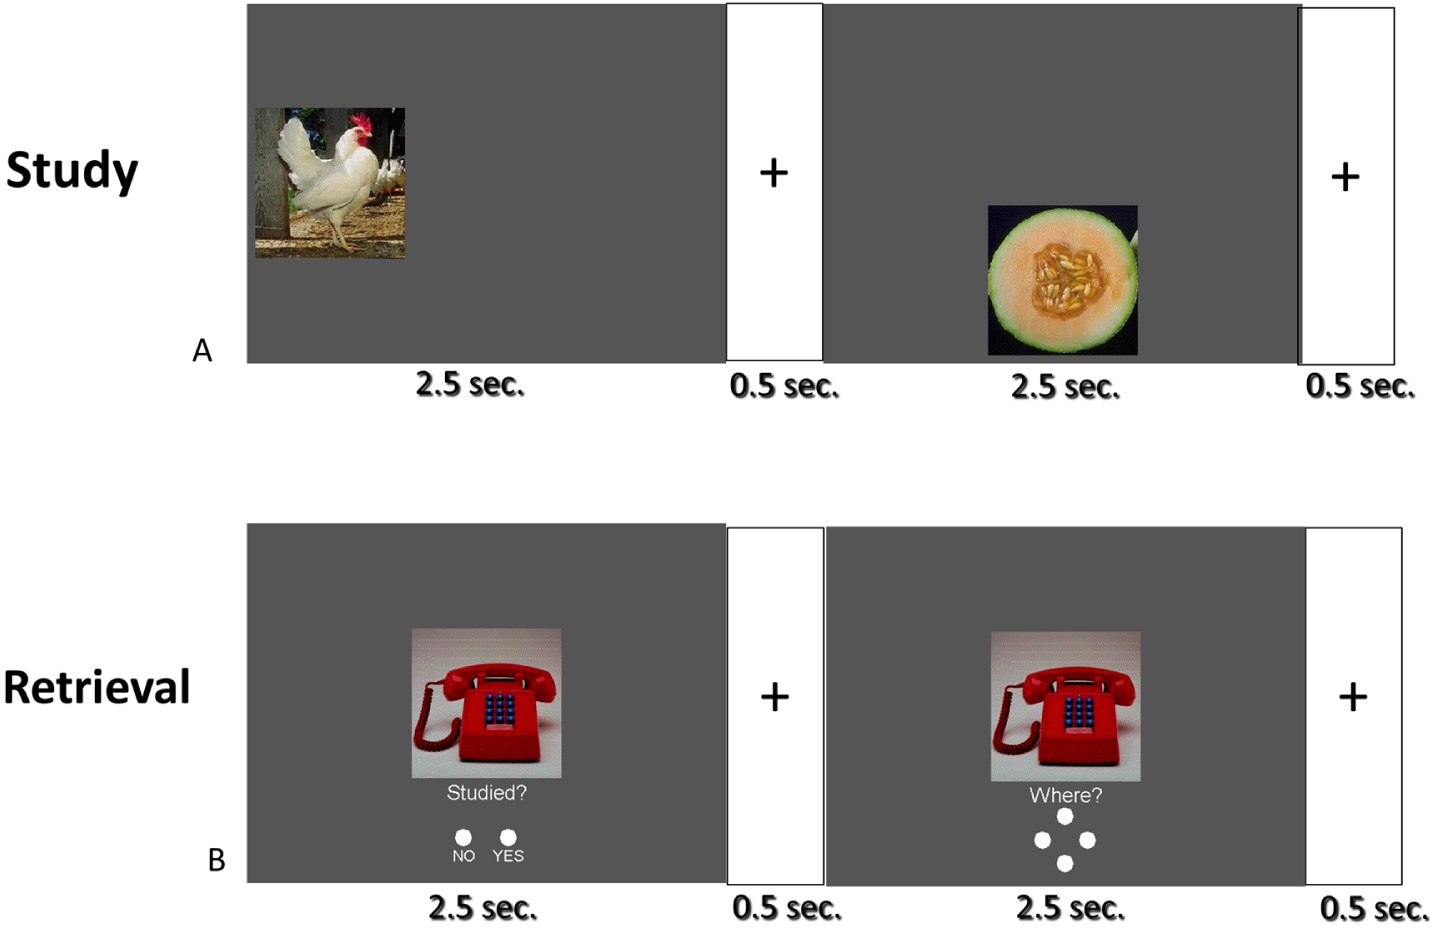
Each participant undertook a ‘Study’ task (A) where they passively observed images of everyday objects presented in one of four locations on the screen (top, bottom, left, and right). Subsequently they undertook the Retrieval task (B) where an object was presented in the middle of the screen and participants indicated whether the object had been seen in the earlier ‘study’ task. In the second 2.5-s epoch of the Retrieval task, participants had to indicate the original location of any object they recognized seeing in the Study task. The current paper presents results obtained in the Retrieval task.
All objects were presented at the center of the monitor and subtended a horizontal and vertical angle of approximately 4.5° when viewed by subjects from a fixed distance of 1.3 m.
Participants viewed the task through goggles that superimposed a spatially diffuse 13 Hz sinusoidal flicker over the visual field. The modulation depth of the visual flicker was 45%, and it subtended a horizontal angle of 160° and a vertical angle of 90°. This flicker was present throughout the task and special goggles enabled subjects to view the cognitive task and the sinusoidal flicker simultaneously.
Brain electrical activity was recorded from 64 scalp sites with details of the recording sites and signal processing to derive the 13 Hz Steady State Visually Evoked Potential (SSVEP) previously described [35]. In the current study, the temporal resolution of the SSVEP was 0.77 s (10 stimulus cycles at 13 Hz) and this was evaluated over a 280-s epoch of activity synchronized with the start of each memory retrieval trial.
Functional connectivity measure
Functional connectivity (FC) was determined from the Steady State Visual Evoked Potential Partial Coherence (SSVEP-ERPC). The SSVEP-ERPC is based on an event related coherence methodology first described in [38] and subsequently modified to for application with the SSVEP [35, 39]. Electrode pairs with high SSVEP-ERPC indicate stable SSVEP phase differences or synchronization between electrode pairs across trials and is considered to reflect functional connectivity between the regions and we will use the terms SSVE-ERPC and FC interchangeably [39].
For each subject, FC was calculated for the 6-s epochs following the start of each trial. FC was calculated for all 2016 distinct electrodes pairs for all trials where participants correctly identified the object as one previously studied irrespective of whether the correctly or incorrectly identified the position of the object when viewed in the study phase. In addition, FC was separately calculated for cases where participants correctly recalled the object location (correct location) and where they failed to recall the location (incorrect location).
Statistical considerations
To examine the difference in FC for the ‘incorrect location’ trials compared to the ‘correct location’ trials, we conducted Student’s t-test comparing FC for incorrect trials (FCi) compared to FC for correct trials (FCc), that is (FCi-FCc). This was repeated for each point in time and all 2016 electrode pairs.
The number of electrode pairs where the magnitude of Student’s-t |t| is equal to or exceeds a specified threshold level was then determined. Graphs illustrating the time series of the number of electrode pairs where t≥threshold (positive deviations) are shown in red while the converse (negative deviation, -t≤-threshold) are shown in blue. We term such graphs Student’s t frequency curves (t-frequency curve).
The t-frequency curve was calculated using a threshold of |t|≥3.56 (n = 38) corresponding to p < 0.001 to identify which of the 2016 (64×63/2) electrode pairs where this threshold is exceeded at a specific point in time during the trial.
A permutation test first described in [40] was used to determine the statistical significance of the number of electrode pairs exceeding the positive and negative t-test threshold values. Details of the permutation test are described in [37]. It should be noted that the permutation test accounts for both the correlations between FC measurements at electrode pairs as well as the multiple comparisons calculated for each point in time [37]. A Bonferroni correction is applied when the permutation test is applied at more than one point in time. In addition to the t-frequency curve illustrated in Fig. 2, the topographic distribution of FC measures exceeding the |t| are also illustrated as line diagrams.
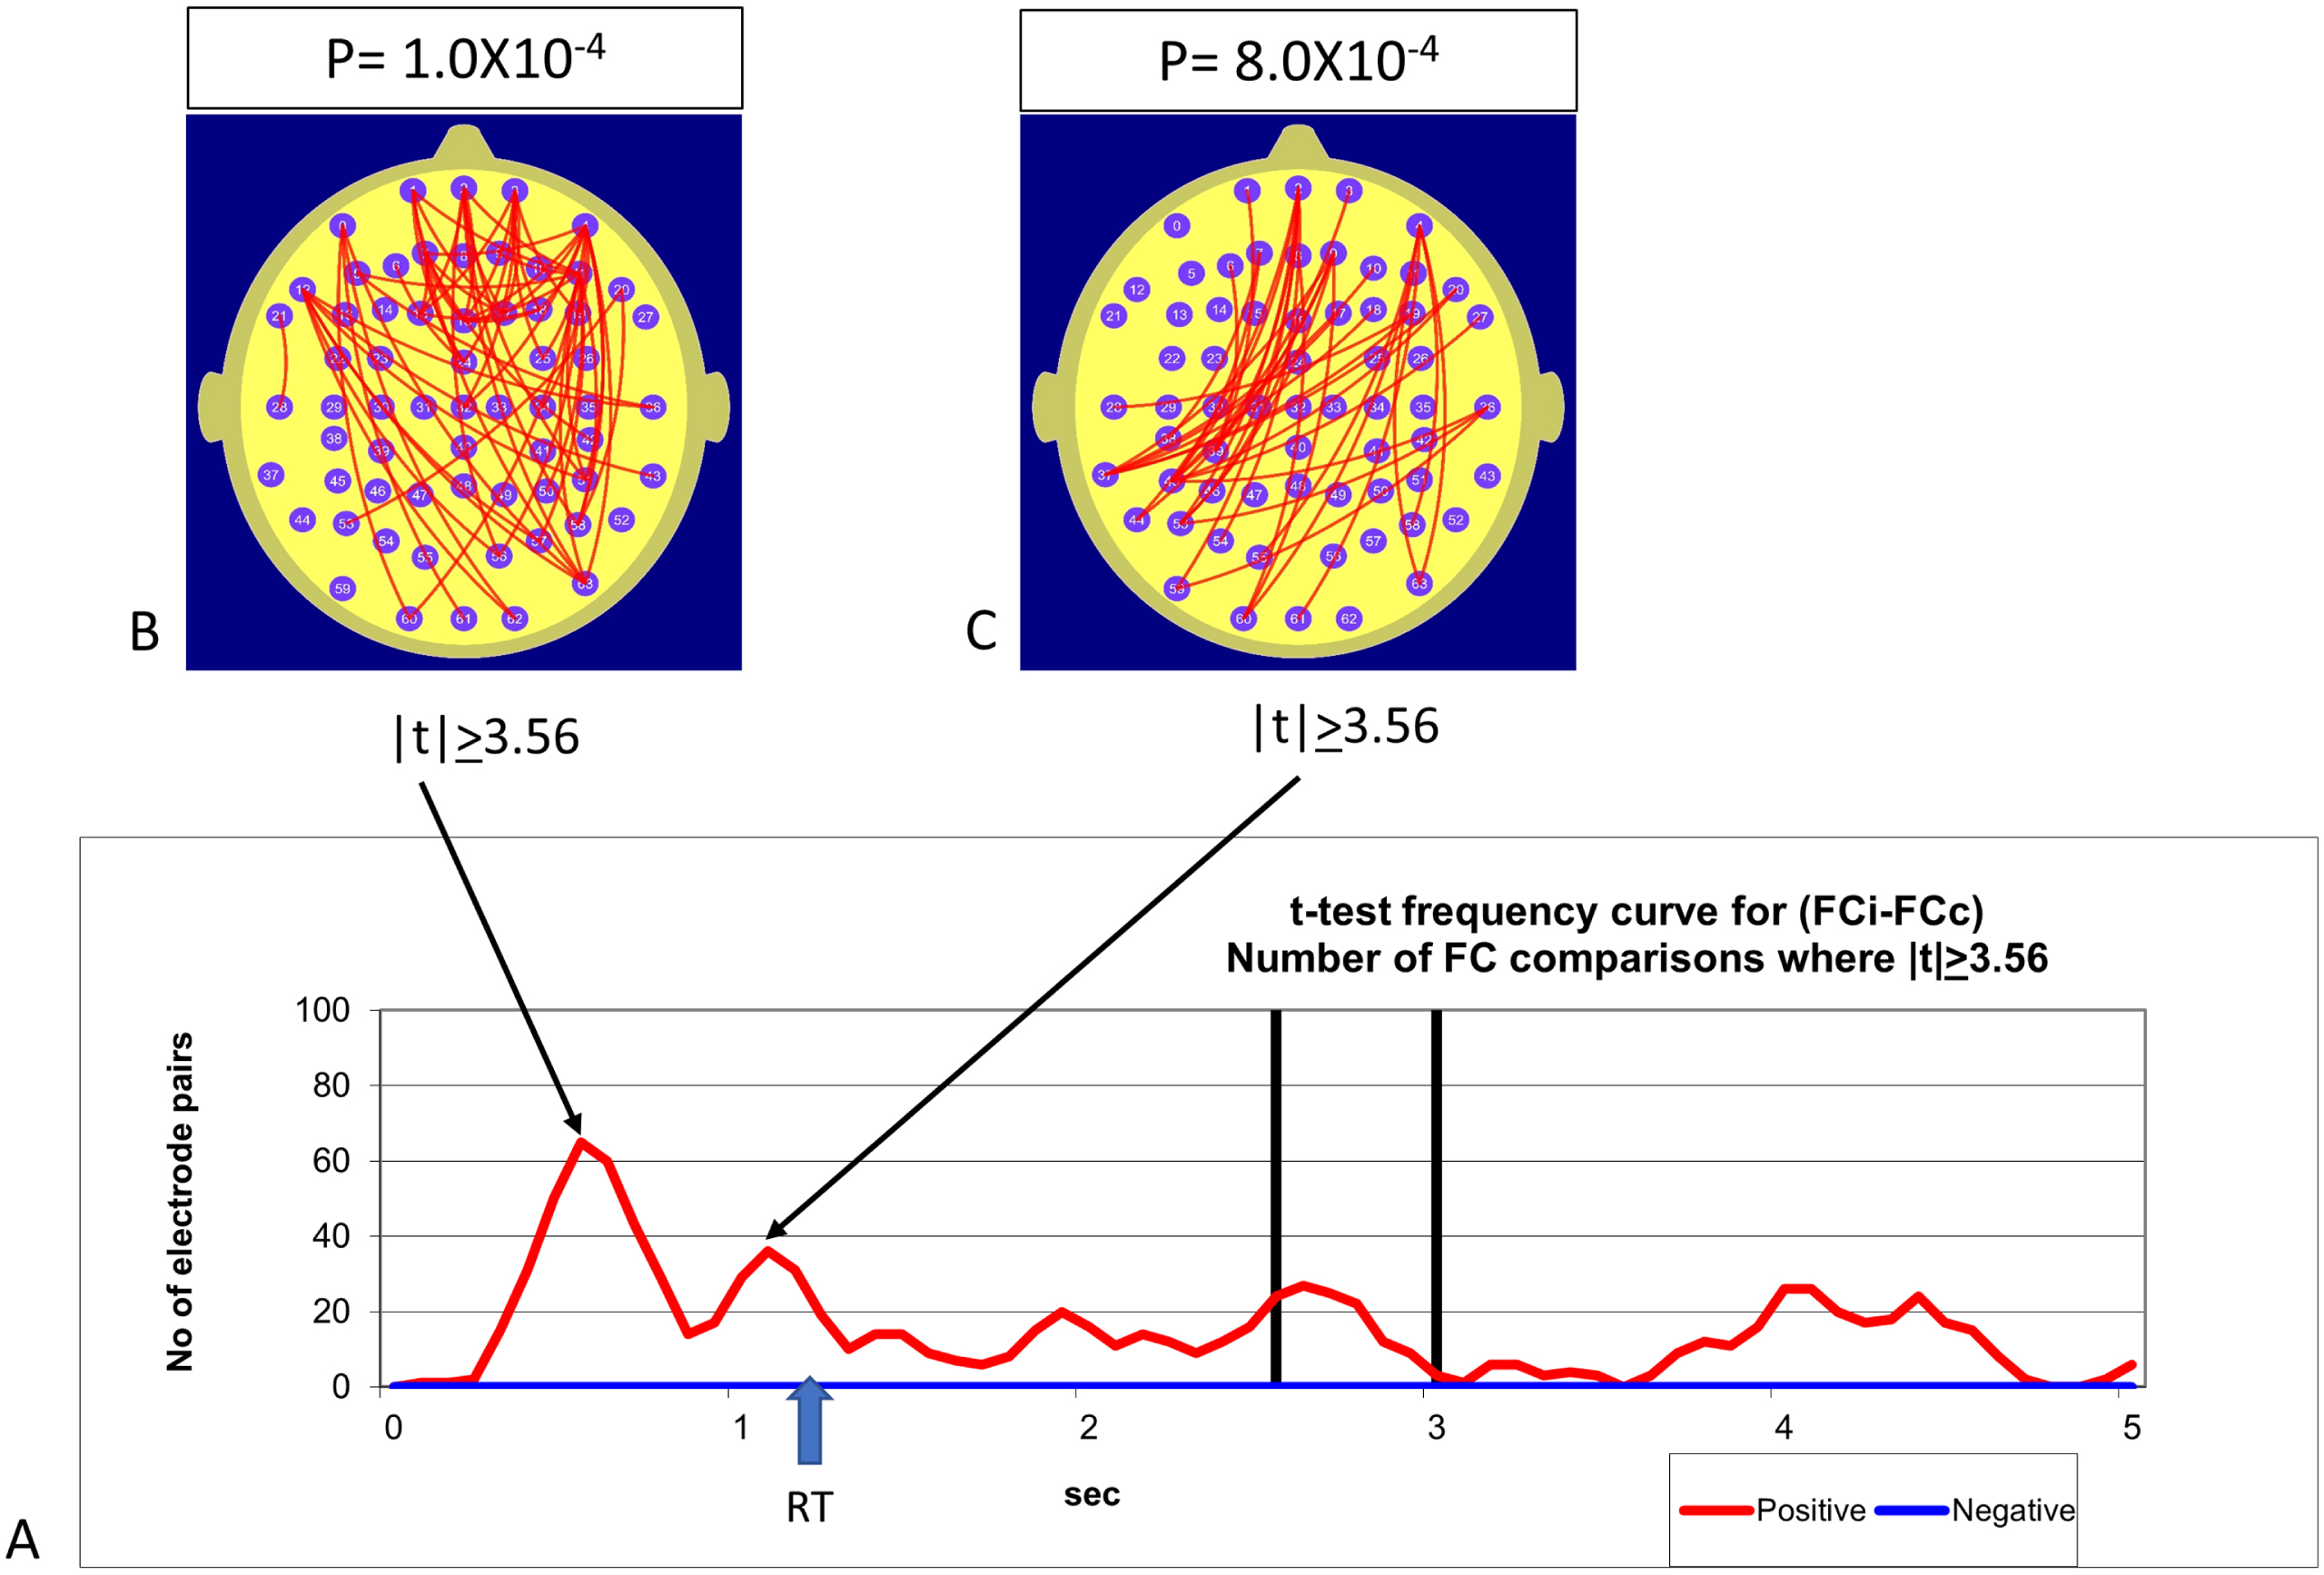
Panel A illustrates the number of FC measurements that differed significantly between trials where location was correctly identified in the trial (FCc) compared to trials where location was incorrectly identified (FCi). The red and blue lines represent the t-frequency curves illustrating the number of FC measurements where the one sample t-test comparing functional connectivity for incorrect trials (FCi) with the equivalent for correct trials (FCc), i.e., (FCi-FCc) met the threshold condition of |t|>3.56. The red trace indicates the number of FC measurements where the condition of t > 3.56 was met (FCi is greater than FCc) while the blue trace illustrate the equivalent for the condition -t< –3.56 (FCi is less than FCc). Panels B and C illustrate the topographic distribution of the FC measurements where the t-frequency curve exhibited the largest value in the first 5-s epoch of each trial. Functional connectivity during the incorrect trials is significantly larger than during the correct trials. The probability of observing this number of FC differences meeting the t-threshold by chance is calculated using the permutation test and is indicated above the maps Fig. 2B and 2C. This effect remains significant after applying a Bonferroni correction for the two points in time (Fig. 2B, C). Frontoparietal FC levels during incorrect trials are consistently larger than during the correct trials and this effect is time dependent and exhibits two peaks prior to the mean response time for the Studied question.
At each point in time in the trial, a linear correlation measure was used to examine the relationship between the 2016 FC measures and task accuracy (Acc) or the FC measures and plasma homocysteine concentration tHcy. Time series illustrating the number of electrode pairs where the magnitude of FC correlation with Acc or tHcy exceed a nominated threshold |r| are termed correlation frequency curves. In the current study, the |r| threshold for both sets of correlations is set at |r|≥0.513, corresponding to p < 0.001 dF = 36. Figs. 3 and 4 illustrate the correlation frequency curves for FC and tHcy (Fig. 3) and FC and Acc (Fig. 4). In both Figs. 3 and 4, the topographic distribution of FC measures exceeding the |r| threshold is illustrated. As with the Student’s t-frequency curve, a permutation test was used to determine the statistical significance of the number of correlations between FC and individual values that exceeded the r-threshold value of |r| = 0.513. As noted previously, this estimation of statistical significance accounts for the correlation between FC measures as well as the multiple comparisons.
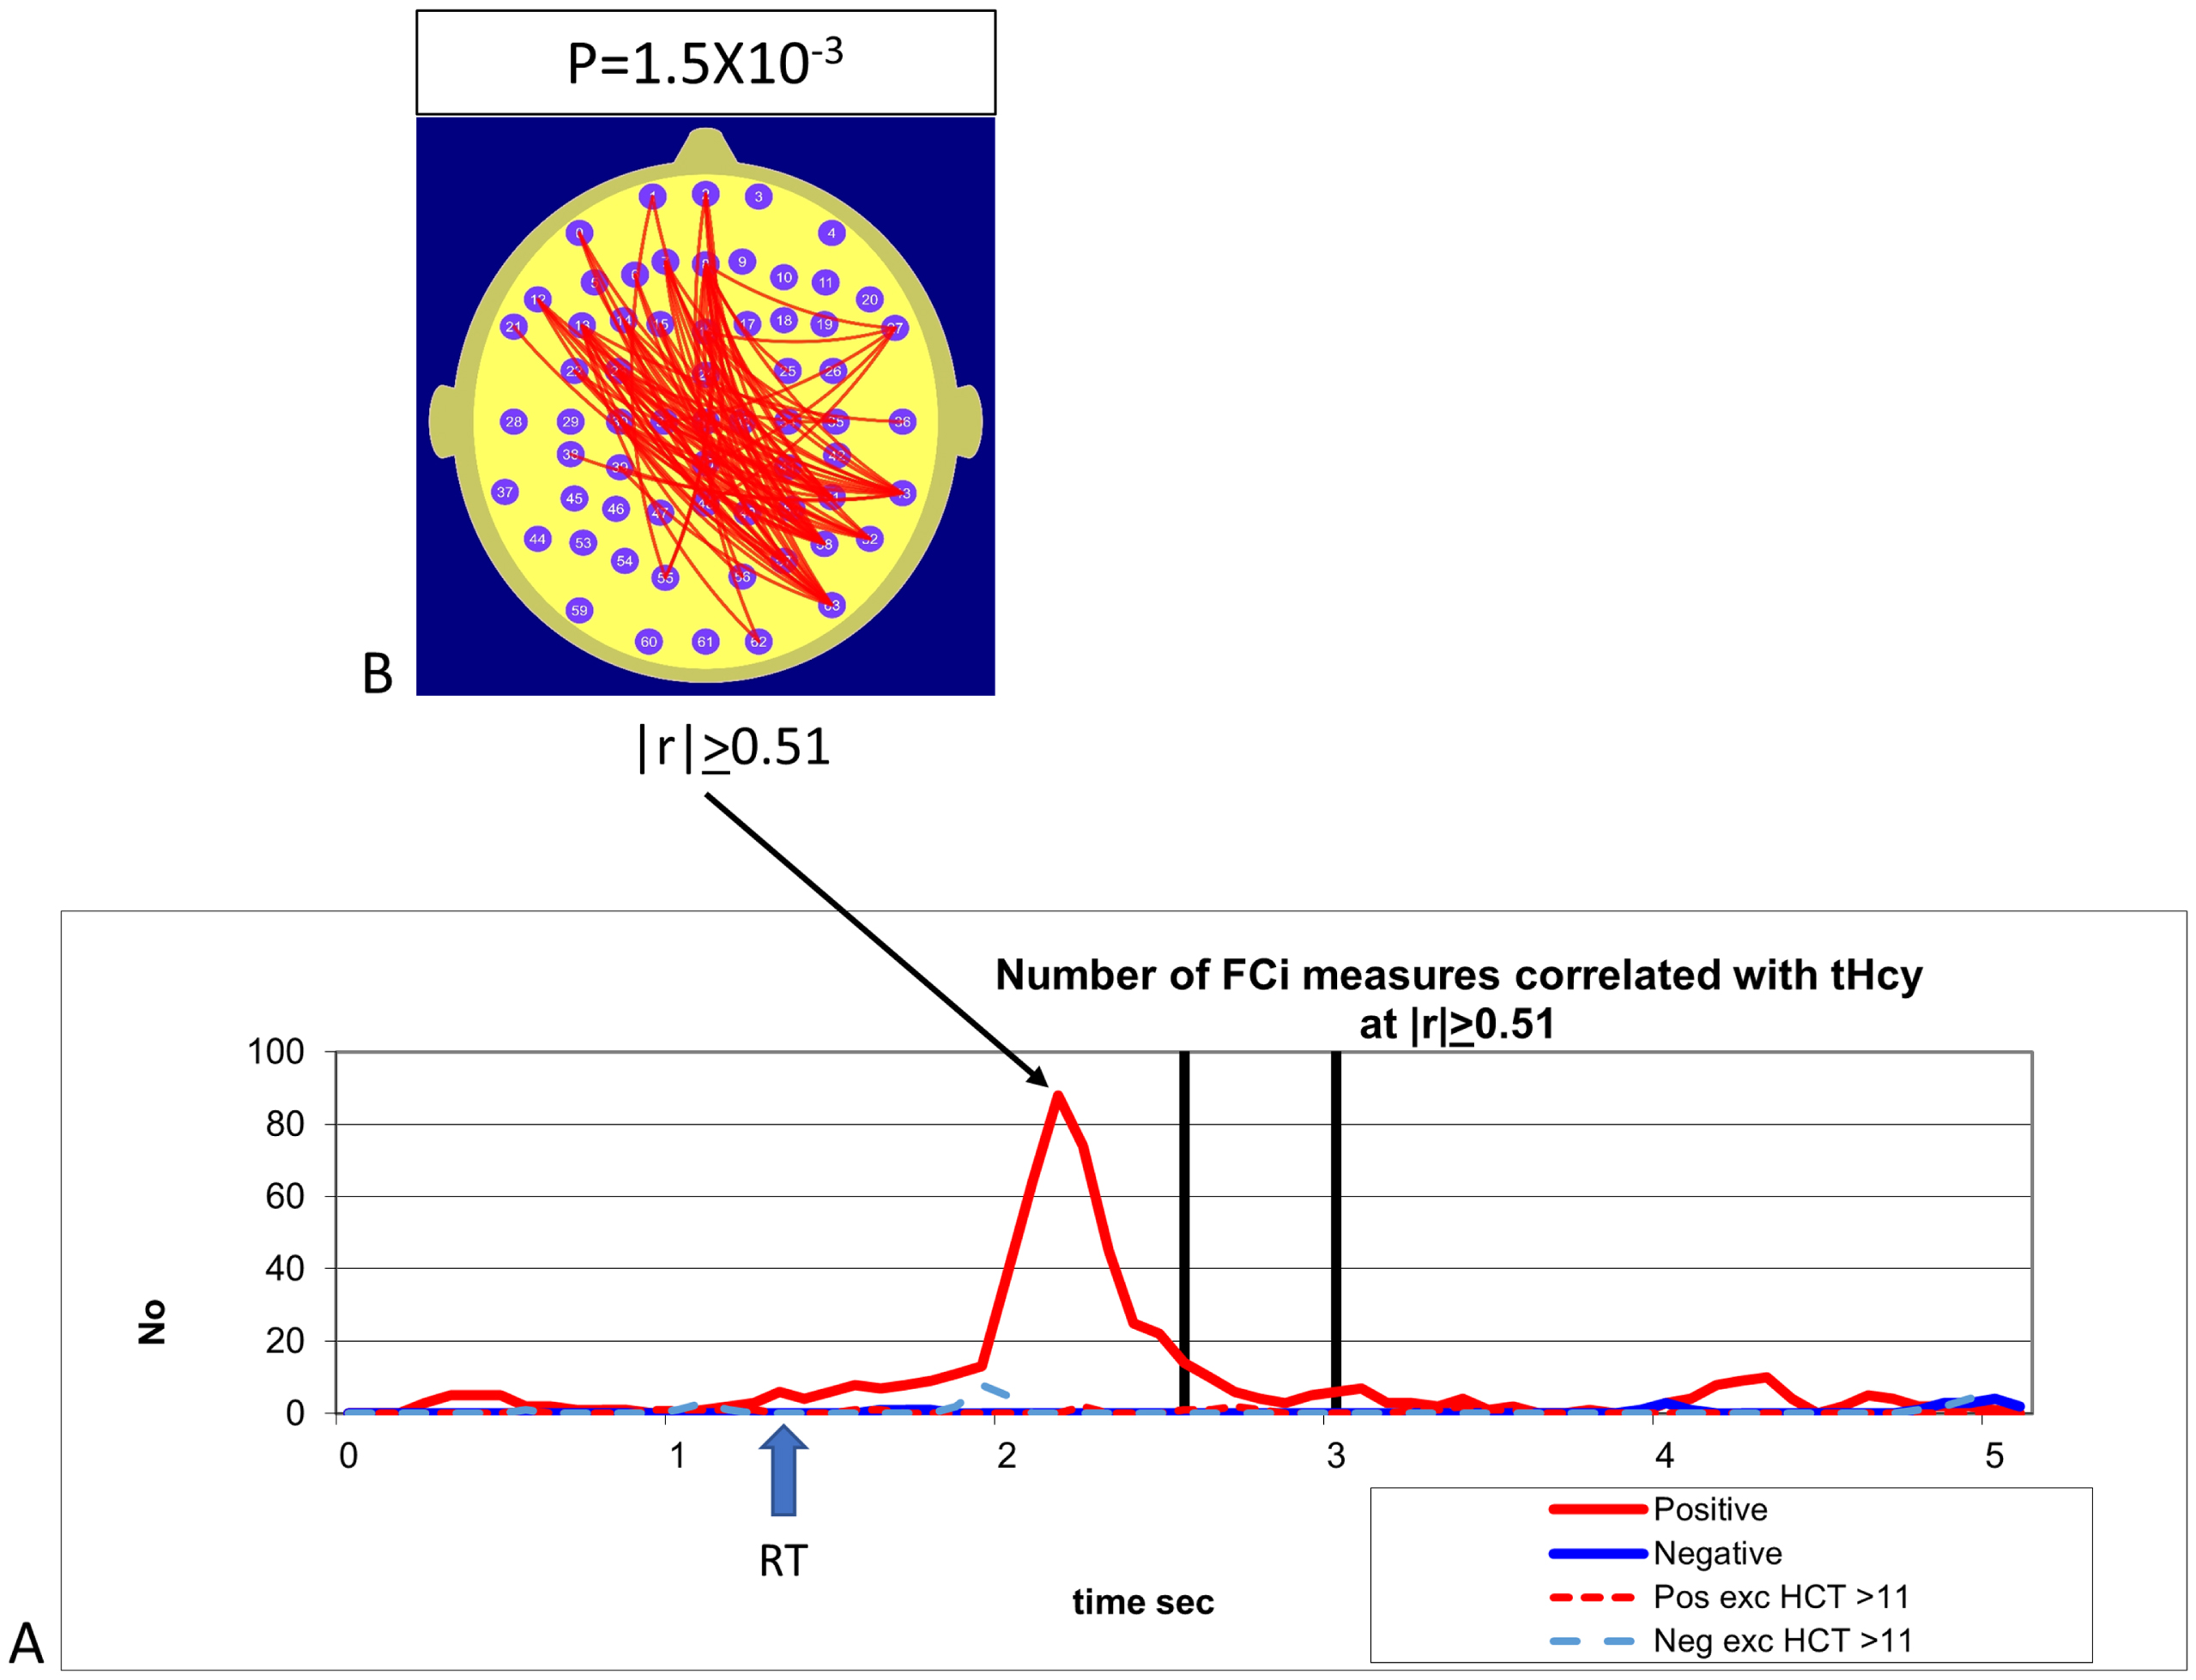
A) The plots illustrate the correlation frequency curves for the number of FC measures during incorrect trials (FCi) that were correlated with tHcy at the level |r|>0.51. The red trace indicates the number of FCi measurements satisfying the condition r > 0.51 while the blue trace indicates the equivalent for –r< –0.51. The solid red and blue lines illustrate the correlation frequency curve for all participants while the red and blue dashed lines illustrate the equivalent correlation for the subgroup of 33 participants with [tHcy] <12 umole/L. The correlation between FCi and [tHcy] is highly time dependent and peaks approximately 2.2 s after the start of the trial. Panel B illustrates the topography of the FCi components positively correlated with [tHcy] (red lines) and those negatively correlated are illustrated with blue lines. The FCi components correlated with [tHcy] are predominantly right parietal to left frontal. The probability of observing this number of correlated FCi measures is indicated above the map.
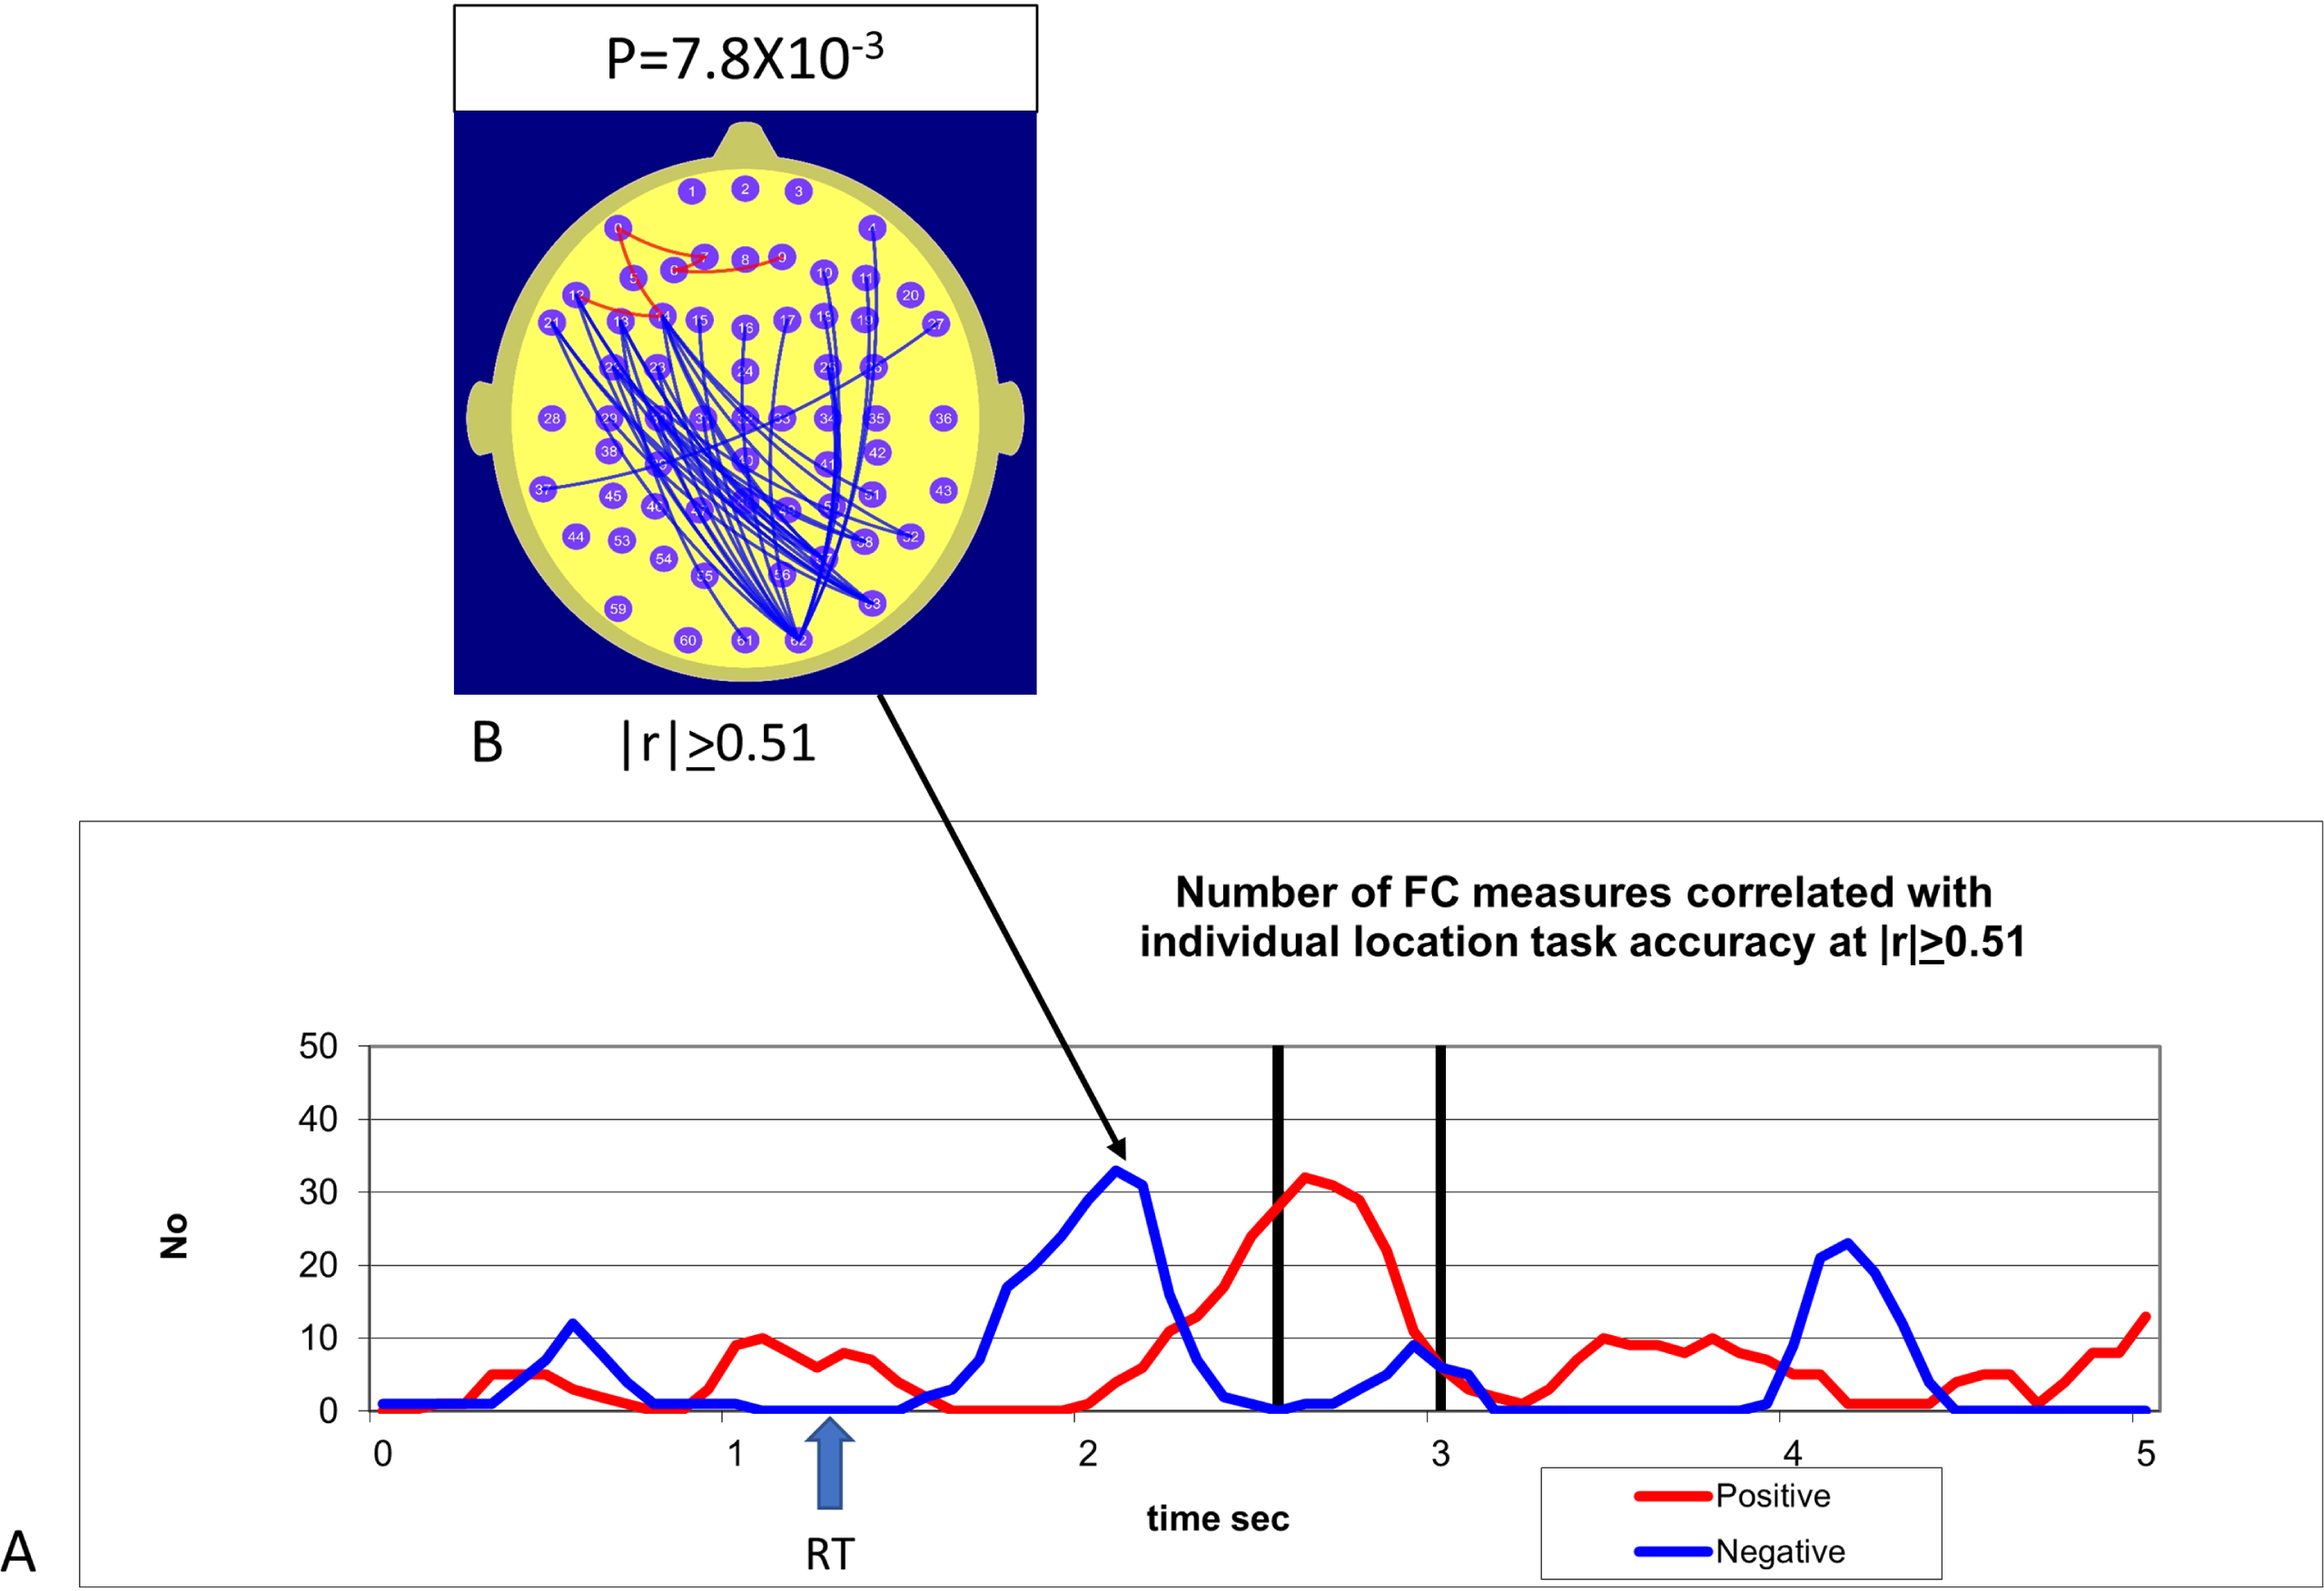
A) Correlation frequency curves illustrating the number of FC measures correlated with individual accuracy (Acc) on the location recognition component of the task. Red trace illustrates the number of FC components positively correlated with Acc at r > 0.51, while the blue trace indicates the number satisfying the condition –r < –0.51. Panel B illustrates the topography of the FC components correlated with individual accuracy Acc for the point in time 2.2 s from the start of the trial. The red lines in the maps illustrate FC components positively correlated with Acc at the 2.2-s point in time while the blue lines illustrate the equivalent for the FC components negatively correlated with Acc. Location task accuracy is associated with a negative correlation between right parietal and left frontal sites.
RESULTS
Behavioral findings
The Pearson’s correlation between tHcy and task accuracy in identifying location is r = –0.12, p > 0.1, NS. In other words, there was no statistically significant relationship between tHcy levels and individual accuracy in recalling the location of previously viewed images.
Functional connectivity findings
A comparison of FC during trials where the location was not correctly identified (FCi) compared to those where location was correctly identified (FCc) indicated that FCi was robustly larger than FCc. During the initial 2.5-s epoch, the strongest effect was higher frontoparietal FC in the incorrect trials compared to the correct trials. These effects peaked approximately 0.5 s and 1.2 s after the object appears on the screen.
Homocysteine was robustly positively correlated with FCi and this effect peaked approximately 800 ms after the mean reaction time for the response to the first question (Fig. 2). One feature of the tHcy data we investigated further was the extent that tHcy-FCi correlation may have been driven more strongly by those participants with tHcy levels above the threshold level of 11μmole/L nominated in the International Consensus Statement [20].
Our approach was to recalculate the tHcy-FCi correlation after excluding all participants with tHcy levels above the 11μmole/L threshold level. After excluding the 5 subjects out of the 38 with tHcy >11μmole/L, the number of FCi measures where tHcy-FCi correlation exceeded r = 0.51 dropped from the 88 for the pool of all subjects to just 2 for the pool of subjects where tHcy <11μmole/L. The tHcy-FCi correlation for the participants with tHcy levels less than 11μmole/L was not statistically significant.
The correlation between individual accuracy in the location identification component of the task reveals significant correlations between FC and accuracy during the first 2.5 s of the task. During this interval, the largest effect revealed in the individual accuracy-FC correlation is a negative correlation between individual accuracy and right parieto-occipital to left frontal FC peaking approximately 2.2 s after the presentation of each trial. Interestingly, this negative correlation suggesting higher accuracy is associated with lower right occipito-parietal to left frontal FC that peaks at 2.2 s after the initial image presentation peaks coincides with the time that the positive correlation between tHcy and right occipito-parietal to left frontal FC also peaks.
DISCUSSION
Functional connectivity correlates of correct and incorrect trials
Consistent with hypothesis 1, we observed a robust increase in FC when comparing trials where the location of previously seen objects was not correctly identified (incorrect trials) compared with those where location was correctly identified (correct trials). Our observation of larger FC in the incorrect trials may be viewed in the context of the two major interpretations of the increased brain activity and FC in mild cognitive impairment and the early stages of AD dementia (outlined in the Introduction). One interpretation is that the increased brain activity and FC constitute compensatory increases that are necessary for compromised neural systems to perform the cognitive tasks under consideration [5, 42]. The other interpretation is that these features are pathognomonic manifestations of the long-term pathological processes leading to the diagnosis of MCI and eventually AD [10, 43].
Regarding our findings, if the increased activity and FC were to represent compensatory processes engaged to perform the cognitive task, then we would expect that such increases would be associated with improved performance and hence more likely during successful trials. However, our results clearly indicate that increased FC in this ‘at-risk’ cohort is associated with lower performance. This is consistent with suggestions that increased FC is a pathogenic indicator of increased risk of age-related cognitive impairment rather than an indication of compensatory processes.
Homocysteine effects
We observed a robust correlation between tHcy plasma levels and incorrect trial FC (FCi) during the task. Thus, while we consider hypothesis 2 confirmed, our findings indicate that the correlation between tHcy and FCi is apparent only in participants with tHcy levels above the threshold level of 11μmol/L. Excluding participants with suprathreshold tHcy levels reduced the tHcy-FCi correlation to a statistically non-significant level. Our observation of a threshold tHcy level of 11μmol/L is consistent with findings of suprathreshold tHcy levels being associated with regional brain atrophy and cognitive impairment [16, 17]. Our findings thus lend support to the Consensus Statement that tHcy values above 11.0μmol/L are associated with an increased risk of age-related cognitive decline [16].
While the direction of the correlation between tHcy levels and FC supports a direct or indirect effect of tHcy on FC, the time-dependent variation in the strength of these correlations as well as the topography of the FC components offers additional insights into the effects of tHcy on the functional neural networks mediating the task.
The number of FC components positively correlated with plasma tHcy peaks approximately 2.2 s after the probe stimulus is (Fig. 3). As this peak in the correlation frequency curve occurs after participants have responded to the seen/novel question, suggesting that tHcy is having the maximum effect during the preparatory phase for the next question concerning the location of the previously seen object.
The possible functional significance of the timing and topography of FC components correlated with tHcy is suggested by Fig. 4 illustrating the correlation between FC and the individual performance levels on the location question. The most prominent effect in Fig. 4 is the negative correlation between the right parieto-left frontal FC and performance on the location question in the 1-s epoch before the presentation of the location question. Specifically, higher individual performance on the location question was associated with reduced frontoparietal FC in the 1-s interval before the appearance of the cross hair separating the seen/novel question from the location question. As such, we consider hypothesis 3 confirmed during the 1-s interval following the mean response time for the new/studies question.
We suggest that this finding represents a preparatory inhibition of the FC components that may interfere with task performance. It is interesting to note that the point in time where the correlation between tHcy and FC peaks (Fig. 3) is precisely at the same point in time that individual accuracy correlates with reduced frontoparietal FC (Fig. 4). This implies that increasing tHcy compromises individual performance by interfering with the frontoparietal FC networks that need to be inhibited in the 1-s interval before the location question for optimum performance on the location question. The significance of this frontoparietal FC network cannot be unequivocally determined given the relatively low spatial resolution of our FC data. However, we note that the frontoparietal FC components that are positively correlated with tHcy (Fig. 3) and negatively correlated with task performance (Fig. 4), respectively, are similar to a frontoparietal component exhibiting DMN behavior that we have reported in previous studies [37]. In those studies, we observed a frontoparietal FC component exhibiting DMN behavior that was attenuated when participants performed a high demand compared to a low demand visual vigilance task. This topographic similarity between the features of the frontoparietal FC component in the current study and those in the previous studies that exhibited DMN behavior suggests that the frontoparietal components observed in the current study may also reflect DMN activity. Our suggestion that the behavior of the frontoparietal FC component we have observed in this study may reflect DMN activity is supported by findings presented in a recent review of the roles of the frontoparietal control network (FPCN) and DMN during mind wandering [44]. Specifically, the review indicated that during periods of mind wandering the FPCN and DMN interacted and exhibited simultaneous coactivation. To the extent that a similar coactivation of the FPCN and DMN is present during the tasks in this study, then we feel justified in suggesting that the frontoparietal components observed in Figs. 3 and 4 may reflect DMN activity.
The possibility that the frontoparietal FC reflects DMN activity is thus consistent with the DMN being the performance interfering network mentioned above. If this is the case, then the robust positive correlation between tHcy and this frontoparietal FC component (Fig. 3) also suggests that tHcy interferes with the inhibition of the DMN during cognitive tasks.
Such compromised DMN inhibition will be seen most clearly at points in times when maximal DMN inhibition is required for optimum function of the task related networks [45]. Our findings are thus consistent with evidence pointing to increased brain activity and FC in age-related cognitive decline. Our findings are also consistent with the body of evidence pointing to increased DMN activity during cognitive tasks, especially in the early stages of age-related cognitive decline. Importantly, our findings indicate that these effects are most prominent when task performance requires inhibition of the DMN. Such task specificity may account for the inconsistency in some findings regarding brain functional connectivity in MCI. Studies involving the resting state may be less sensitive to inhibitory deficits of the DMN as this inhibition is only engaged during a cognitive task.
On a final note, we comment on two aspects of our findings. Firstly, we note the contrast between the relatively weak effects of tHcy on task performance and the strong effect of tHcy on measures of brain functional connectivity that we observed. This situation, where behavioral performance indicators of task or treatment effects appear weaker than the corresponding brain imaging measures of brain function is not unusual [5, 41]. This lends further credence to the notion that while behavioral measures can give a useful indication of cognitive measures, they are an imperfect indicator of brain function.
Study limitations and recommendation
Like most studies, this study suffers from several limitations. Most importantly, the number of participants is relatively small. Furthermore, our participant pool was restricted to males thus preventing any comparisons based on sex. Finally, we did not have access to the APOE status of the participants. We recommend a replication of this study based on a larger subject pool comprising both women and men with appropriate APOE genotyping. Based on our findings here we would predict that, like being sedentary and having elevated BMI, possessing the APOE4 allele would be associated with higher FC during task performance. A larger subject pool with tHcy levels extending well above and below the threshold level of 11μmol/L would also permit a more accurate assessment of the tHcy level that has a significant impact on brain functional connectivity. This may yield additional information that could be useful in establishing an upper tHcy limit consistent with healthy cognitive aging.
However, in considering a replication, it is important to consider the strengths and weaknesses of the neuroimaging methodology to be used and the way these features will influence the findings. For example, some of the changes we observed are relatively rapid and may not be apparent with fMRI given the relatively low temporal resolution of this neuroimaging methodology. Another point to note is that the 13 Hz SSVEP will be most sensitive to coherent cortical oscillations at or near this frequency. This is relevant as recent findings have demonstrated that feed-forward (bottom-up) and feed-back (top-down) intracortical communication utilize coherent oscillations at different frequency ranges. While bottom-up communication primarily utilizes the EEG gamma frequency oscillations (30 Hz–100 Hz), the top-down communication utilizes coherent oscillations in the EEG high alpha to low beta (10 Hz–20 Hz). As our stimulus frequency is in the top-down communication frequency range, our findings will be especially sensitive to top-down processes. [39, 46]
Conclusions
Our findings of increased FC in the trials where location was incorrectly identified is consistent with the view that the increased brain activity and brain functional connectivity observed in age-related cognitive decline is a pathognomonic indicator of the underlying disorder and not a compensatory process elicited by cognitive tasks. In addition, our findings suggest that tHcy levels above a threshold level of 11μmol/L is associated with compromised inhibition of those FC networks not required for the task execution such as the DMN and other networks functionally coupled to the DMN. Such compromised inhibition is also consistent with observations of increased brain activity and FC in age related cognitive decline such as MCI. As tHcy is a modifiable risk factor, our findings lend increased weight to the recommendations that lifestyle and dietary changes should be undertaken to maintain tHcy levels below the threshold that is consistent with healthy cognitive aging.