



Abstract
Background:
Obesity has been linked to cognitive impairment. However, how changes in body mass index (BMI) over the life course influence cognitive function remains unclear.
Objective:
The influence of distinct weight-change patterns from young adulthood to midlife and late adulthood on cognitive function in older adults was explored.
Methods:
A total of 5,809 individuals aged≥60 years were included and categorized into four groups on the basis of BMI change patterns. Cognitive function was assessed using four cognition tests in the baseline survey. The relationship between the weight-change patterns and cognition was evaluated using regression models.
Results:
In comparison with participants who remained at non-obese, those moving from the non-obese to obese weight-change pattern from young (25 years of age) to middle adulthood showed lower Digit Symbol Substitution Test (DSST) scores (β= –1.28; 95% confidence interval [CI]: –2.24 to –0.32). A non-obese to obese change pattern from age 25 years of age to 10 years before baseline was associated with a higher risk of DSST impairment (odds ratio = 1.40; 95% CI: 1.09 to 1.79). In comparison with participants whose heaviest weight was recorded after 60 years of age, those with the heaviest weight between 18 and 40 years of age had lower DSST scores (β= –1.46; 95% CI: –2.77 to –1.52).
Conclusion:
Our results suggest that the transition from the non-obese to obese category in early adulthood and appearance of the heaviest weight between 18 and 40 years of age are associated with lower cognitive function in later life.
INTRODUCTION
Dementia has emerged as a public health challenge. In 2015, approximately 47 million people worldwide were estimated to be living with dementia [1]. This number is projected to triple in 2050 [2], and the cost associated with the management of these patients is expected to be $1.89 trillion [3], underscoring the magnitude of the social and economic impact of this problem [4]. The elderly population is at risk of dementia owing to the absence of disease-modifying interventions [5, 6]; in this situation, modifiable cardiovascular risk factors such as adiposity have gained importance for prevention as well as intervention [6].
The worldwide prevalence of obesity has increased substantially over the last few decades, growing from less than 1% in 1975 to 6% –8% in 2016 [7]; obesity in children and adolescents has also increased at an alarming rate from 0.7% to 7.8% during this period, resulting in an increased proportion of overweight people [8]. A high body mass index (BMI) at a young age indicates longer periods of exposure to adiposity; thus, the length of exposure to adiposity may be important [9, 10].
Adiposity has been associated with dementia in previous studies [11–13]. However, reversed risk associations between overweight or obesity and dementia have also been reported [9, 15], which were hypothesized to stem from the reverse causality that BMI loss may be a sign of subclinical dementia [16, 17]. Since BMI is unlikely to remain stable and is easily influenced by many factors, such as diseases, diet, exercise, and mood, its effects on long-term health outcomes are likely to change over time. Therefore, in comparison with studies of weight or BMI at fixed time points, investigating weight changes may better describe the impact of weight on cognitive function.
For this purpose, we used data from the National Health and Nutrition Examination Survey (NHANES) (1999–2002, 2011–2014) to evaluate the relationship between cognitive function in older adults and weight-change patterns from young adulthood (25 years of age) to midlife (around 60 years of age) and late adulthood (around 70 years of age).
METHODS
Data sources
The NHANES is a nationally representative, continuous cross-sectional study designed to assess health and nutritional status of adults and children in the United States. Briefly, this survey contains information on demographic, socioeconomic, dietary, and health-related factors acquired through interviews; medical, dental, and physiological measurements; as well as laboratory tests administered and acquired by the examiners. We incorporated data on adult participants from four cycles of the NHANES, including the 1999–2000 (n = 1834), 2001–2002 (n = 1872), 2011–2012 (n = 1687), and 2013–2014 (n = 1785) phases, which specifically assessed cognitive performance in individuals aged 60 years and older.
The National Center for Health Statistics Research Ethics Review Board approved the NHANES protocol, and written informed consent was obtained prior to data collection.
Weight-change measures and covariates
Data on weight and height at 25 years of age and 10 years before the baseline survey and the age at maximum weight were recorded at the baseline survey. Baseline weight and height were measured during physical examinations. BMI at age 25 years of age (BMI25), at 10 years before the baseline survey (BMI10prior), and at the baseline survey (BMIbaseline) were calculated as weight (kg) divided by the square of height (m2). We categorized the participants into two groups: obese (BMI≥30 kg/m2) and non-obese (BMI < 30 kg/m2). Using BMI measurements obtained at three time intervals (BMI25 to BMI10prior, BMI10prior to BMIbaseline, and BMI25 to BMIbaseline), we categorized four BMI change patterns (Fig. 2): 1) stable non-obese pattern: BMI < 30 kg/m2 at both time point; 2) obese to non-obese pattern: BMI≥30 kg/m2 at the younger age and < 30 kg/m2 later; 3) non-obese to obese pattern: BMI < 30 kg/m2 at younger age and≥30 kg/m2 later; and 4) stable obese pattern: BMI≥30 kg/m2 at both time points. This approach has been described extensively elsewhere [18].
All models were adjusted for covariates associated with cognitive decline and dementia, including age, sex, race/ethnicity, education level, annual household income, smoking status, diabetes, hypertension, chronic kidney disease, and cardiovascular diseases (coronary heart disease, myocardial infarction, and stroke).
Assessment of cognitive function
Cognitive function was measured using the baseline NHANES surveys. The cognitive function tests used in the NHANES include the Digit Symbol Substitution Test (DSST), Consortium to Establish a Registry for Alzheimer’s Disease Word Learning test (CERAD-WL) and Delayed Recall test (CERAD-DR), and Animal Fluency (AF) test. In NHANES 1999–2001 and 2002–2003, only one cognitive test, the DSST, was administered to participants aged≥60 years. In NHANES 2011–2012 and 2013–2014, all four tests were administered to participants aged≥60 years.
In the DSST, participants were requested to copy corresponding symbols that were paired to nine numbers in the 133 boxes adjoining the numbers in 2 min. The score represented the total number of correct matches. The maximum score for this test is 100, and the score reflects processing speed, sustained attention, and working memory.
The CERAD-WL consisted of four tests, of which three were consecutive learning trials and one was a delayed recall trail. In the learning part, 10 unrelated words were presented one at a time, and participants were requested to read each one aloud. Immediately after the presentation of the words, the participants were asked to recall as many words as possible. The total score for the learning task was 30. For the delayed recall trail, participants were requested to recall the as many of the words used in the first CERAD-WL trial as they could approximately 8–10 min after the word learning trials. The maximum CERAD-DR score was 10.
In the AF test, participants were requested to name as many animals as possible in 1 min after passing a practice test that required them to name three items of clothing. The maximum score for the AF test was 40, and the score depended on the number of animals named.
For all participants, cutoffs of < 14 for the AF score, < 17 for the CERAD-WL score, and < 5 for the CERAD-DR score were used to distinguish potential cognitive impairment from relative cognitive health in the NHANES; the cutoff values were based on prior literature [19–21]. The DSST cutoff was defined as the dividing line of the lowest quartile (25th percentile) in our study group (≤30 points) to DSST impairment, which is consistent with the methods previously published in the literature [22].
Statistical analysis
All statistical analyses were performed using Stata (version 15.0; StataCorp LP, College Station, USA), and a two-tailed p value of < 0.05 was considered to indicate statistical significance. Demographic variables at baseline were presented as means with standard deviations or proportions.
Linear regression models were used to investigate the differences in the coefficients of each weight-change group with cognitive test scores at each time interval after checking for normality. The stable non-obese weight-change pattern was defined as the reference group. When the cognitive test scores were considered categorical variables, we used logistic regression models to compare the results of different groups by using the stable non-obese group as the reference. Considering the different weight statuses across each individual’s lifespan, participants were asked to recall the age at which they were at their heaviest weight. Linear regression models were used to investigate the potential linearity between the changes in cognitive function and the increase in the year when weight was the heaviest. We then categorized three ageheaviest weight groups: 18–40, 40–60,≥60 years, while the group with the heaviest weight after≥60 years of age served as the referent. Models were adjusted for age, sex, race/ethnicity, education level, and annual household income as well as smoking status, diabetes, hypertension, chronic kidney disease, and cardiovascular diseases (coronary heart disease, myocardial infarction, and stroke).

Study design for analysis between weight change and cognitive impairment at survey (n = 7,178). It shows how a retrospective cohort of US adults were created. We studied individuals who participated in the NHANES (1999–2002, 2011–2014) cross-sectional survey at ages 60 years and more. It based on participants’ recalled weight history at age 25 (young adulthood) and ten years before the survey (age≥50 years, midlife), which were used to create a measure of weight change between young adulthood and midlife. We then investigated the association between this weight change and risk of cognitive impairment at the survey time.
RESULTS
Characteristics of the participants
Data on cognitive function were available for 7,178 individuals who participated in NHANES 1999–2002 and 2011–2014. After excluding those without weight information ten years before the survey and in young adulthood, 5,809 participants were finally included in the current study (Fig. 1). Of these, 5,152 individuals had undergone the DSST; 2,830, the CERAD-WL; 2,828, the CERAD-DR; and 2,812, the AF test. The results of the DSST, CERAD-WL, CERAD-DR, and AF test indicated cognitive impairment in 12.9%, 21.9%, 21.5%, and 21.3% of the participants, respectively. Approximately 50% of the individuals were considered to have lived past midlife (≥60 years) 10 years before the baseline survey. The baseline characteristics of the enrolled patients are presented in Table 1. In absolute numbers, participants with cognitive impairment were likely to be older, black, diabetic, hypertensive, and have a lower annual household income. Regardless of cognitive impairment, BMI increased significantly from the age of 25 to 10 years before baseline and remained relatively stable thereafter. No discernible differences were observed in BMI at any time point between those who later developed cognitive impairment and those who did not.
Characteristics of the NHANES Study Populations according to weight change patterns from age 25 to survey in adults ages ≥60 years (N = 5,809)
AF, animal fluency test; CERAD-DR, Consortium to Establish a Registry for Alzheimer’s Disease Delayed Recall test; CERAD-WL, Consortium to Establish a Registry for Alzheimer’s Disease Word Learning test; DSST, Digit Symbol Substitution Test. NHANES, National Health and Nutrition Examination Survey; SES, socioeconomic status; CI, Confidence Interval. aCognitive impairment defined as DSST score < 30, CERAD-WL score < 17, CERAD-DR score < 5, AF score < 14. bSelf-reported BMI 25 years age. cSelf-reported BMI 10 years before examination. dSelf-reported BMI at examination.
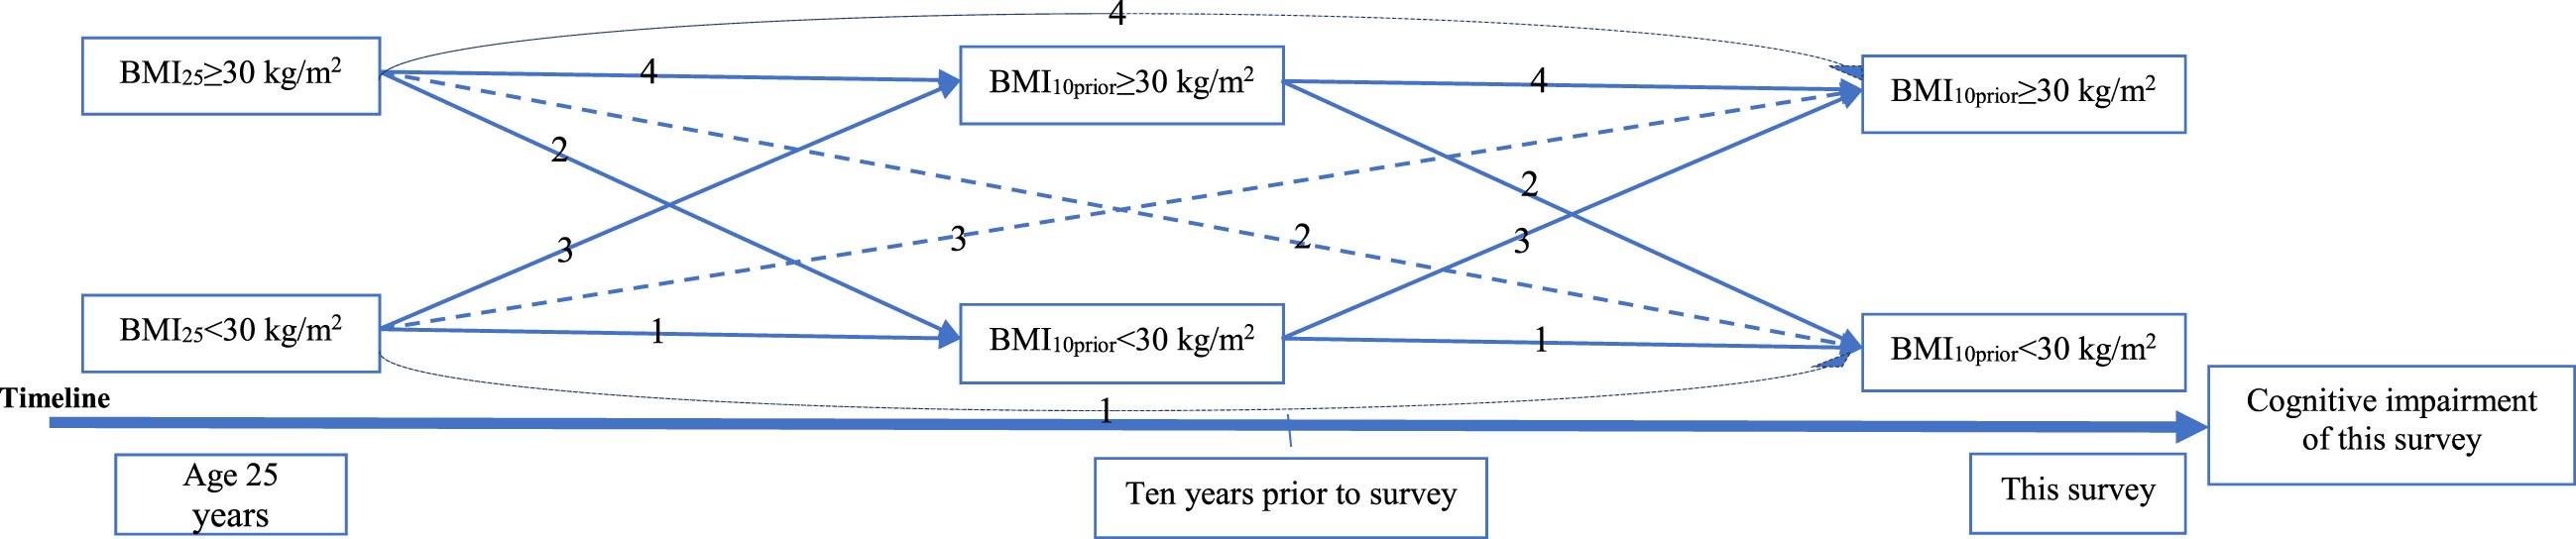
The association between weight change and cognitive impairment at survey. 1) Stable non-obese: BMI < 30 kg/m2 at both times; 2) obese to non-obese: BMI≥30 kg/m2 at younger age and < 30 kg/m2 later; 3) non-obese to obese: BMI < 30 kg/m2 at younger age and≥30 kg/m2 later; and 4) stable obese: BMI≥30 kg/m2 at both times.
Association between weight change patterns and specific cognitive test scores
After adjusting for possible confounders, in comparison with stable non-obese participants, participants who changed from the obese to non-obese category during the 10-year period before baseline tended to have lower DSST scores (β= –3.22; 95% confidence interval [CI]: –5.09 to –1.35), whereas no significant difference was observed in participants belonging to the non-obese to obese group (β= –0.60, 95% CI: –2.29 to 1.08) and the stable obese group (β= –0.32, 95% CI: –1.78 to 1.15). CERAD-WL, CERAD-DR, and AF test scores were similar among the four weight-change pattern groups. In the analysis of BMI changes from 25 years of age to 10 years before the baseline survey, those who changed from the non-obese to obese category tended to have lower DSST scores (β= –1.28; 95% CI: –2.24 to –0.31) than stable non-obese participants. No other significant association was observed for participants belonging to the obese to non-obese (β= –5.43, 95% CI: –11.40 to 0.54) and stable obese groups (β= 1.57, 95% CI: –1.48 to 4.63). CERAD-WL, CERAD-DR, and AF test scores were not significantly different among the four weight-change pattern groups. From the age of 25 years to the baseline survey, no significant difference was found between BMI changes and scores among all four cognitive tests in comparison with the stable non-obese participants (Table 2).
Regression coefficient (95% CI) for the associations between weight change patterns and\\ cognitive scores using NHANES (1999–2002, 2011–2014)a
AF, animal fluency test; CERAD-DR, Consortium to Establish a Registry for Alzheimer’s Disease Delayed Recall test; CERAD-WL, Consortium to Establish a Registry for Alzheimer’s Disease Word Learning test; DSST, Digit Symbol Substitution Test. NHANES, National Health and Nutrition Examination Survey; SES, socioeconomic status; CI, Confidence Interval. aSample sizes are adjusted to account for the effect of weighting. b β: differences in DSST scores in linear regression (negative β coefficients represent lower DSST scores and worse cognitive performance). β-coefficients are reported with 95% CIs. cModels sequentially adjusted for SES (age, sex, race/ethnicity, education level, and annual household income) plus conditions (smoking status, diabetes, hypertension, chronic kidney disease or cardiovascular diseases). Cardiovascular diseases: coronary heart disease, myocardial infarction, and stroke. #p < 0.05; # #p < 0.01.
Association between weight-change patterns and specific cognitive impairment
Using a logistic regression method and after adjusting for all potential confounders, we explored the relationship between weight-change patterns and cognitive impairment. Analysis of the data obtained 10 years before baseline showed a higher risk of AF impairment in the obese to non-obese group than in the stable non-obese group (odds ratio [OR] = 1.50; 95% CI: 1.05 to 2.16), which was not found in the non-obese to obese group (OR = 0.89; 95% CI: 0.59 to 1.34) or the stable obese group (OR = 0.97; 95% CI: 0.66 to 1.42). All four weight-change pattern groups showed no difference in the risk of DSST, CERAD-WL, and CERAD-DR impairment during this period. From 25 years of age to 10 years prior to baseline, a significantly higher risk of DSST impairment was found in the non-obese to obese group (OR = 1.40; 95% CI: 1.09 to 1.79), but not in the obese to non-obese group (OR = 2.05; 95% CI: 0.47 to 8.96) or stable obese group (OR = 0.68; 95% CI: 0.35 to 1.31) in comparison with the stable non-obese group. Similar risks of the other three cognitive impairments (CERAD-WL, CERAD-DR, and AF) were found in all four weight-change pattern groups. In the analysis over a longer duration (from 25 years of age to the baseline survey), the results showed that, in comparison with stable non-obese individuals, people in the obese to non-obese group were at higher risk of CERAD-DR impairment (OR = 2.51; 95% CI: 1.17 to 5.40), but not DSST (OR = 0.94; 95% CI: 0.23 to 3.82), CERAD-WL (OR = 1.64; 95% CI: 0.76 to 3.56), or AF impairments (OR = 1.13; 95% CI: 0.30 to 4.32). Participants in the non-obese to obese and stable obese groups were found to have a similar risk of cognitive impairment as those in the stable non-obese group (Table 3).
Risk of weight change patterns and low cognitive scores/cognitive impairment using NHANES (1999–2002, 2011–2014)a
*All estimates accounted for complex survey designs. DSST, Digit Symbol Substitution Test; NHANES, National Health and Nutrition Examination Survey; OR, odds ratio; SES, socioeconomic status; VI, visual impairment. AF, animal fluency test; CERAD-DR, Consortium to Establish a Registry for Alzheimer’s Disease Delayed Recall test; CERAD-WL, Consortium to Establish a Registry for Alzheimer’s Disease Word Learning test; DSST, Digit Symbol Substitution Test; CI, Confidence Interval. aSample sizes are adjusted to account for the effect of weighting. bOdds ratios for DSST-based cognitive impairment vs no cognitive impairment in logistic regression. β-coefficients and ORs are reported with 95% CIs. cModels sequentially adjusted for age, sex, race/ethnicity, education level, and annual household income, plus conditions (smoking status, diabetes, hypertension, chronic kidney disease or cardiovascular diseases); cardiovascular diseases included coronary heart disease, myocardial infarction, and stroke. #p < 0.05; # #p < 0.01.
The effect of age at heaviest weight on different cognitive scores
First, we considered age at the heaviest weight as a continuous variable (Table 4). We observed that the larger ageheaviest, the better the DSST score (β= 0.03; 95% CI: 0.00 to 0.06). In comparison with participants whose ageheaviest was≥60 years, individuals whose ageheaviest was between 18 and 40 years had lower DSST scores (β= –1.46; 95% CI: –2.77 to –1.52; Table 5), but no significant difference existed in those whose ageheaviest was between 40 and 60 years (β= –0.50; 95% CI: –1.56 to 0.56). The ageheaviest showed no significant effects on the CERAD-WL, CERAD-DR, and AF test scores in both continuous and categorical analyses.
Regression coefficient (95% CI) for the relationship of age at heaviest weight and cognitive scores
AF, animal fluency test; CERAD-DR, Consortium to Establish a Registry for Alzheimer’s Disease Delayed Recall test; CERAD-WL, Consortium to Establish a Registry for Alzheimer’s Disease Word Learning test; DSST, Digit Symbol Substitution Test. NHANES, National Health and Nutrition Examination Survey; SES, socioeconomic status; CI, Confidence Interval. aModels adjusted for age, sex, race/ethnicity, education level, and annual household income, plus conditions (smoking status, diabetes, hypertension, chronic kidney disease or cardiovascular diseases).
Regression coefficient (95% CI) for the relationship of age at heaviest weight and cognitive scores
AF, animal fluency test; CERAD-DR, Consortium to Establish a Registry for Alzheimer’s Disease Delayed Recall test; CERAD-WL, Consortium to Establish a Registry for Alzheimer’s Disease Word Learning test; DSST, Digit Symbol Substitution Test. NHANES, National Health and Nutrition Examination Survey; SES, socioeconomic status; CI, Confidence Interval. aModels adjusted for age, sex, race/ethnicity, education level, and annual household income, plus conditions (smoking status, diabetes, hypertension, chronic kidney disease or cardiovascular diseases). #p < 0.05; # #p < 0.01.
DISCUSSION
We aimed to evaluate the relationship between lifetime BMI change patterns and cognitive function in late life in a large retrospective study of a nationally representative US adult population. Our study showed that a change from non-obese to obese status from age 25 years to 10 years before baseline was associated with lower DSST scores in later life.
Consistent with our study, previous studies have also shown that obesity in midlife is associated with subsequent impairments in cognitive function, whereas in late life, obesity seems to be a protective factor [23]. The relationship between BMI and dementia may be explained by two processes [17]: a harmful effect of higher BMI, which is more likely to reflect a causal process, and reverse causation as a result of weight loss during the preclinical dementia phase, known as “obesity paradox” [4]. The influence of reverse causation on BMI is likely to be observed≥10 years before the diagnosis of dementia [9, 25]. Consistently, we found that the individuals who were obese during the 10-year period before baseline and from 25 years of age to baseline were not associated with worse cognitive function; a change from obese to non-obese status during the 10-year period before baseline was associated with lower DSST and AF scores; and the age at the heaviest weight was positively associated with DSST scores. Since individuals in our baseline survey were approximately 70 years old and “at risk” of dementia onset [26], the group with cognitive impairment may have changed their weight unintentionally, and one study found that those men who subsequently moved from overweight to normal weight had the worst prognosis in late life [27].
We also found that a change from obese to non-obese status during early to mid- adulthood was not associated with cognitive function. Russ et al. also found no association between BMI measured in early life and subsequent dementia-related deaths [28]; their research was based on men who were highly educated and were more likely to adopt a healthy lifestyle. However, the results of other studies contradicted our findings [10, 30].
The exact mechanisms underlying the increased risk of obesity-associated dementia are not fully understood [9]. Differences in body mass may indirectly influence cognitive function through systemic inflammation, hypercortisolemia, cardiovascular risk factors, and low exercise levels [10, 32]. Obesity is associated with alterations in brain structure and function, cerebral white matter atrophy [4, 33], and gray matter decline [34, 35]. In comparison with older adults, middle-aged adults (approximately 40 years of age) show the maximal effects of increased body mass on cerebral white matter volume [36]. In addition, widespread gray matter decline has been found in older adults with a higher BMI [37, 38], whereas Ronan et al. reported no association [36]. These findings seem to contradict the protective role of high BMI in elderly individuals through increasing insulin-like growth factor I (IGF-1) levels, leptin hormone levels, and estrogen production [39]. Additionally, individuals may have different sensitivities to obesity. A study by Karlsson et al. using data from 22,156 twins and more than 37,000 individuals, found that the increased risk for developing dementia among people with higher BMI in adulthood and early midlife was present only among those with a genetic predisposition to lower BMI [40]. Obesity may also be a critical risk factor. Central obesity in midlife was found to increase the risk of dementia [41, 42], which may even exist in people who are not overweight [42]. Subsequent findings showing prompt and sustained improvements in cognitive function, including memory, executive function, and cognitive control, after bariatric surgery support this idea [43].
In our study, moving from the obese range at 25 years of age to the non-obese range at baseline was associated with lower CERAD-DR scores, which is consistent with the study by Alexander N. Allen [44], who showed that loss of BMI over 30 years was associated with a higher risk of death from dementia (adjusted HR, 1.10 [1.03–1.19]). Although this relationship may be assumed to become more evident during the 10-year period before the baseline, this was not the case in this study. In a meta-analysis [39], midlife (45-65) underweight was shown to confer a 1.31-fold higher risk of cognitive impairment. Similar results were observed in a retrospective cohort study based on over two million people [14], which is consistent with our findings in the obese to non-obese status group. People with low cognitive function or cognitive impairment may experience changes in appetite or other aspects of behavior, which may result in reduced energy intake [44, 45]. The relationship between unintentional weight loss and cognitive function has implications for public health strategies to prevent of dementia. Regular BMI measurements, a convenient and cheap method, can help identify people at a high risk of dementia. However, the cost-effectiveness of dementia screening in this group is unknown and may prove to be an important area for future research.
DSST, which is sensitive to impairments and improvements in processing speed, executive functioning, and working memory, is a final common pathway for the expression of diverse types of impairment. However, it cannot precisely determine which cognitive domain has been affected [46]. In both the linear regression and logistic analyses, lower DSST scores indicated that moving from no obesity at 25 years of age to obesity at 10 years before the baseline was related to later cognitive impairment. However, this relationship was not observed in the other three tests during the study period.
Strengths and limitations
Our study included a large and nationally representative sample with a detailed analysis of weight changes from young adulthood through midlife to late adulthood, which allowed us to estimate the associations between weight change across adulthood and cognitive function. Since people are more likely to gain weight until middle age, stabilize, and begin to lose weight near 60 years of age [47], assessment of weight changes in different life periods is important. In addition, weight gain in early adulthood mostly reflects fat accumulation, and weight loss in late life may reflect a loss of lean mass as well as an increase in fat mass [48, 49]. By studying weight-change patterns, we can better understand the dynamic relationship between changes in BMI and cognitive function.
This study also had several limitations. First, we stratified the participants into only two groups, obese, and non-obese, which may have caused data reduction. More specific classifications, including underweight, normal weight, and overweight, may better fit the reality. In our study, the maximum BMI of most participants could be classified as overweight; therefore, if we had further categorized the non-obese pattern into a stable normal pattern and maximum overweight pattern, similar to the approach employed by Pan et al. [50], the group with the stable normal pattern would be relatively small. Second, we only used BMI and not waist circumference or the waist-to-height ratio. Central obesity has been reported to be associated with a higher risk of cognitive decline, even in individuals with a normal BMI [42]. Third, the weight and height were self-reported. Although the self-reported height may be closer to the actual height, the actual weight is likely to be lower than that reported by the participants, which may result in bias. Moreover, recall bias may be large because of the long-time interval. However, since historical weight measures have been proven to show high agreement with the measured weight in previous studies, our results should remain sound [51, 52]. Fourth, the four tests we used could not fully characterize cognitive damage. Fifth, in comparison with their normal-weight counterparts, obese individuals are more likely to die due to diseases such as cardiovascular disease, diabetes, and stroke [8]. Since the participants in our study were approximately 70 years old, a survival bias might exist. Finally, although we controlled the results for several potential confounders, residual confounding cannot be ruled out because of the observational study design. Our study did not include APOE level, exercise, trauma, or medicine, which may have affected the accuracy of the experimental results. In addition, only baseline characteristics and potential confounders were employed in our study; therefore, we could not capture changes in possible confounders over time.
Conclusions
In conclusion, our results suggest that the transition from the non-obese range to the obese range, especially in early adulthood, is positively correlated with worse cognitive function in later life. Our findings have implications for the development of public health strategies to prevent dementia. Regular weight checks can help identify high-risk populations and facilitate prompt interventions. Further research is required to examine the mechanisms underlying the influence of weight changes on cognitive function.
Footnotes
ACKNOWLEDGMENTS
This work was supported by the National Natural Science Foundation of China (grant number 82070851). The authors are solely responsible for the design and conduct of this study, all study analyses, drafting and editing of the manuscript, and its final contents.
Authors’ disclosures available online ("https://www.j-alz.com/manuscript-disclosures/22-0788r1">https://www.j-alz.com/manuscript-disclosures/22-0788r1).
DATA AVAILABILITY
The data supporting the findings of this study are available on request from the corresponding author.