
Abstract
Background:
Few prospective studies with long duration of follow-up have assessed the relations of body mass index (BMI) and weight change with cognitive function, especially in Asian populations.
Objective:
To investigate whether BMI and weight change in midlife are associated with cognitive impairment in old age.
Methods:
We used data from 14,691 participants in the Singapore Chinese Health Study and computed weight change as the difference between weight reported at baseline (1993–1998) at mean age of 53.0 years and follow-up 1 (1999–2004) at mean age of 58.6 years. Cognitive impairment was determined using education-specific cut-offs of the Singapore Modified Mini-Mental State Examination at follow-up 3 (2014–2016) at mean age of 72.9 years. We used multivariable logistic regression models to estimate the odds ratios (ORs) and 95% confidence intervals (CIs) for the associations.
Results:
Obesity (as defined BMI ≥27.5 kg/m2) was associated with a higher risk of cognitive impairment at baseline (OR 1.33, 95% CI 1.12–1.58) and follow-up 1 (OR 1.30, 95% CI 1.10–1.54) compared to BMI of 18.5–22.9 kg/m2. Underweight (BMI <18.5 kg/m2) was not associated with a significant risk either at baseline (OR 0.91, 95% CI 0.73–1.13) or follow-up 1 (OR 1.05, 95% CI 0.85–1.28). Compared to participants with <5% weight change, the ORs (95% CIs) of cognitive impairment were 1.20 (1.03–1.41) for those with 5–9.9% weight loss, 1.53 (1.29–1.81) for ≥10% weight loss, 1.00 (0.85–1.17) for 5–9.9% weight gain, and 1.50 (1.28–1.75) for ≥10% weight gain.
Conclusion:
Obesity, weight loss, and excessive weight gain at midlife were associated with an increased risk of cognitive impairment at old age.
INTRODUCTION
Accumulating evidence has linked midlife overweight and obesity to cognitive decline [1], and it has been projected that increasing rates of mid-life obesity would cause an increase in dementia by 19% in China and 9% in the USA [2]. However, the results are not entirely consistent [3–6]. Since current evidence is mostly based on studies in Western countries [7], it is not clear to what extent these findings apply to Asian populations who are generally leaner and yet more susceptible to obesity-related metabolic consequences, especially in relation to risk of cardiovascular disease [8]. In contrast, epidemiological evidence about impact of underweight on cognitive function has remained inconclusive and more studies in populations with a high prevalence of underweight are needed [7].
Since obesity at midlife has been recognized as a potentially modifiable risk factor of dementia, reducing weight may intuitively seem to be a possible strategy that may protect against cognitive decline with aging [9], and this could be mediated either through direct effects or through improvement in other metabolic factors implicated in pathogenesis of cognitive impairment [10]. On the contrary, weight loss has been associated with worsening of cognition with ageing in some observational studies [11–19]. This phenomenon, referred to as the obesity paradox, casts doubts on the potential cognitive benefits of weight loss and necessitates further studies with long enough follow-up [10]. Hence, in this prospective study, we aimed to assess the association between weight change at midlife and cognitive impairment assessed at least 10 years later in a Chinese population residing in Singapore.
METHODS
Study population and design
We used data from the Singapore Chinese Health Study (SCHS), a population-based cohort study that recruited 63,257 Chinese adults aged 45 to 74 years from April 1993 to December 1998. Participants were permanent residents or citizens of Singapore living in government-built housing estates, where 86% of Singapore residents resided during the time of recruitment. They were from the two major dialect groups in Singapore, Hokkiens and Cantonese, who mostly originated from the Fujian and Guangdong provinces in Southern China, respectively. At recruitment, participants were interviewed in-person and information on demographic characteristics, lifestyle factors (smoking, habitual diet, and physical activity), and medical history was collected through structured questionnaires. Participants were re-contacted for follow-up 1 (1999 to 2004), follow-up 2 (2006 to 2010), and follow-up 3 (2014 to 2016) interviews. The mean±standard deviation for follow-up duration was 20.1±1.9 years (ranging from 15.8 to 23.8 years), comprising 5.5±1.4 years between baseline and follow-up 1 (ranging from 3.0 to 11.0 years) and 14.6±1.2 years between follow-up 1 and follow-up 3 (ranging from 10.5 to 17.4 years). The Institutional Review Board at the National University of Singapore approved the study and informed consent was obtained from each participant. Further details of SCHS study design have been published previously [20].
Assessment of weight and covariates
Self-reported information about weight and height was collected at baseline as well as follow-up interviews. Body mass index (BMI) was calculated by body weight in kg divided by square of height in meter. BMI categories were defined as underweight (<18.5 kg/m2), normal weight (18.5–22.9 kg/m2), overweight (23.0–27.4 kg/m2), and obese (≥27.5 kg/m2), which are the cut-offs for public health action recommended for Asian populations by the World Health Organisation [8]. In secondary analysis, we also studied the association with BMI using conventional cut-offs for the sake of comparability with other studies (<18.5, 18.5–24.9, 25.0–29.9, and ≥30.0 kg/m2, respectively). We subtracted weight at follow-up 1 from weight at baseline and calculated percent weight change by dividing this difference by weight at baseline and categorized it to ≥10% weight loss, 5 to <10% weight loss, stable weight (change <5%), 5 to <10% weight gain, and ≥10% weight gain.
A validated semi-quantitative food-frequency questionnaire (FFQ) including 165 commonly consumed food items in this population was administered during the baseline interview [20]. Information on medical history of type 2 diabetes, hypertension, coronary artery disease, and stroke were collected by asking if participants have been diagnosed by a doctor. Cancer history was obtained either from self-report or through data linkage with the nationwide Singapore Cancer Registry database.
Assessment of cognitive function
We used the Singapore Modified Mini-Mental State Examination (SM-MMSE) [21] to assess cognitive function of participants through face-to-face interviews at follow-up 3. The SM-MMSE test comprises orientation, attention, immediate and delayed recall, language, pentagon copying, and the ability to follow verbal and written instructions. The range of SM-MMSE score is 0 to 30, with a higher score representing better global cognition [22]. According to the preference of the participants, the test was administered in the Chinese dialects of Hokkien or Cantonese, or in Chinese Mandarin. A psychiatric and geriatric epidemiologist (L.F.) who has expertise and extensive experience in cognitive assessment systematically trained interviewers to perform the SM-MMSE test and evaluated them. All the interviews were recorded and 20% were randomly selected for quality control. The interviewers were re-trained and re-assessed if they did not follow the protocol.
A MMSE score lower than 24 is the original criteria for a suspected cognitive impairment [23]. Previous studies have shown that education significantly affected the MMSE score [24, 25]. Low educated participants might be classified as being cognitively impaired due to low literacy skills, whereas higher education could counterbalance subtle impairment. Thus, we defined cognitive impairment by using the education-specific cut-off points according to the Shanghai Dementia Survey [25], which included participants with comparable education levels to those in our study: less than 18 for those without formal schooling, less than 21 for those with 1–6 years of education, and less than 25 for those with more than 6 years of education.
Statistical analysis
A total of 17,107 surviving participants aged 61–96 years participated in the follow-up 3 interviews. We performed the final analysis on 14,691 participants (6,148 men and 8,543 women) after excluding those with missing information about weight or height at baseline or follow-up 1 interviews (n = 2,257), those with missing value on cognitive tests (n = 55) and participants who were mute (n = 1), blind (n = 55), or deaf (n = 48), at follow-up 3 interviews (Supplementary Figure 1). Among these 14,691 participants, 14,109 also reported weight and height again during MMSE assessment at follow-up 3 interviews. Energy-adjusted values were used for all foods and nutrients using the residual method [26]. We employed logistic regression models to estimate odds ratios (OR) and 95% confidence intervals (CI) for associations of BMI at baseline and follow-up 1 as well as weight change categories with cognitive impairment.
In multivariable models, we first adjusted for age at follow-up 3 (years), sex, interview year at baseline (1993–1995, 1996–1998), dialect group (Hokkien, Cantonese), level of education (none, primary school, secondary school, A-level and higher), and marriage status (married, widowed, separated, never married). In the second model we adjusted for physical activity level (<0.5, 0.5–3.9, ≥4.0 h/week), cigarette smoking (never, past, current smoker), alcohol consumption (never/monthly, weekly, daily), self-reported history of hypertension, diabetes, coronary heart disease, and stroke, as well as cancer history and sleep duration (≤5, 6, 7, 8, ≥9 h). We used updated data about smoking, alcohol drinking, and medical history when BMI at follow-up 1 or weight change were assessed. In sensitivity analyses we further adjusted for intakes of red meat, poultry, fish, vegetables, fruits (all as quartiles), tea (≤monthly, weekly, daily), and coffee (<daily, 1 cups/day, ≥2 cups/day) assessed during baseline interviews. We also adjusted for the scores of Alternate Healthy Eating Index (AHEI)-2010 dietary pattern [27] (quartiles) as a measure of overall diet quality instead of the individual food items in the sensitivity analysis. In an independent model, we further took into account baseline BMI (continuous) for weight change analysis.
We further evaluated the relationship between weight change and cognitive impairment through restricted cubic splines analysis using five knots as it led to the best model fit determined by the lowest Akaike information criteria (AIC = 11226) compared to four (11230) or three (11227) knots. Wald-test was used to check if regression coefficients of second splines onwards significantly differed from zero indicating evidence against linearity. Using the third knot as reference, we computed the corresponding ORs and CIs of weight change values for visual presentation.
We tested interactions through cross-product terms of weight change categories and gender, baseline age (<55 versus ≥55 years) and BMI (<23 and ≥23 kg/m2), as well as follow-up 1 status of smoking (non-current, current) and history of cardiometabolic co-morbidities (a composite of any history of diabetes, hypertension, coronary artery disease, and stroke). All statistical analyses were conducted using Stata Statistical Software, Release 14.2 (Stata Corporation, College Station, TX), with 2-sided p value less than 0.05 as the threshold for statistical significance.
RESULTS
The mean (SD) age of the participants was 53.0 (6.2) years at baseline, 58.6 (6.3) years at follow-up 1, and 72.9 (6.3) years at MMSE assessment. Characteristics of the participants according to their baseline BMI and weight change status are presented in Supplementary Table 1 and Table 1, respectively. Individuals with BMI ≥27.5 kg/m2 at baseline were less educated with lower smoking and alcohol drinking but higher history of hypertension, diabetes, and cardiovascular disease. Those who had ≥10% gain or loss in weight had lower education levels and were more likely to be smokers than those with stable weight. The highest and lowest physical activity was observed in ≥10% weight loss and gain, respectively. BMI at baseline was the highest in those with ≥10% weight loss and the lowest in those with ≥10% weight gain. The proportion of participants with history of diabetes in those with weight loss was more than double the proportion in those with weight gain. Participants with <5% weight changes had slightly higher total calorie intake at baseline.
Participant characteristics according to categories of weight change in the Singapore Chinese Health Study
The data are expressed as n (%) or mean±standard deviation. Stable weight: Change <5%. BMI, body mass index; AHEI, Alternate Healthy Eating Index.
The median SM-MMSE score was 26 (interquartile range: 23–28) and 4,115 (28.1%) participants had a score less than 24. Using education-specific SM-MMSE cut-offs, we identified 1,893 (12.9%) participants with cognitive impairment. Compared to normal weight, obesity (BMI ≥27.5 kg/m2) at baseline, follow-up 1, and follow-up 3 interviews was associated with 33%, 30%, and 26% higher odds of cognitive impairment, respectively. Although underweight (<18.5 kg/m2) at baseline or follow-up 1 was not associated with a significantly increased risk of cognitive impairment, underweight concurrent to SM-MMSE assessment at follow-up 3 was associated with 22% higher odds of cognitive impairment (Table 2). The results did not materially change when we further adjusted for dietary variables (data not shown). When using the conventional cutoffs, we found that both overweight (16–19% higher odds) and obesity (29–57% higher odds) were associated with cognitive impairment compared to normal weight at baseline, follow-up 1, and at SM-MMSE assessment (Supplementary Table 2).
Odds ratio (95% Confidence Interval) for cognitive impairment according to categories of body mass index at different time points
*On average 20.1 years before MMSE measurement. †Multivariable model 1: adjusted for age, sex, dialect, year of interview, educational level, and marriage status; †† Multivariable model 2: further adjusted for physical activity, smoking status, alcohol use, baseline history of self-reported hypertension, diabetes, heart attack, and stroke, history of cancer, and sleep status. §On average 14.6 years before MMSE measurement. **At MMSE measurement, 14,109 reported weight and height out of the 14,691 participants in this study.
We computed the change in weight between baseline and follow-up 1, and found a nonlinear (p for nonlinearity <0.001) U-shaped association between weight change and risk of cognitive impairment (Fig. 1). Compared to those with <5% weight changes, higher odds of cognitive impairment was evident among participants with 5.0–9.9% weight loss (OR 1.20, 95% CI 1.03–1.41); this risk further escalated with ≥10% weight loss (OR 1.53, 95% CI 1.29–1.81), and was comparable to those with ≥10% weight gain (OR 1.50, 95% CI 1.28–1.75), while no association was found for those with 5.0–9.9% weight gain (OR 1.00, 95% CI 0.85–1.17). These associations withstood with minimal changes when we further controlled for the baseline BMI in an independent adjusted model (Table 3). Further adjustment for dietary factors did not materially change these findings (data not shown).
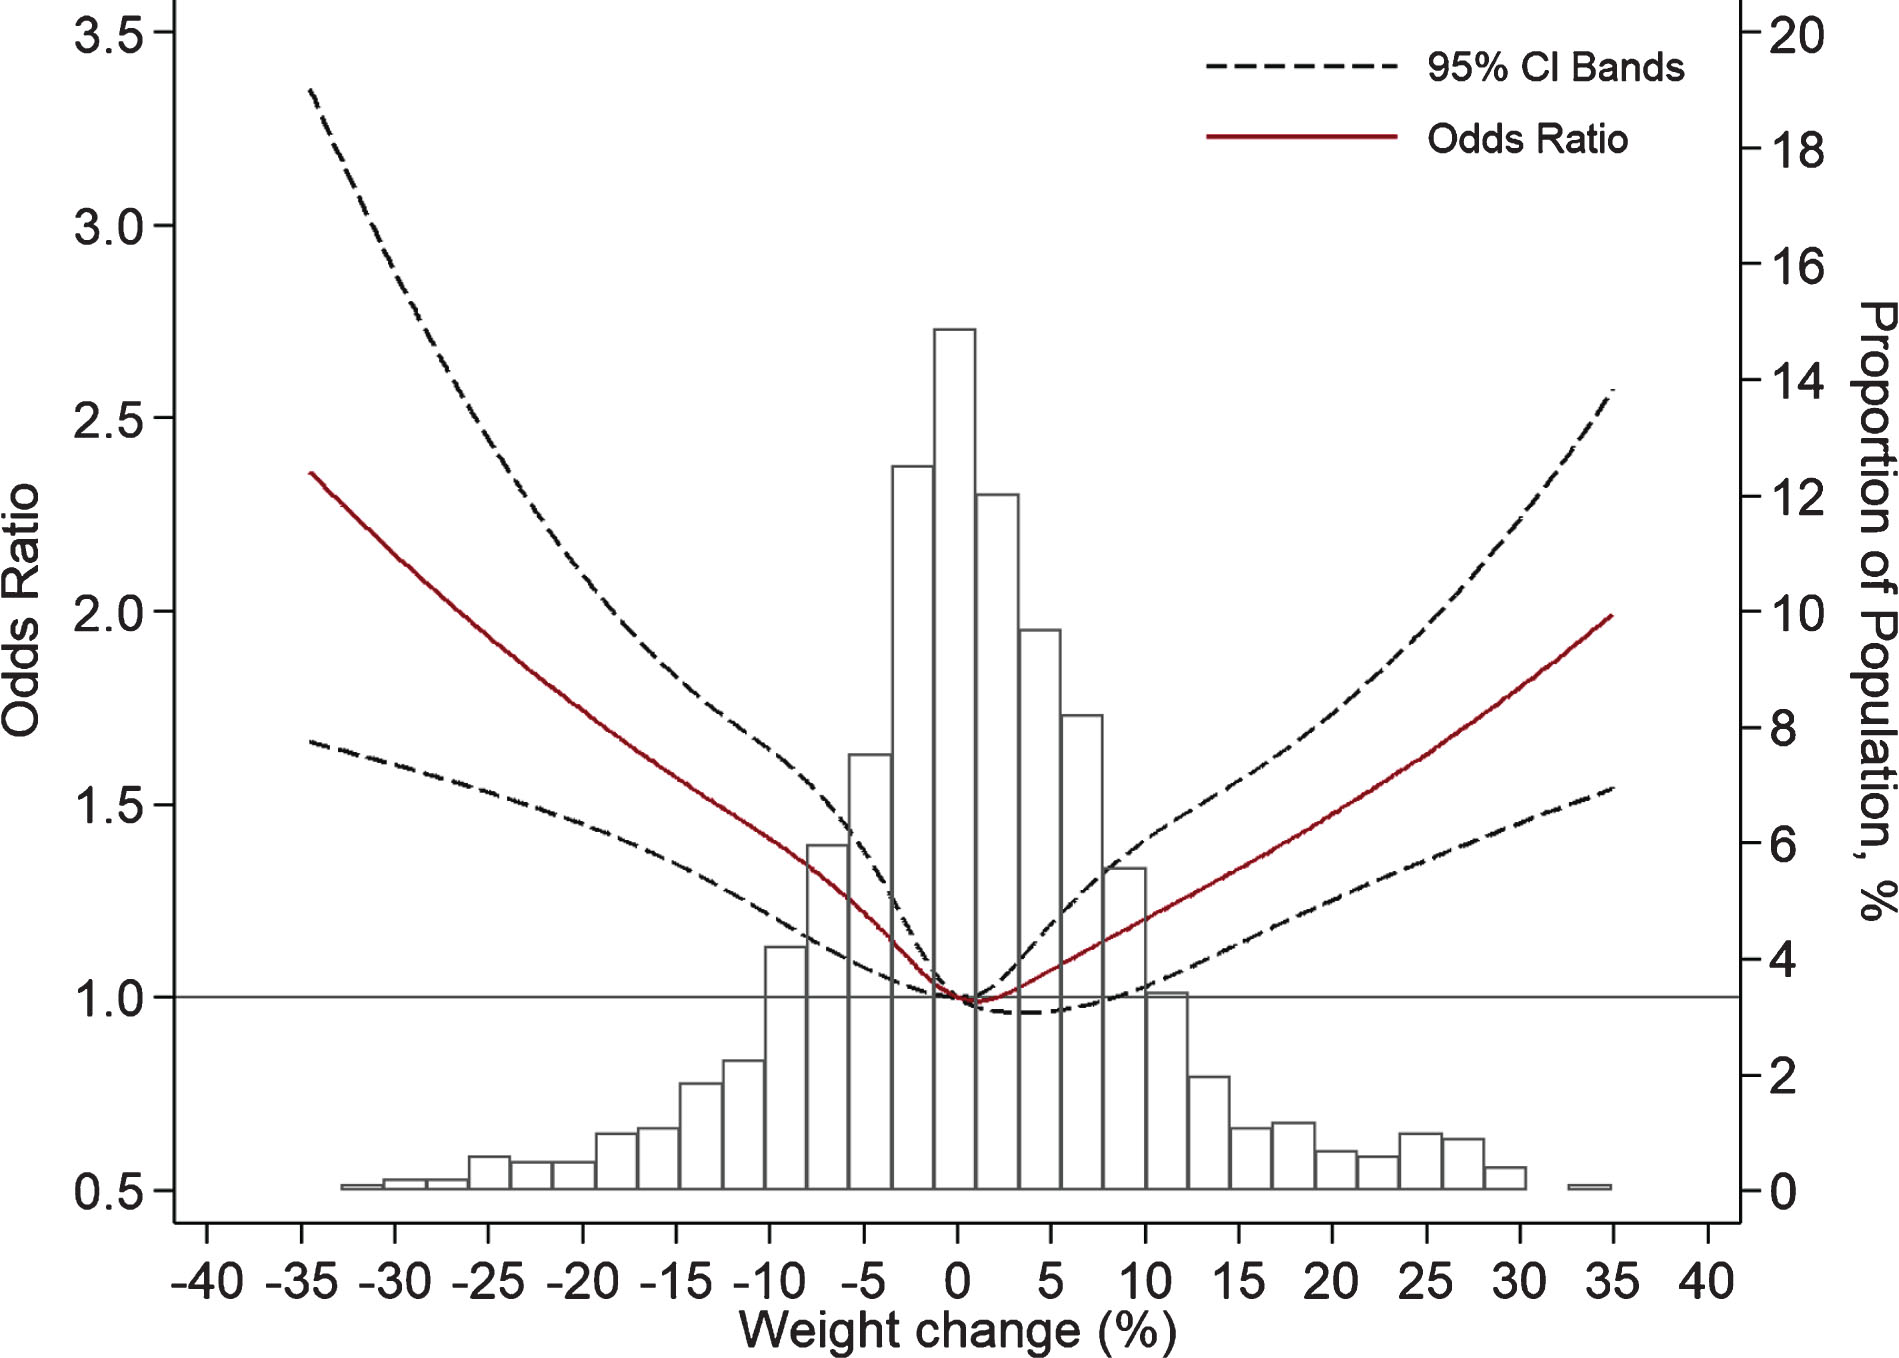
Dose-response relationship between weight change during 5.5 years at midlife and cognitive impairment detected 14.6 years later, using cubic spline analysis (adjusted for the same variables in multivariable model 2 in Table 3).
Odds ratio (95% Confidence Interval) for cognitive impairment according to categories of weight change in all participants, and stratified by age, sex, baseline body mass index, smoking status, and history of comorbidities
*Multivariable model 1: adjusted for age, sex, dialect, year of interview, educational level, and marriage status. †Multivariable model 2: further adjusted for physical activity, smoking status, alcohol use, baseline history of self-reported hypertension, diabetes, heart attack, and stroke, history of cancer, and sleep status. ‡Multivariable model 2 except for the stratification variable.
We observed a significant interaction with sex for the categories of moderate weight loss and gain: a higher risk was only observed in men in both categories; while the interaction was not significant for severe weight loss and gain (Table 3). No significant interaction was found for either baseline age (<55 and ≥55 years), baseline BMI (<23 and ≥23 kg/m2), or smoking status (non-smokers and current smokers), although a weaker and non-significant association was observed for moderate weight loss in older or leaner participants. We also stratified our analysis based on history of cardiometabolic comorbidities and found a significantly stronger association for ≥10% weight loss in participants without history of these comorbidities. In sensitivity analysis, we also used the SM-MMSE score as a continuous outcome and observed the highest value in those with <5% weight change and the lowest values in those with ≥10% weight change (Supplementary Table 3).
DISCUSSION
In this prospective study of middle age and elderly Chinese, obesity, weight loss of more than 5%, and weight gain of more than 10% at midlife were associated with a higher risk of cognitive impairment at later life. We observed significantly higher risk of cognitive impairment in men with moderate weight gain and loss (5.0–9.9%) at midlife, but not in women. Conversely, underweight at midlife was not associated with increased risk of cognitive impairment at later years, although there was a positive cross-sectional association between underweight and cognitive impairment at the time of MMSE assessment.
Excess body weight has been linked to neurodegenerative damages either through dysmetabolic pathway or directly through inflammatory mechanism driven by leptin or adiponectin secreted by adipose tissue that results in structural changes in the central nervous system [3]. A meta-analysis of 18 longitudinal studies showed 33% higher risk of dementia comparing obesity (BMI ≥30 kg/m2) with normal weight (BMI 18.5–24.9), but in contrast to our findings, no significant association was observed for BMI 25.0r–29.9 kg/m2 (RR 1.07, 95% CI 0.96r–1.20) [7]. Majority of the included studies in this meta-analysis were from the US and northern Europe, except for two small studies in Taiwan [28] and Israel [29]. Findings from the Whitehall II Study published after the meta-analysis also showed a higher risk of dementia for obesity at age 50, but in contrast to our findings, not at ages 60r–70 years [30]. On contrary, BMI at 18.4 years was not associated with dementia death while associated with a higher risk of cardiovascular disease mortality over 5 decades of follow-up [6]. To our knowledge, our study is the largest study so far about weight change and cognitive impairment in Asian populations, and our results suggest that the adverse impact of excess weight on cognition may emerge at lower values in Chinese, which in turn supports the WHO recommendation of lower BMI cutoffs in Asians [8].
The above-mentioned meta-analysis also reported an increased risk for BMI <18.5 kg/m2 (RR 1.39, 95% CI 1.13r–1.70) [7], which contradicted our report of a null association with underweight. However, the finding related to underweight was only evident in a pooled analysis of seven studies that used health records and not in five purposely designed studies. The size of underweight group in these five studies was limited (69r–610 subjects) and the authors had expressed a need for studies in populations with a higher prevalence of underweight and sufficient control for confounders to determine the association between underweight and dementia [7]. In our cohort with substantially more underweight participants, we did not observe a significant higher risk associated with underweight at baseline or follow-up 1. However, underweight at follow-up 3 was cross-sectionally associated with cognitive impairment, suggesting that the association between underweight and cognitive impairment could be explained by reverse causality in studies with short follow-up time. A meta-analysis of 13 longitudinal studies on intentional weight loss showed that a decrease in BMI from 37.2 to 30.9 kg/m2 was associated with improvements in attention, executive function, and memory but not motor speed and language parameters [10]. Pooled analysis of seven randomized clinical trials also showed that a 2.5 kg/m2 decrease in BMI improved attention, memory, and language parameters [10]. However, these studies only focused on short-term effects (4r–144 weeks), were conducted mostly in individuals who were obese, used interventions that may have conflicting impact themselves, had limited sample size (total n = 551), and most of them did not use global scales of cognition. In contrast, a direct relationship between weight loss and impaired cognition was observed in population-based longitudinal studies using various measures of cognition [11r–19], although null association was also reported for some cognitive scales including MMSE [18]. Trajectories of BMI over 37 years in Swedish women showed a slower rate of BMI gain in those who develop dementia [31], and trajectories of weight over 20 years in American women indicated 17% increased risk per 0.5 kg/year decrease in weight [19]. These studies have led to the hypothesis that maintaining a higher BMI into old age might be protective against decline in cognition [32]. However, in the Honolulu-Asia study of Japanese American men, groups with and without dementia did not differ with respect to baseline weight or change in weight from middle to late life (first 26 years’ follow-up). Instead, dementia-related weight loss appeared about 6 years before the onset of the clinical syndrome and accelerated by the time of diagnosis [33]. In another study, declines in BMI over 4 years was associated with lower memory scores over the next decade, especially among individuals who were initially overweight, but a faster decline in BMI was also observed in participants with lower memory scores at baseline [15]. Moreover, those who developed dementia in the Whitehall II Study were also heavier than their matched controls at baseline but experienced an accelerated decline in the decade before dementia diagnosis, resulting in a lower BMI at the end [30]. A individual-participant data meta-analysis of 1.3 million American and European adults showed the higher risk of dementia associated with a higher BMI 20 years before diagnosis gradually turns to a null association 10 years before, and an inverse association at the time of diagnosis [34]. In combination, these studies have suggested that the obesity paradox in dementia could be explained by reverse causality due to gradual weight loss during the long preclinical phase preceding onset of clinical dementia. An unclear direction of causality is precedent for other risk factors of cognitive impairment which might be even bidirectional [9]. Hence, low BMI or weight loss may be an early marker of an ongoing process, as suggested previously [13, 35], and could be a consequence of cognitive decline due to changes in appetite and feeding behavior rather than direct cause. It corroborates a Mendelian randomization study that showed genetic and hence lifelong low BMI is not causally associated with risk of Alzheimer’s disease [36]. Nonetheless, these findings emphasize the importance of life-course perspective in addition to BMI in a single time point.
The relation between weight gain and cognitive impairment has also been mixed in epidemiological studies, with an inverse association observed with death due to dementia [17], null association with memory scores in one study [15], and a higher risk of cognitive impairment in other studies [14, 37]. Moreover, the observed U-shaped association in our study is not unprecedented and changes in body weight at both directions have been associated with increased risk in previous studies [14, 29]. The relationship between weight change and cognitive impairment in Asians was previously tested in 1814 Japanese with a comparable mean age (68.5) and BMI (23.0 kg/m2) to our participants [16]. Although no significant association was observed for BMI in this study, the authors reported that using 4r–8 kg weight gain as the referent group, weight loss was associated with a significantly higher risk, whereas ≥8 kg weight gain was suggestive of a borderline higher risk too. However, these findings relied on participants’ memory of their past weight and might be subject to differential misclassification given the differing impact of aging on working, short- and long-term memory [38] and the long latent phase of cognitive impairment [3].
A study in African Americans with prevalent cardiovascular risk factors found a divergent relationship as loss of adiposity was associated with cognitive improvement in participants younger than 60 years but with cognitive decline in older participants [39]. We did not observe any effect modification using age of 55 years as cutoff. A gender-specific risk profile was observed in another study which reported a higher risk of Alzheimer’s disease associated with weight gain in men but weight loss in women [37]. We did not observe such divergent associations; nonetheless, men appeared to be more vulnerable to weight change in our study, and moderate weight change was linked to a higher risk in men but not in women. A higher susceptibility to mild cognitive impairment in obese men than women was also observed in Framingham Heart Study [40]. These findings were corroborated with studies that reported a greater brain atrophy in obese men than obese women [3], which could be explained by possible estrogen-dependent protection against components of metabolic syndrome [41].
Our findings should be interpreted considering the study limitations. First, cognitive performance of our participants was not assessed at enrolment. It is unlikely that those with severe cognitive impairment could have been included in this cohort due to burden of complex questionnaires at baseline. However, we cannot rule out existing cognitive impairment in its subtle form, which may have biased our findings through reverse causality given the long preclinical phase of dementia [3]. Second, the role of MMSE is still controversial as a stand-alone single-administration test in the identification of individuals with cognitive impairment at risk of dementia [23]. Many factors could contribute to scores of the test and misclassification (false positive and false negative) is almost inevitable even when validated cut-offs are applied. Another limitation of the study is the use of self-reported body weight and height in calculating BMI. However, self-reported body weight and height have been shown to be valid for epidemiologic studies across many populations [42], and specifically in lean Asian [43]. In addition, mean estimated BMI in SCHS was very similar to the directly measured weight and height in another population based study in Singapore [44]. Finally, we acknowledge that despite our comprehensive multivariable adjustment, the observed associations could be subject to residual confounding and do not directly indicate a causal relationship.
In conclusion, both obesity and excessive gain in weight at midlife may increase the risk of cognitive impairment at old age. Conversely, excessive weight loss may be an early marker of a long and insidious process of cognitive decline. Future studies are needed to disentangle the mechanisms underlying the effects of weight change on cognition, and to define ethnic-specific safe boundaries of weight change at middle and late life.
Footnotes
ACKNOWLEDGMENTS
We thank Siew-Hong Low of the National University of Singapore for supervising the fieldwork in the Singapore Chinese Health Study and Renwei Wang for the maintenance of the cohort study database. Finally, we acknowledge the founding Principal Investigator of the Singapore Chinese Health Study, Mimi C. Yu.
This work was supported by the Singapore National Medical Research Council (NMRC/CSA/0055/2013) and the United States National Cancer Institute, National Institutes of Health (UM1 CA182876 and R01 CA144034), and the Saw Swee Hock School of Public Health, National University of Singapore. M Talaei is supported by Cambridge-NUHS Seed Fund (NUHSRO/2017/015/Cambridge/01). L Feng is supported by Transition Award from the National Medical Research Council of Singapore [grant number NMRC/TA/0053/2016]. The funders had no role in study design, data collection and analysis, decision to publish, or preparation of the manuscript.