
Abstract
Background:
The lysosomal protease cathepsin D (catD) has been reported to be upregulated in postmortem Alzheimer’s disease (AD) cortex, where it colocalized with neurofibrillary tangles and correlated with levels of phosphorylated tau, suggesting pathophysiological links between catD and neurodegeneration. In contrast, studies of serum catD in AD have yielded conflicting results, and potential associations between baseline serum catD and functional outcomes of patients are at present unknown.
Objective:
We aimed to examine the status of serum catD in a Singapore-based longitudinal study of dementia and investigate catD associations with functional and cognitive decline.
Methods:
35 subjects with no cognitive impairment, 40 patients with cognitive impairment no dementia and 34 with AD dementia underwent annual neuropsychological assessments (mean follow-up=4.3 years), as well as collection of baseline serum for catD measurements by ELISA.
Results:
Higher serum catD at baseline was associated with AD clinical diagnosis (odds ratios [OR]: 10.0; 95% confidence interval [CI]: 1.02–97.95) as well as with cortical atrophy. Furthermore, higher catD was associated with global cognitive and functional decline (OR: 9.94; 95% CI: 1.02–97.34).
Conclusion:
The associations of serum catD with AD dementia as well as atrophy provide further support for the proposed links between catD and neurodegeneration, as well as for the assessment of serum catD as a prognostic biomarker predicting global cognitive and functional decline in larger studies.
Keywords
INTRODUCTION
Alzheimer’s disease (AD) is the most common form of neurodegenerative dementia, accounting for an estimated 50–75% of all cases. The hallmark pathological features of extracellular amyloid plaques and intracellular neurofibrillary tangles (NFT) arising, respectively, from the accumulation of abnormally aggregated amyloid-β (Aβ) peptides and hyperphosphorylated tau proteins, are thought to result from an imbalance between production and clearance [1, 2]. One important mechanism for clearance of abnormal or dysfunctional proteins is via degradation by various proteases, including lysosomal cathepsins [2]. In particular, cathepsin D (catD) is known to mediate the proteolysis of Aβ and tau aggregates. Indeed, catD hydrolyses Aβ at multiple cleavage sites, producing shorter fragments and thus preventing amyloid aggregation [3, 4]. Similarly, multiple catD cleavage sites have been identified on tau, suggesting a major role for catD in the degradation of NFT [5]. Therefore, perturbations of catD may be associated with AD pathophysiology [6, 7]. Whilst an earlier study found unchanged global catD levels and activities in postmortem AD liver and brain [8], our group has recently reported elevations of catD immunoreactivity which correlated with phosphorylated tau and NFT burden [9]. Given that tau and NFT are recognized markers of neurodegeneration [10–12], our postmortem study suggests that catD perturbations are closely associated with brain areas severely affected by AD pathology and neurodegeneration [9].
In addition to postmortem neurochemical studies, the status of blood catD in clinical cases of AD is also of interest. However, findings from clinical studies have been inconsistent, as some groups reported increased concentration of catD in plasma [13] and neural-derived plasma exosomes [14], while others reported decreased catD messenger RNA (mRNA) and protein levels in plasma [15] and blood monocytes [16]. Moreover, although neurodegeneration is a prominent feature of AD, the putative associations between peripheral catD and markers of neurodegeneration have not been explored. More importantly, it is at present unclear whether baseline catD may be associated with longitudinally assessed cognitive decline. Hence, in this study, we measured serum catD in subjects recruited to a longitudinal study of dementia. Furthermore, we investigated catD associations with functional and cognitive decline as well as with neuroimaging markers of neurodegeneration. Given the possible involvement of catD in AD pathophysiology, we hypothesize that alterations of serum catD are associated with, and may reflect, AD dementia and neurodegeneration at baseline, whilst also predicting for cognitive and functional decline.
MATERIALS AND METHODS
Study cohort
Subjects for this study was selected from a longitudinal case-control study performed on a memory clinic cohort in Singapore as previously described [17–19]. Briefly, cases with memory complaints were recruited from memory clinics at the National University Hospital and Saint Luke’s Hospital site whereas controls with no cognitive impairment (NCI) on objective neuropsychological assessments were recruited from the community. A total of 109 subjects (35 NCI; 40 with cognitive impairment no dementia, CIND; and 34 AD dementia) were included in the current study, matched a priori by age and gender. Diagnoses of CIND and dementia were made at regular consensus meetings of study clinicians and neuropsychologists. Subjects were considered to be CIND if they did not meet the Diagnostic and Statistical Manual of Mental Disorders, Fourth Edition (DSM-IV) diagnostic criteria for dementia but showed impairment in at least one out of the seven cognitive domains assessed (see next section), defined by education-adjusted scores≥1.5 standard deviations (SD) below normal established means in more than half of the tests for that domain, as described previously [17]. AD dementia was diagnosed using the National Institute of Neurological and Communicative Disorders and Stroke and the AD and Related Disorders Association (NINCDS-ADRDA) criteria [20]. Domain-Specific Review Board (DSRB) approval for the longitudinal study was obtained from the National Healthcare Group (protocol reference: 2010/00017; study protocol number: DEM4233) with written informed consent from subjects or their primary caregivers in accordance with the Declaration of Helsinki. All clinical, physical, neuropsychological, and neuroimaging assessments were performed at the National University of Singapore.
Cognitive and functional assessments
All subjects underwent cognitive assessments including a comprehensive neuropsychological battery of seven cognitive domains, namely Executive Function, Attention, Language, Visuomotor Speed, Visuoconstruction, Verbal Memory, and Visual Memory [18] (see Supplementary Table 1 for details on the component tests for each domain). In addition, the Mini-Mental State Examination (MMSE) and Montreal Cognitive Assessment (MoCA) were used to assess cognitive function [21], while the clinical dementia rating (CDR) scale was used to assess global functional and cognitive deterioration. A decline in global function and cognition was defined as an increment of≥0.5 points in the CDR sum-of-boxes (CDR-SoB) score between baseline and follow-up visits, as described previously [22].
Brain imaging assessments
Magnetic resonance imaging (MRI) scans were obtained using a 3T Siemens Magnetom Trio Tim scanner with a 32-channel head coil at the Clinical Imaging Research Center of the National University of Singapore. Subjects who had claustrophobia, contraindications for MRI or were unable to tolerate the procedure were excluded from the present analysis. Given our overarching hypothesis that serum catD is associated with AD dementia and neurodegeneration, subjects with significant cerebrovascular disease on MRI identified based on previously defined research criteria [17–19] were excluded in order to rule out potential confounding associations with non-AD or non-neurodegenerative etiologies. The degree of cortical and central atrophy was graded by ventricular and sulcal dilatation respectively on T1-Weighted images and categorized using a 4-point scale (0 –normal, 1 –mild, 2 –moderate or 3 –severe) [23, 24]. Medial temporal lobe atrophy was rated on coronal sections and defined using the 5-point Schelten’s scale (0 –normal, 1 –mild, 2 –mild-moderate, 3 –moderate, 4 –severe) which took into account the width of the choroid fissure, the height of the hippocampus, and the width of the temporal horn [25, 26]. In the analysis, cortical atrophy, central atrophy and medial atrophy was dichotomized into “No Significant Atrophy” (scores < 2) and “Significant Atrophy” (scores≥2) in their respective scales, as previously described [27]. In addition, cortical thickness was measured based on a previously established protocol, of which global cortical thickness was defined as the cortical thickness averaged over the whole cortical surface per participant [28].
Covariates
Medical histories of vascular risk factors such as hypertension, hyperlipidemia, diabetes, and cardiovascular disease were collected and classified as Absent or Present, along with demographic information. Hypertension was defined as systolic blood pressure≥140 mmHg and/or diastolic blood pressure≥90 mmHg, or use of antihypertensive medications. Hyperlipidemia was defined as total cholesterol levels of≥4.14 mM, or on antihyperlipidemic medication. Diabetes mellitus was defined as glycated hemoglobin (HbA1c) of≥6.5%, or on diabetic medication. Cardiovascular disease was classified as a previous history of atrial fibrillation, congestive heart failure and/or myocardial infarction. Apolipoprotein E (APOE) genotyping using DNA extracted from the buffy coat of blood samples was performed as previously described [29] for the determination of APOE ɛ4 carrier status, defined by the presence of at least one APOE ɛ4 allele.
Serum catD measurement
Non-fasting blood was drawn from study participants into serum-separating tubes, followed by centrifugation at 2000 g for 10 min at 4°C. Serum samples were then extracted, aliquoted and stored at –80°C for future use. All samples were subjected to only one freeze-and-thaw cycle. Concentrations of catD were measured in duplicates by sandwiched enzyme-linked immunosorbent assay (ELISA, catalogue number: AB119586 Abcam, Cambridge, UK) as per the manufacturer’s instructions. A seven-point standard curve ranging from 156 pg/mL to 10,000 pg/mL was generated for each assay, and concentrations were read from the standard curve after colorimetric development expressed in ng/mL. All measurements were analyzed blinded to subject characteristics and clinical status.
Statistical analyses
Statistical analyses were performed using SPSS software (version 21, IBM Inc., Armonk, NY, USA). Normality tests were first performed to assess the distribution of each variable. For group comparisons between NCI, CIND, and AD dementia subjects, non-parametric Kruskal-Wallis analyses of variance (ANOVA) with Dunn’s post-hoc tests were used for continuous variables with skewed distribution (age, years of education, and serum catD concentration) while Chi-square tests were performed for categorical variables (gender, APOE ɛ4 carrier as well as the prevalence of hypertension, hyperlipidemia, diabetes, cardiovascular disease). Non-parametric Mann-Whitney tests were also used to compare the serum catD concentration between AD Dementia versus No Dementia (i.e., NCI and CIND) groups, as well as between “Significant Atrophy” versus “No Significant Atrophy” groups (see Brain imaging assessments for definitions). Effect size estimates for the above-mentioned group comparisons were calculated and expressed in terms of eta-squared (η2). Spearman’s correlation analyses were also performed between serum catD concentration and (i) cognitive test scores namely MMSE, MoCA, and CDR-SoB scores and (ii) global cortical thickness.
As catD was not normally distributed (Shapiro-Wilk test p < 0.001, skewness = 3.5, and kurtosis = 16.8), catD levels were log transformed and included as the determinant variable in the regression models. Univariate binary logistic regression analysis with odds ratios (OR) and 95% confidence intervals (95% CI) were first computed for AD Dementia and each demographic factors as the outcome variable. Covariates that were significantly associated with AD at the univariate level were included in subsequent multiple regression models. The same approach was used to examine the associations of catD with global functional and cognitive decline (defined by an increment of≥0.5 points in the CDR-SoB scores between baseline and follow-up visits).
Diagnostic performance of catD were assessed with receiver operating characteristic (ROC) curve analyses, using R (version 3.6.3, The R Foundation) and RStudio (version 1.2, RStudio, USA) with package pROC. Predicted probabilities of the continuous serum catD values in discriminating AD Dementia from No Dementia group (i.e., NCI and CIND) were obtained from binary logistic regression models described above. Area under curves (AUC) and 95% CIs of each ROC analysis were computed using the DeLong method [30], whilst the sensitivity and specificity values were calculated at Youden index thresholds using bootstrap procedures with 2,000 iterations [31]. Models were assessed both with and without adjustments for covariates.
RESULTS
Baseline characteristics of the study cohort
Table 1 shows the demographic and risk factors of the 109 subjects. In agreement with previous studies [29, 33], subjects with AD dementia had fewer years of education and higher prevalence of APOE ɛ4 carrier, hypertension, and diabetes.
Baseline characteristics of the clinical study cohort
AD, Alzheimer’s disease; APOE, apolipoprotein E; CIND, cognitive impairment no dementia; IQR, interquartile range; NCI, no cognitive impairment; n, number of cases; SD, standard deviation. Bold font indicates significant difference (p < 0.05).
Associations between serum catD and AD dementia
As shown in Table 1, subjects with AD dementia had significantly higher serum catD concentrations compared to either NCI or CIND (η2 = 0.08, p = 0.02). Given that there was no significant difference in serum catD levels between NCI and CIND, these cases were grouped together to form the “No Dementia” group for subsequent analyses, with serum catD expectedly showing higher values in the AD Dementia versus the No Dementia group (Fig. 1A, η2 = 0.08, p = 0.005). Similarly, univariate binary logistic regression analyses showed that higher serum catD concentrations were significantly associated with AD dementia (Table 2, OR: 17.68; 95% CI: 2.59–120.57), with results remaining significant even after adjustment for education, hypertension, and diabetes (OR: 10.0; 95% CI: 1.02–97.95). ROC analyses demonstrated that serum catD in the univariate model had an AUC of 0.68 in distinguishing AD Dementia from No Dementia at baseline. The diagnostic performance of catD was significantly improved after covariate adjustment (Fig. 1B, AUC = 0.82; likelihood ratio test, p < 0.001).

Associations of baseline serum catD with AD dementia. A) Bar graph of catD serum concentrations (median±IQR in ng/mL, with colored circles indicating individual measurements) in AD Dementia (n = 28) versus No Dementia (n = 69). B) ROC analyses indicating the diagnostic performance of serum catD in detecting AD dementia, before and after model adjustment with hypertension, diabetes and education (Table 2). **p<0.01 indicates significant differences between groups (Mann-Whitney U tests). ∧p < 0.05 indicates significantly better goodness-of-fit compared to non-adjusted model (likelihood ratio tests).
Associations of baseline serum catD, demographic and disease factors with AD Dementia
AD, Alzheimer disease; APOE, apolipoprotein E; OR, odds ratios; CI, confidence interval. *Binary logistic regression with OR for having AD Dementia (n = 28) as an outcome, using No Dementia group (NCI+CIND, n = 69) as the reference group. Bold font indicates significant association (p < 0.05). The four variables found to be significant at univariate regression was included as covariates in a multiple regression model. aInterpretation: Every unit increase is associated OR times the odds of having AD Dementia compared to No Dementia. bInterpretation: Presence of the factor is associated with OR times the odds of having AD Dementia compared to No Dementia. cInterpretation: Every ten-fold increase is associated with OR times the odds of having AD Dementia compared to No Dementia.
Associations between serum catD and brain atrophy
Serum catD concentrations were significantly higher in subjects with significant central (Fig. 2A, η2 = 0.05, p = 0.04) and cortical atrophy (Fig. 2B, η2 = 0.05, p = 0.03). A similar increasing trend was also observed for medial temporal atrophy although it did not reach statistical significance (Fig. 2C, η2 = 0.03, p = 0.07). In addition, serum catD positively correlated with baseline global cortical thickness (rho=–0.290, p = 0.004), further supporting its associations with brain atrophy.
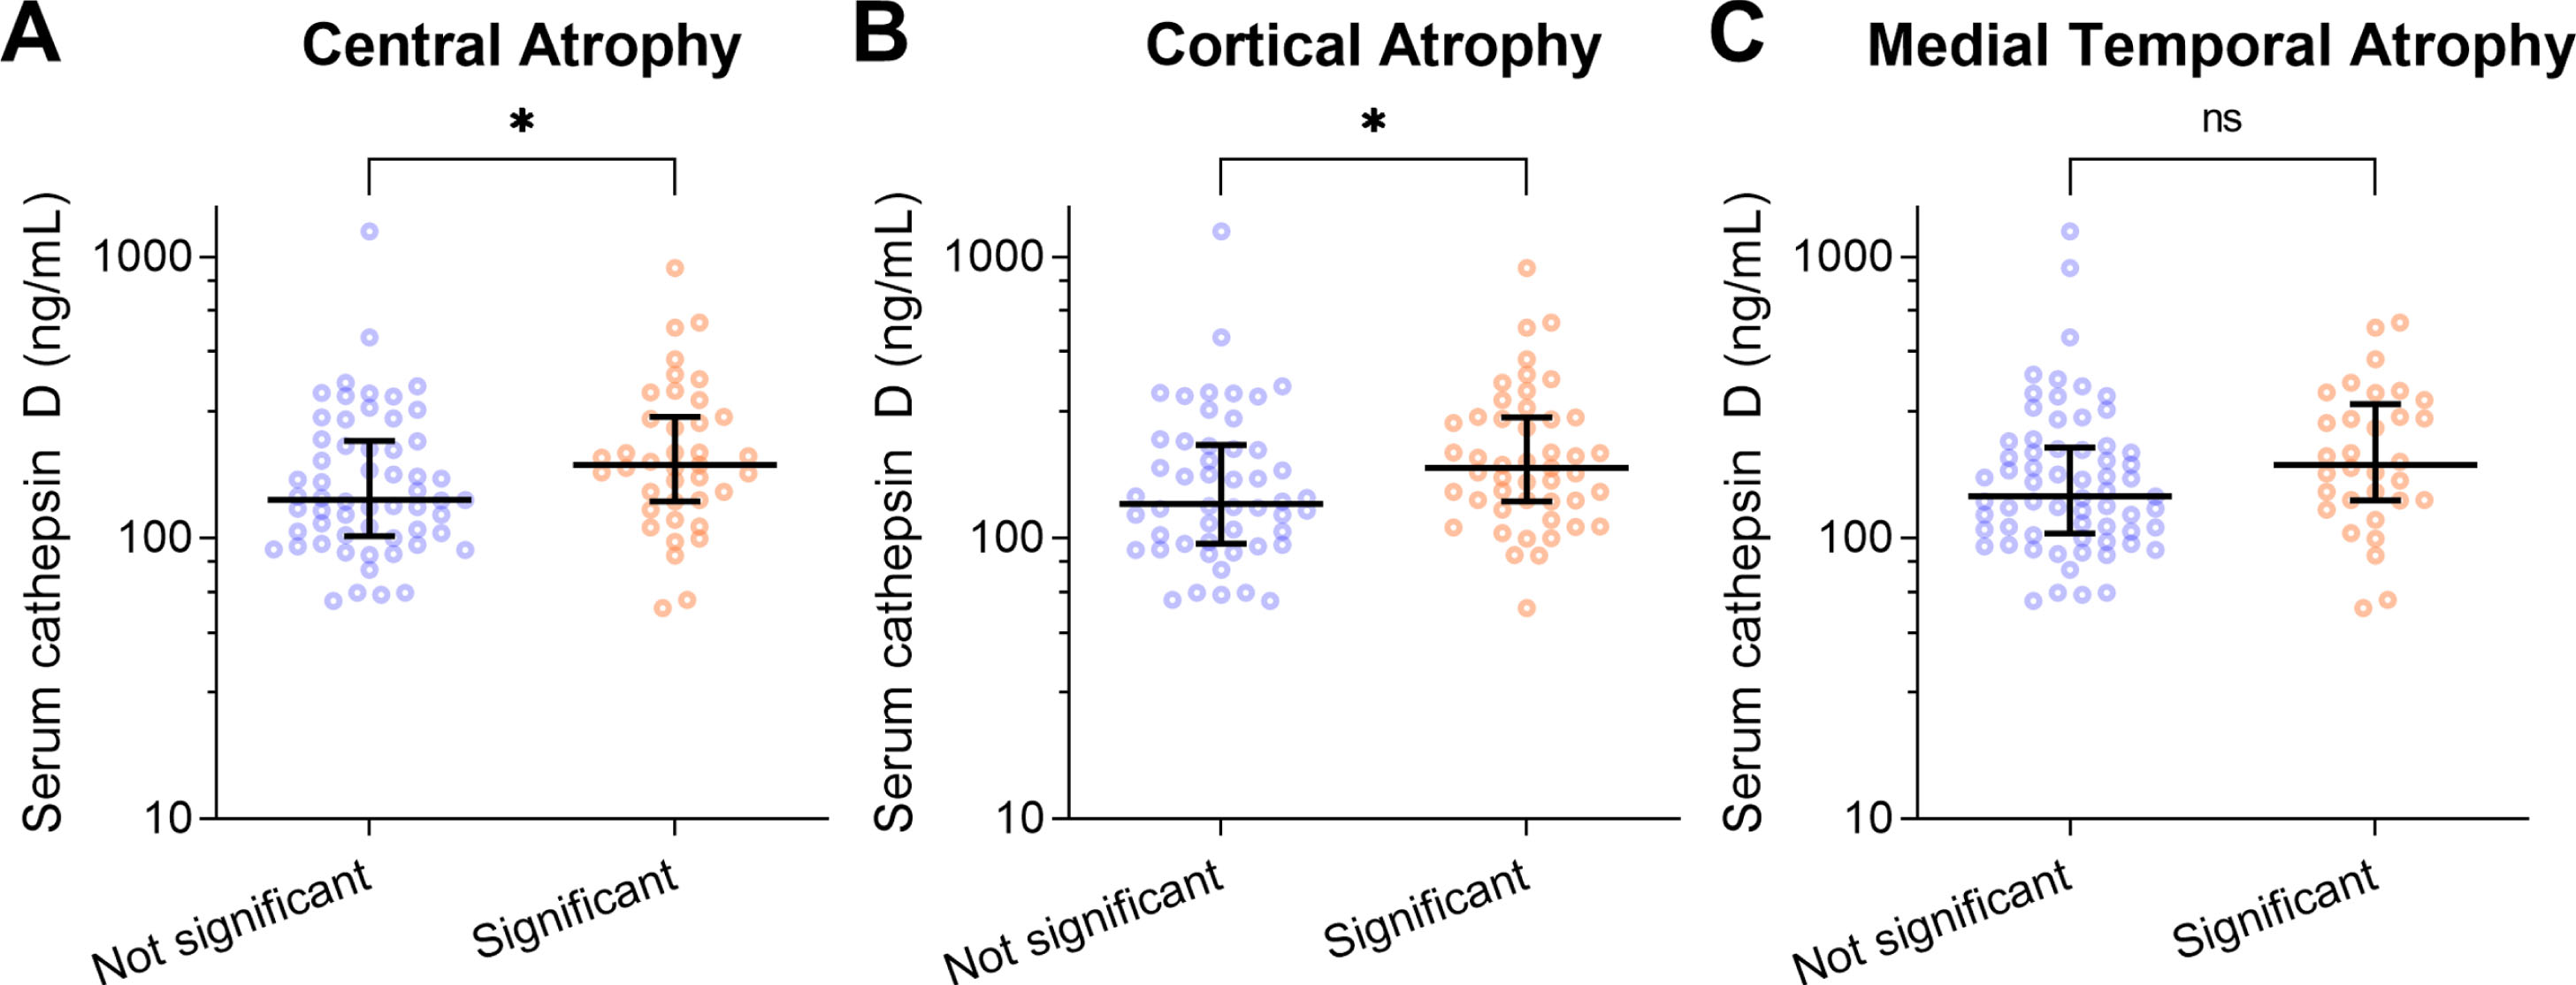
Serum catD concentrations were significantly higher in subjects with significant brain atrophy. Bar graphs of catD serum concentrations (median±IQR in ng/mL, with colored circles indicating individual measurements) in subjects with significant (A) central, (B) cortical or (C) medial temporal atrophy (total n = 97). *p<0.05 indicates significant differences between groups (Mann-Whitney U tests).
Associations between serum catD and cognitive decline
Cross-sectional correlation analyses were performed to examine the potential links between serum catD and clinical assessments of cognition and function. While there were no significant correlations with MMSE (rho=–0.138, p = 0.177) and MoCA (rho=–0.139, p = 0.175) scores, serum catD concentrations were significantly correlated with CDR-SoB scores (rho = 0.251, p = 0.013) at baseline. 72 subjects in the current study were also assessed longitudinally for up to five years (mean follow-up=4.3 years), of whom 34 subjects showed global functional and cognitive declined as measured by an increase of at least 0.5 points in the CDR-SoB scale (thereafter termed as “Decliners”). The majority of the decliners had significant CDR-SoB changes (94% had≥1 points increase, 82% had≥2 points increase) considered to be clinically relevant among cognitively impaired and AD patients [34].
As shown in Fig. 3A, serum catD concentrations were found to be significantly higher in Decliners compared to Non-decliners (Mann-Whitney U tests, p < 0.05). Further binary logistic regression analyses in Table 3 also showed significant associations between higher serum catD concentrations and functional and cognitive decline both before (OR: 14.1; 95% CI: 1.80–110.52) and after adjustment for hypertension and diabetes (OR: 9.94; 95% CI: 1.02–97.34). Finally, ROC analyses demonstrated that serum catD had moderate diagnostic performance in detecting Decliner status (AUC = 0.68), which was significantly improved with covariate adjustment (Figure 3B, AUC = 0.75; likelihood ratio test, p = 0.01).

Associations of baseline serum catD with cognitive and functional decline. A) Bar graph of catD serum concentrations (median±IQR in ng/mL, with colored circles indicating individual measurements) in subjects with functional and cognitive decline (i.e., decliner, defined as an increase of ≥0.5 points in the CDR-SOB scale with a mean follow-up of 4.3 years, n = 34) versus Non-decliner (no CDR-SOB increase, n = 38). B) ROC analyses indicating the diagnostic performance of serum catD in detecting functional and cognitive decliners, before and after model adjustment with education and diabetes (Table 3). **p<0.01 indicates significant differences between groups (Mann-Whitney U tests). ∧p < 0.05 indicates significantly better goodness-of-fit compared to non-adjusted model (likelihood ratio tests).
Associations of baseline serum catD, demographic and disease factors with functional and cognitive decline
AD, Alzheimer disease; APOE, apolipoprotein E; OR, odds ratios; CI, confidence interval. *Binary logistic regression with OR for having functional and cognitive decline (defined as an increase of≥0.5 points in the CDR-SOB scale with a mean follow-up of 4.3 years, n = 34) as an outcome, using Non-decliners (no CDR-SOB increase, n = 38) as the reference group. Bold font indicates significant association (p < 0.05). Data was not available for 25 subjects. The three variables found to be significant at univariate regression was included as covariates in a multiple regression model. aInterpretation: Every unit increase is associated OR times the odds of having functional and cognitive decline compared to Non-decliners. bInterpretation: Presence of the factor is associated with OR times the odds of having functional and cognitive decline compared to Non-decliners. cInterpretation: Every ten-fold increase is associated with OR times the odds of having functional and cognitive decline compared to Non-decliners.
DISCUSSION
In this study of a well-characterized, longitudinally followed-up cohort of subjects with cognitive impairment and dementia, we showed that serum catD was significantly increased in AD dementia compared to the No Dementia group, and further demonstrated for the first time a link between increased serum catD at baseline and neuroimaging assessed brain atrophy. Moreover, we found that serum catD associated with global cognitive and functional decline at up to five years follow-up. Taken together, our results further support a putative pathophysiological link between catD alterations and AD-related neurodegeneration previously suggested by our group and others [8, 13–15], as well as the potential utility of serum catD as biomarkers.
Given the lysosomal localization of cathepsins including catD, the detection of serum catD suggests a leakage of lysosomal catD into the systemic circulation. Because catD is known to play an important role in protein degradation and clearance of pathogenic peptide aggregates in AD [3, 35], our observations of catD upregulation in the brain [9] as well as in the periphery in this study may thus suggest its involvement in a perturbed endo-lysosomal degradation pathway in AD [36, 37]. Our current observations are in line with previously reported findings in cerebrospinal fluid [38], neural-derived exosomes in blood [14], as well as plasma [13]. However, it is worth noting that a few studies reported decreased, rather than increased peripheral catD as well [15, 16], and the factors underlying these differences are currently unclear.
Our findings of correlations between catD and cognitive decline as well as with brain atrophy provide a potential mechanistic link between neurodegeneration associated with abnormal peptide aggregation and subsequent loss of cognitive function. Indeed, several studies had suggested close links between tau pathology and brain atrophy in AD. For example, clinical studies showed that while tau on positron emission tomography (PET) imaging was associated with worse cognitive performance and brain atrophy including grey matter atrophy [39, 40], it may be a strong predictor of longitudinal atrophy as well [40]. Similarly, Aβ positivity on PET was also shown to be associated with brain atrophy and cognitive decline [41, 42]. Interestingly, our research group had previously reported a positive correlation between catD protein expression and NFT in AD postmortem brain, highlighting the relationship between catD and tau-affiliated neurodegeneration [9]. Moreover, an in vivo study [35] has shown that genetically knocking out catD expression resulted in increased levels of neurotoxic tau species known to be associated with hallmark pathologies of AD such as NFTs [43]. Furthermore, the loss of catD has been reported to lead to lysosomal abnormalities and dysfunction [44], suggesting that catD has cytoprotective functions and is required for normal lysosomal function. In the context of our study, the increased catD levels found in AD may thus be a purported compensatory mechanism in response to the accumulation of protein aggregates found in AD. While further study is needed to elucidate the roles played by catD in the pathways underlying AD neurodegeneration, our findings demonstrated the potential utility of serum catD as a diagnostic biomarker for AD dementia and associated neurodegeneration, as well as a prognostic biomarker for cognitive decline.
The strengths of this study include: 1) a well-characterized prospective clinical study cohort with both cross-sectional and longitudinal data available; 2) inclusion of covariates such as age, gender, APOE ɛ4 carrier, hypertension, diabetes, and cardiovascular diseases in analyses to account for potential confounders; and 3) use of neuroimaging platforms to detect and quantify neurodegeneration. However, this study has several limitations. Firstly, while we observed longitudinal associations between serum catD and cognitive decline, the follow-up neuroimaging data is currently unavailable, and we are at present unable to directly attribute the observed cognitive changes to underlying neurodegeneration. Secondly, as the original aim of this study was to follow up postmortem findings to look at purported blood catD alterations in neurodegenerative dementias, we excluded from the study cohort all subjects with significant cerebrovascular disease. However, as catD has also been implicated in endothelial dysfunction as well as in atherosclerosis, heart failure and related cardiovascular disease [45–49], and given that the cardiovasculature is anatomically and physiologically closely linked to the cerebrovascular system [50], further studies focusing on catD in cerebrovascular diseases and vascular cognitive impairment should be carried out.
In conclusion, this study showed that serum catD is a potential blood-based biomarker for AD dementia, cognitive decline, and brain atrophy. Our study builds on postmortem findings implicating catD in the neurodegenerative process of AD. Future studies are needed to delineate the mechanisms underlying catD upregulation, as well as validate its use as biomarker for AD or neurodegeneration-related cognitive decline.
Footnotes
ACKNOWLEDGMENTS
This work was supported by the National Medical Research Council (MOH-000500-01, MOH-000707-01 to CPC, MKPL; NMRC/CG/M006/2017 to CPC). YLC is a recipient of a Post-Doctoral Fellowship from the Yong Loo Lin School of Medicine (NUSMED/2021/PDF/05).
The authors would like to thank the patients and their families for their participation in this study.