
Abstract
Background:
Alzheimer’s disease (AD) is a neurodegenerative disorder with homogenous disease patterns. Neuropathological changes precede symptoms by up to two decades making neuroimaging biomarkers a prime candidate for early diagnosis, prognosis, and patient stratification.
Objective:
The goal of the study was to discern intermediate AD stages and their precursors based on neuroanatomical features for stratifying patients on their progression through different stages.
Methods:
Data include grey matter features from 14 brain regions extracted from longitudinal structural MRI and cognitive data obtained from 1,017 healthy controls and AD patients of ADNI. AD progression was modeled with a Hidden Markov Model, whose hidden states signify disease stages derived from the neuroanatomical data. To tie the progression in brain atrophy to a behavioral marker, we analyzed the ADAS-cog sub-scores in the stages.
Results:
The optimal model consists of eight states with differentiable neuroanatomical features, forming two routes crossing once at a very early point and merging at the final state. The cortical route is characterized by early and sustained atrophy in cortical regions. The limbic route is characterized by early decrease in limbic regions. Cognitive differences between the two routes are most noticeable in the memory domain with subjects from the limbic route experiencing stronger memory impairments.
Conclusion:
Our findings corroborate that more than one pattern of grey matter deterioration with several discernable stages can be identified in the progression of AD. These neuroanatomical subtypes are behaviorally meaningful and provide a door into early diagnosis of AD and prognosis of the disease’s progression.
Keywords
INTRODUCTION
Alzheimer’s disease (AD) is a neurodegenerative disorder and the most common type of dementia [1]. Symptoms of patients with AD range from cognitive decline like memory loss or language problems to psychiatric symptoms like depression or personality changes [1]. However, neuropathological changes precede noticeable symptoms by up to two decades [2–5]. First affected by brain atrophy are the hippocampus (Hip) [6] and the entorhinal cortex (EC) [7], which is often not noticed due to missing symptoms [8]. Therefore, the onset of the disease can be noticeable years before it is officially diagnosed. As the disease progresses, the atrophy spreads across the cerebral cortex, especially the medial temporal lobe [9].
Most commonly, AD is diagnosed with the National Institute of Neurological and Communicative Disorders and Stroke (NINCDS)-Alzheimer’s Disease and Related Disorders Association (ADRDA) criteria [10]. Those suggest that patients with signs of dementia but without causes for other types of dementia are diagnosed with probable AD [11], which results in a heterogeneous disease pattern [12]. The heterogeneity adds to the challenge of early diagnosis and the development of effective treatments [13, 14].
To deal with heterogeneity in the AD population, researchers stratify patients based on cognitive abilities and disabilities [15, 16] or brain atrophy [17, 18] for a snapshot in time. Furthermore, they describe different subtypes of AD regarding the progressive decline in cognitive functions [19–21] or changes in a variety of cognitive and physiological markers [22] based on differential disease progression over time. However, those approaches often rely on one point in time as a baseline, e.g., the time of official diagnosis or the start of the study. To bypass the necessity of defining a baseline time when modeling longitudinal data, stochastic models such as Hidden Markov Models (HMMs) [23] can be utilized to model different disease states. Those states may reflect the development of a disease in terms of severity. Still, since the states are not necessarily linearly ordered, these models inherently allow parallel routes of disease progression, which can be interpreted as several progression paths. Clinical data is not ideally suited for HMMs due to often incomplete records and irregular visits [24, 25] and have therefore been used less frequently in modeling AD. The few existing models bypassed these issues by constraining the structure of the model to six successive states [26] or discarding records with missing values [27], which leads to further reduction of often already small clinical data sets. Two more current studies modeled the heterogeneity in the progression of AD either using HMM based on a mixed set of behavioral and neuroimaging markers [13] or using another stochastic modeling approach based on structural brain markes [28].
The goal of the current study was to find intermediate disease stages of AD progression based on the structure of selected brain regions typically involved in the disease. With the anatomical data included, we expected to capture the heterogeneity in the spatial spread of brain atrophy. Differential decline in some cortical and subcortical grey matter regions is expected based on the heterogeneity of symptoms found in AD patients [29]. Subtyping patients based on the neurodegenerative progress can help, on the one hand, with the prognosis of symptoms and progression, and on the other hand, in developing specialized treatments for the different subgroups [30]. For a complete picture, we included subjects irrespective of their diagnosis (healthy controls (HC)/mild cognitive impairment (MCI)/AD). Furthermore, no constraints were imposed so the model could learn its structure from the given data set. To tie the progression in brain atrophy to a rich behavioral set of markers, we analyzed the subjects’ the Alzheimer’s Disease Assessment Scale –cognitive (ADAS-cog) 11 [31] subscores in the different disease stages. The potential differential behavioral of the subtypes based on grey matter atrophy strengthens the relevance of the subgroups and the heterogeneity found in previous studies [13, 28]. Analysis of neurophysiological markers from cerebrospinal fluid (CSF) [32] and positron emission tomography (PET) [33] that have been discussed as biomarkers for AD diagnosis round off the description of the progression of the subtypes.
MATERIALS AND METHODS
Participants and data
Data
Data used in the preparation of this article were obtained from the Alzheimer’s Disease Neuroimaging Initiative (ADNI) database (https://adni.loni.usc.edu) in October 2018. ADNI was launched in 2003 as a public-private partnership led by Principal Investigator Michael W. Weiner, MD. The primary goal of ADNI has been to test whether serial magnetic resonance imaging (MRI), PET, other biological markers, and clinical and neuropsychological assessment can be combined to measure the progression of MCI and early AD.
Anatomical data
Grey matter changes caused by AD can be detected by structural MRI (sMRI) [34]. In ADNI, two sagittal T1-weighted 3D magnetization-prepared rapid gradient-echo imaging (MP-RAGE) scans are available for each subject. For ADNI-1, subjects were scanned with 1.5T MRI at each time point, whereas subjects enrolled in ADNI-GO and ADNI-2 were scanned at 3T.
For the modeling procedure in this study, only markers from sMRI were chosen due to their high spatial resolution and diagnostic ability [35] without radiation exposure of the subjects. The used data was preprocessed and quality checked by the Mayo Clinic [36]. Preprocessing steps included correction for non-linearity of gradients and intensity non-uniformity. Furthermore, cortical reconstruction was performed [37] with motion correction, removal of non-brain tissue, Talairach transformation, segmentation of grey matter and white matter, and intensity normalization using FreeSurfer [37] and a longitudinal image processing framework [38]. The reconstruction concluded with cortical parcellation using the Desikan-Killiany atlas [39]. This atlas differentiates 34 cortical regions of interest (ROIs) in each hemisphere. Further, 40 subcortical regions were defined [40]. The volume was calculated for each cortical and subcortical region. Additionally, the surface area, cortical thickness (CT) average, and CT standard deviation were computed for the 68 cortical regions. Finally, visual quality control was performed by summarizing the regions into eight larger areas and ranking them based on their quality as ‘pass’ or ‘fail’. The overall quality is determined by the quality of the regions and can have values like ‘pass’, ‘fail’, ‘partial’, and ‘hippocampus only’ [37].
Cognitive data
Each subject who participated in ADNI underwent comprehensive neuropsychological testing to evaluate the cognitive state at each visit. Since other tests like the Mini-Mental State Examination (MMSE) and the Clinical Dementia Rating (CDR) are also used to assess dementia in general, only the ADAS-cog 11 [31] score is used in this study. It consists of eleven subscales, testing different cognitive functions to evaluate the severity of cognitive dysfunction of persons with AD on a fine-grained level. The total ADAS-cog score sums up to 70 points and is composed of the errors a subject made, where a worse cognition is represented by a higher score [41]. The original ADAS-cog is suitable for assessing AD severity, whereas it is not ideal for measuring pre-dementia states [42].
Neurophysiological data
To round off the description of the disease progression assessed with this study, we selected some neurophysiological markers from CSF and PET. The most promising markers for diagnosing Alzheimer’s disease from CSF are levels of amyloid-β (Aβ), tau, and phosphorylated tau (p-tau) [32, 43]. The PET protocols for the ADNI cohorts changed over time but [18F]fluorodeoxyglucose (FDG-PET) has been used for all cohorts and [18F]florbetapir (AV45-PET) has been introduced with ADNI2/ADNI-GO [44] as amyloid imaging agent. Both PET protocols provide promising biomarkers for AD diagnosis [33]. PET data has been processed by the ADNI PET QC team and one marker for FDG-PET has been extracted from the average PET signal of angular, temporal, and posterior cingulate as well as one marker for AV45-PET as the average AV45 signal from frontal, anterior cingulater, precuneus, and parietal cortex relative to the cerebellum [44].
Selection of the study cohort
For this study, subjects were selected based on the availability of at least one sagittal T1-weighted MP-RAGE scan processed with FreeSurfer and ADAS-cog 11 subscores for at least three visits, including the baseline visit. One year was chosen as the interval between visits. The scans had to have an overall quality rank of ‘partial’ or ‘pass’. If more than one scan was available for a data point, i.e., one visit of a subject, only the scan with the best quality rank was chosen. If those scans were of equivalent quality, the scan closer to the one-year interval was chosen. After excluding data points at the beginning and the end of a sequence of visits, because of low-quality images or missing values in the ADAS score, subjects with less than three visits were excluded as well.
Following these criteria, 1,017 subjects from three to a maximum of eleven visits were included in this study (Table 1). Altogether, 4,383 data points containing high-quality processed images and complete ADAS-cog scores were included in the study.
Subjects were not chosen based on their genetic disposition, diagnosis, or progression; therefore, HCs, as well as MCIs and ADs, are included. Subjects were defined as AD patients if they had an MMSE score of 20 to 26 inclusive, a CDR score of 0.5 or 1, and met the NINCDS-ADRDA criteria for probable AD [36, 45]. Subjects with an MMSE score of 24 to 30 inclusive, a CDR of 0.5, and a memory complaint measured by education-adjusted scores on the Wechsler Memory Scale Logical Memory II, but no other signs of cognitive impairment or dementia were diagnosed as MCI. If a participant had an MMSE score of 24 to 30 inclusively, a CDR of 0, and no signs of depression, MCI, or dementia, they were defined as HC [36]. A detailed description of subject characteristics can be found in Table 2.
Sequences of included patients (N = 1,017, total number of data points / visits = 4,383)
Sequence length is defined as the number of visits for consecutive years for which anatomical and cognitive data is available.
Subject characteristics of included patients (N = 1017). Values are represented as mean±SD or count. Ranges are depicted as [minimum, maximum], percentage in %
AD, Alzheimer’s disease; MCI, mild cognitive impairment; HC, healthy control.
Feature engineering
To mitigate the curse of dimensionality [46], volume features from subcortical areas (amygdala (AM), Hip), and thickness features of cortical regions (parahippocampus (PHip), EC, precuneus (PreC), inferior temporal cortex (IT), middle temporal cortex (MT)) were selected based on recent studies on discrimination between HC, MCI, and AD (Table 3). The subcortical and cortical measures were not separated since both combined achieved better results [47]. Features were selected from both hemispheres for symmetrical reasons, even if only one side is considered relevant. These procedures led to 14 anatomical features that were used for the modeling (7 brain regions×2 hemispheres). Volume values were normalized to the intracranial volume estimated by FreeSurfer to correct for subjects’ varying head sizes and surface values normalized to the whole brain surface. All values were min-max-scaled to a range of zero to one. Missing values within subjects’ sequences of visits were interpolated linearly.
List of anatomical regions considered most discriminant between HC, MCI, and AD. Function indicates their commonly assumed functions [48]
AD, Alzheimer’s disease, MCI, mild cognitive impairment; HC, healthy control.
Hidden Markov Models
An HMM was used to model the progression of AD as a Markov chain from an observed output sequence of measurements at each visit, i.e., the anatomical features, with the underlying disease states as hidden states. These hidden states are characterized by one distribution, each with different parameter values [63]. Since the data features in this study are continuous, a Gaussian HMM was trained with the scikit-learn package hmmlearn.
Model parameters
A given number of states connected by transition probabilities characterize an HMM. Since these states are hidden, they can only be observed through sequences of observations emitted with a certain emission probability [65]. Furthermore, each HMM is characterized by an initial state distribution, which determines the probability of starting in a particular state. The emission probability is only used to train the model, whereas the transition probabilities are analyzed subsequently. The initial probability was computed but not investigated further since the sample is not representative of the overall population. Instead, one part of the study cohort was explicitly recruited because they were already diagnosed with AD.
The Baum-Welch algorithm [66], the state-of-the-art expectation-maximization algorithm to train HMMs, was used to solve the training problem. No constraints regarding the number of states were imposed, and parameters were assigned random initial values to ensure that the model learns only from given data, not assumptions. A convergence threshold of 0.01 was used for all generated HMMs to end the training iterations.
The decoding of the HMM, i.e., the translation from observation sequences to state sequences, was conducted with the Viterbi-Algorithm [67]. It was used because of its efficiency over comparing the likelihood of possible hidden state sequences.
Model selection
To avoid overfitting, i.e., generating a model with no more states than true states exist [68], it is not advisable to choose the number of hidden states solely based on the computed loglikelihood. Since no assumptions were made in advance regarding the number of hidden states, multiple HMMs were generated with numbers of states ranging from two to fifteen. To select the most suitable model, a stability approach from cluster analysis was adapted [69]. This is a novel approach for HMMs but well suited for the problem since stable, homogenous clusters of the data points should define the states of the disease. The selected stability measure is based on distances between cluster patterns. This means that a model is generated with the same data set but various random initial seeds so that different patterns of clusters can emerge and be compared to each other. In this study, models with ten random initial seeds were generated. It is assumed that the more stable the clustering solution, the closer it is to the true number of underlying clusters. This measure was chosen since the loglikelihood of the models was too large to use common selection methods like cross-validation, regularization, and Bayesian integration [70]. The data set used for training was decoded, so that each observation is assigned a discrete hidden state. Afterwards, the adjusted rand score [71] from scikit learn, a measure for the similarity between two cluster patterns, was selected to compare designated states. Next, the median and interquartile range (IQR) of the adjusted rand scores for each number of states was calculated, and the model with the highest stable number of hidden states was selected. Since even in models with a stable state number not all states are completely similar, the final model was selected by majority vote of the models. Finally, the states of the chosen models were ranked by descending mean normalized thickness and volume values and renumbered accordingly.
Model description
The transitions between states of the model were characterized via the p-values of Welch’s t-test [72] between data points that changed states and data points that stayed in the same state because of the unequal sample sizes (cutoff value <0.05, Bonferroni corrected). The comparisons between states were conducted via Student’s t-tests on a significance level of p < 0.001 (uncorrected).
RESULTS
Model selection
The models with up to eight states converge to the same states independently of their initial seeds (Fig. 1); Hence, we chose eight states as most suitable for the data. Models with more than eight states lead to unstable state generation, i.e., overfitted models stuck in local optima.
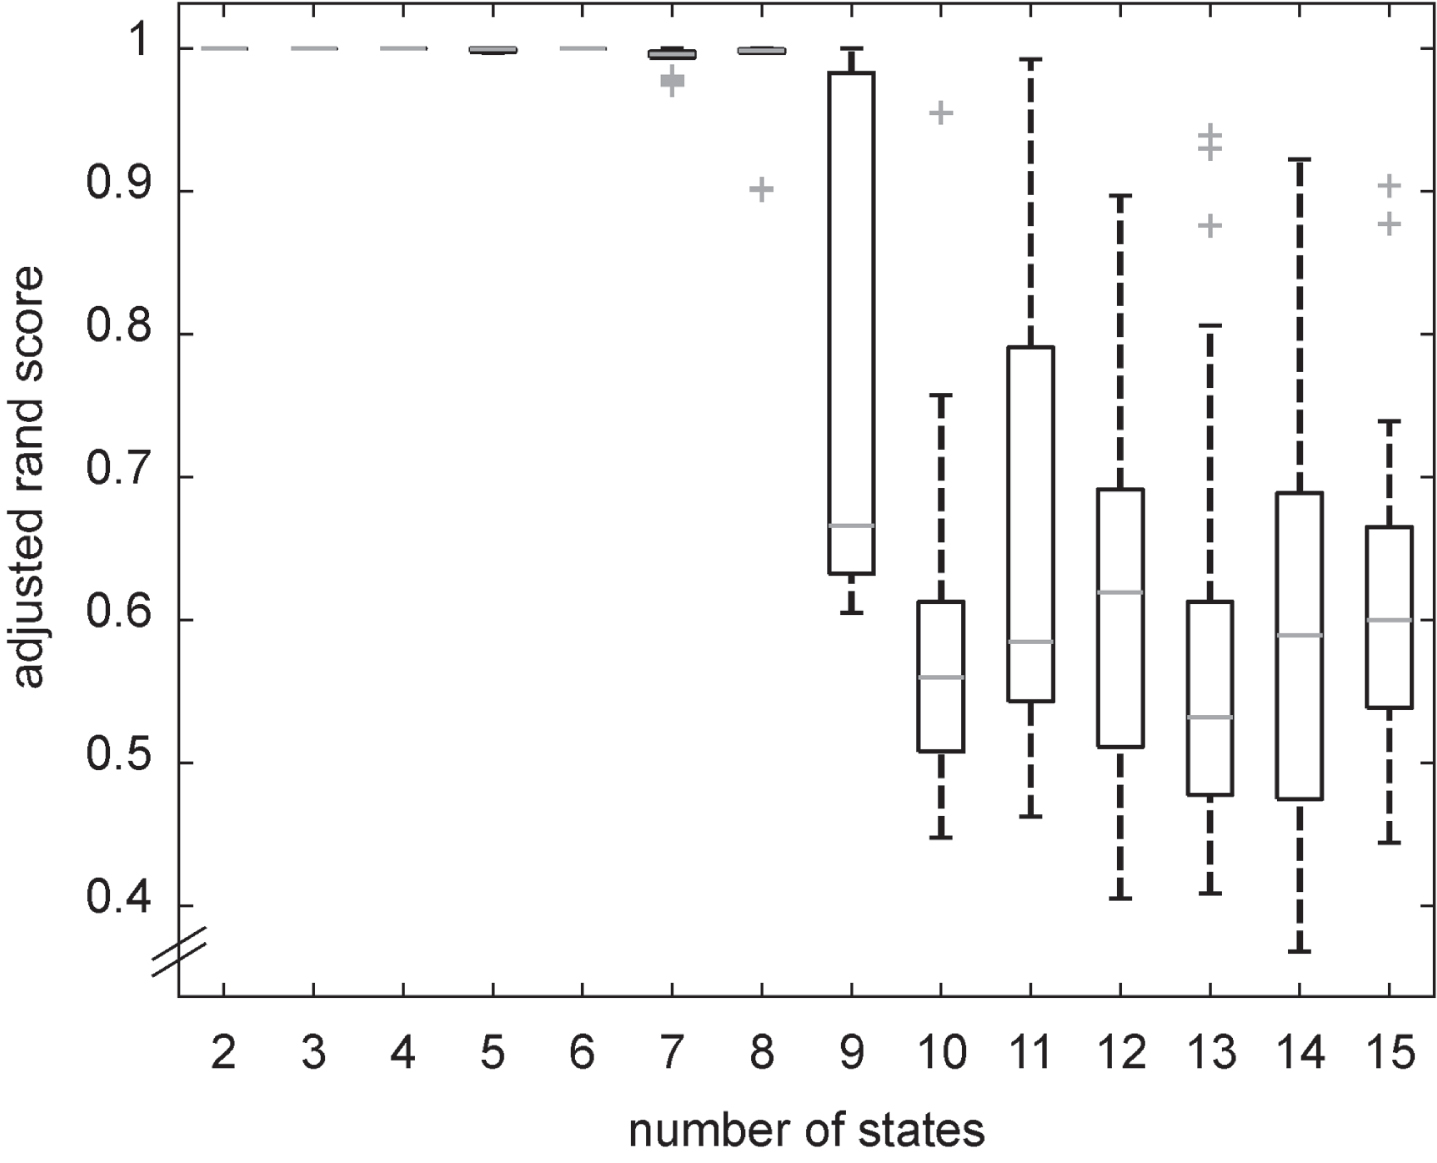
Adjusted rand scores for the models with an increasing number of states. Data points outside of the 1st / 3rd quartile±1.5 * IQR are depicted as outliers.
Model overview
The optimal model forms two parallel routes crossing once at a very early point and merging at the final state (Fig. 2). States 0 and 2 can be defined as the initial states of two routes characterized by continuously decreasing grey matter. The route starting at state 2 (Fig. 2, top) is characterized by an early decrease mainly in the limbic regions (AM, Hip, PHip, EC). We coin this one the limbic route. Because the route starting with state 0 (Fig. 2, bottom) is characterized by early and sustained atrophy mainly in the non-limbic cortical regions (PreC as well as IT and MT), we call this one the cortical route. There is one early crossing from the limbic to the cortical route when only considering transition probabilities >5%. However, when the cutoff probability is lowered to >1%, we also find three crossings from the cortical to the limbic route (Supplementary Figure 1).
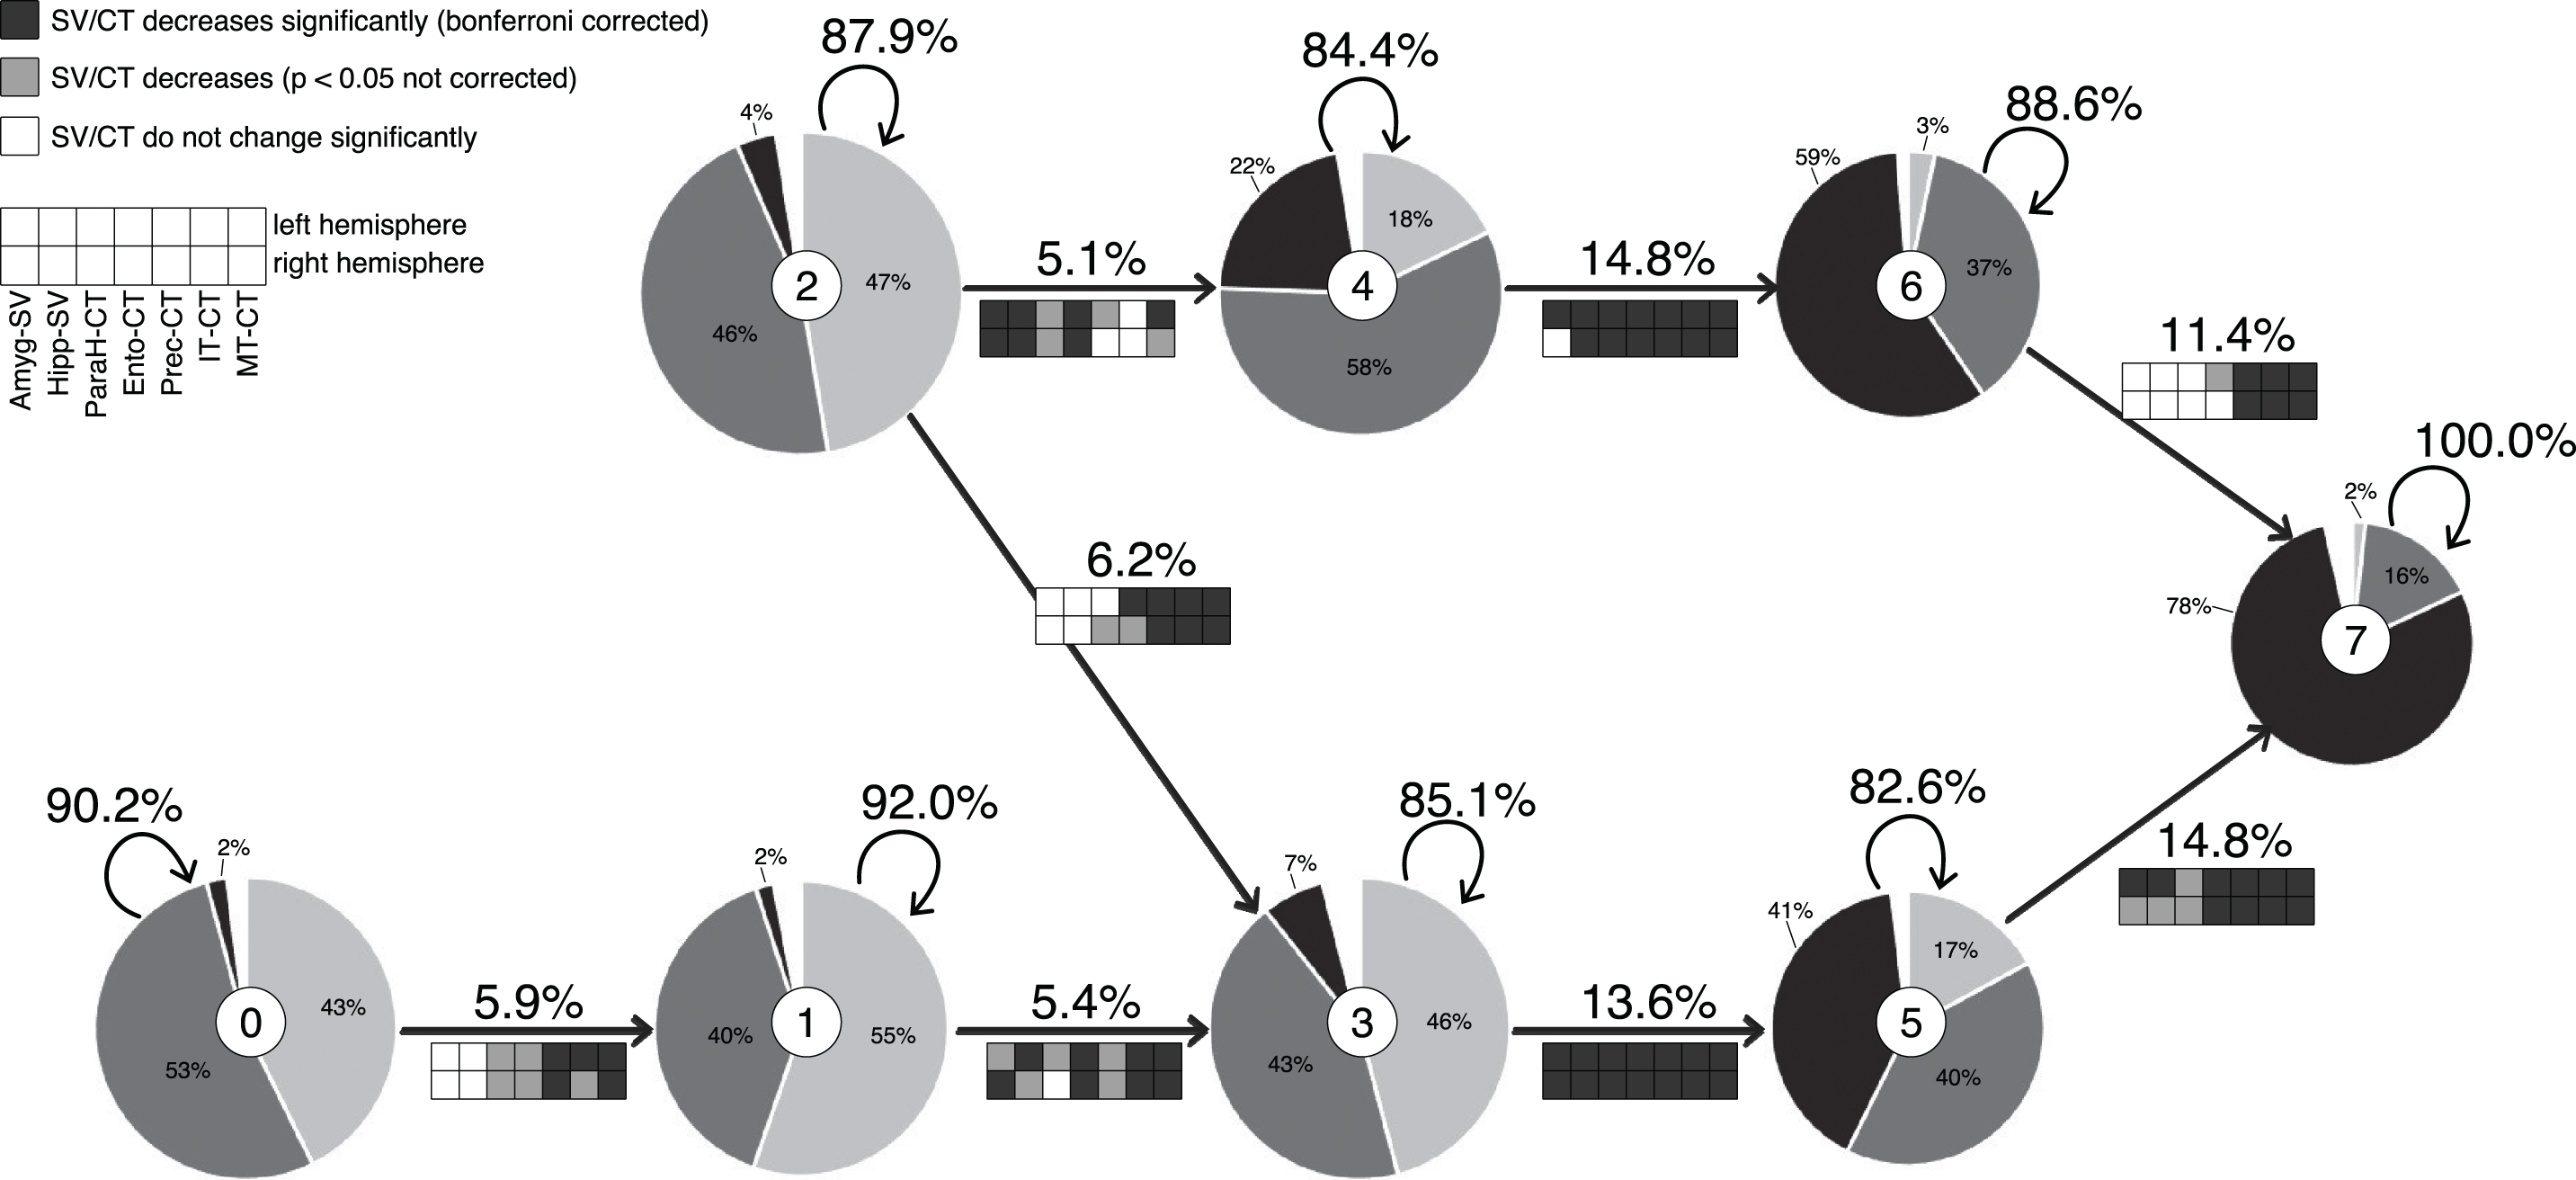
Visualization of the model with the corresponding state number in the middle circle of each state. The radius of each state corresponds to the number of data points. Pie charts depict the ratio of HC (light grey), MCI (dark grey), and AD (black) diagnoses. Arrows depict transitions with corresponding transition probabilities (cutoff: 5%) and indicate feature changes between stages (for t-values, see Supplementary Table 1). SV, subcortical volume; CT, cortical thickness; AM, amygdala; Hip, hippocampus; PHip, parahippocampus; EC, entorhinal cortex; PreC, precuneus; IT, inferior temporal cortex; MT, middle temporal cortex.
State 2 (n = 792) is the initial state of the limbic route. Its subjects, who experience mainly decrease in the non-limbic regions, cross over to the cortical route via state 3, while those who experience mainly decrease in limbic regions progress to state 4 (n = 532). Grey matter of subjects switching to state 6 (n = 423) from state 4 decreases significantly in all regions but the left PHip. The subjects finally transitioning from state 6 to state 7 are mainly characterized by decreasing CT in the non-limbic regions.
State 0 (n = 648) is the initial state of the cortical route. Subjects who switch to state 1 (n = 600) from here are mainly characterized by decreasing cortical thickness in the non-limbic regions. Subjects switching to state 3 (n = 643) from state 1 experience increasing brain atrophy in all regions but most prominently in the lateral temporal areas and the EC. Grey matter of subjects switching to state 5 (n = 648) from state 3 decreases significantly in all regions. Subjects transitioning to the final stage 7 (n = 277) from stage 5 experience increasing brain atrophy in all regions but most prominently in the non-limbic regions and the EC.
Even though the overall structural integrity of the grey matter in state 0 is higher than in all other states, more than half of its subjects were already diagnosed with MCI and even 2% with AD. In contrast, even though the overall structural integrity of grey matter in state 7 is worse than in all other states, we still find 16% of the subjects only diagnosed with MCI and even 2% as healthy. Even though there is a tendency for more healthy controls in the early states and more AD subjects in the later states, we did not find clear segregation of diagnoses by our states (Fig. 3). Furthermore, we find significantly differentiable distributions of diagnoses between the limbic and the cortical routes (
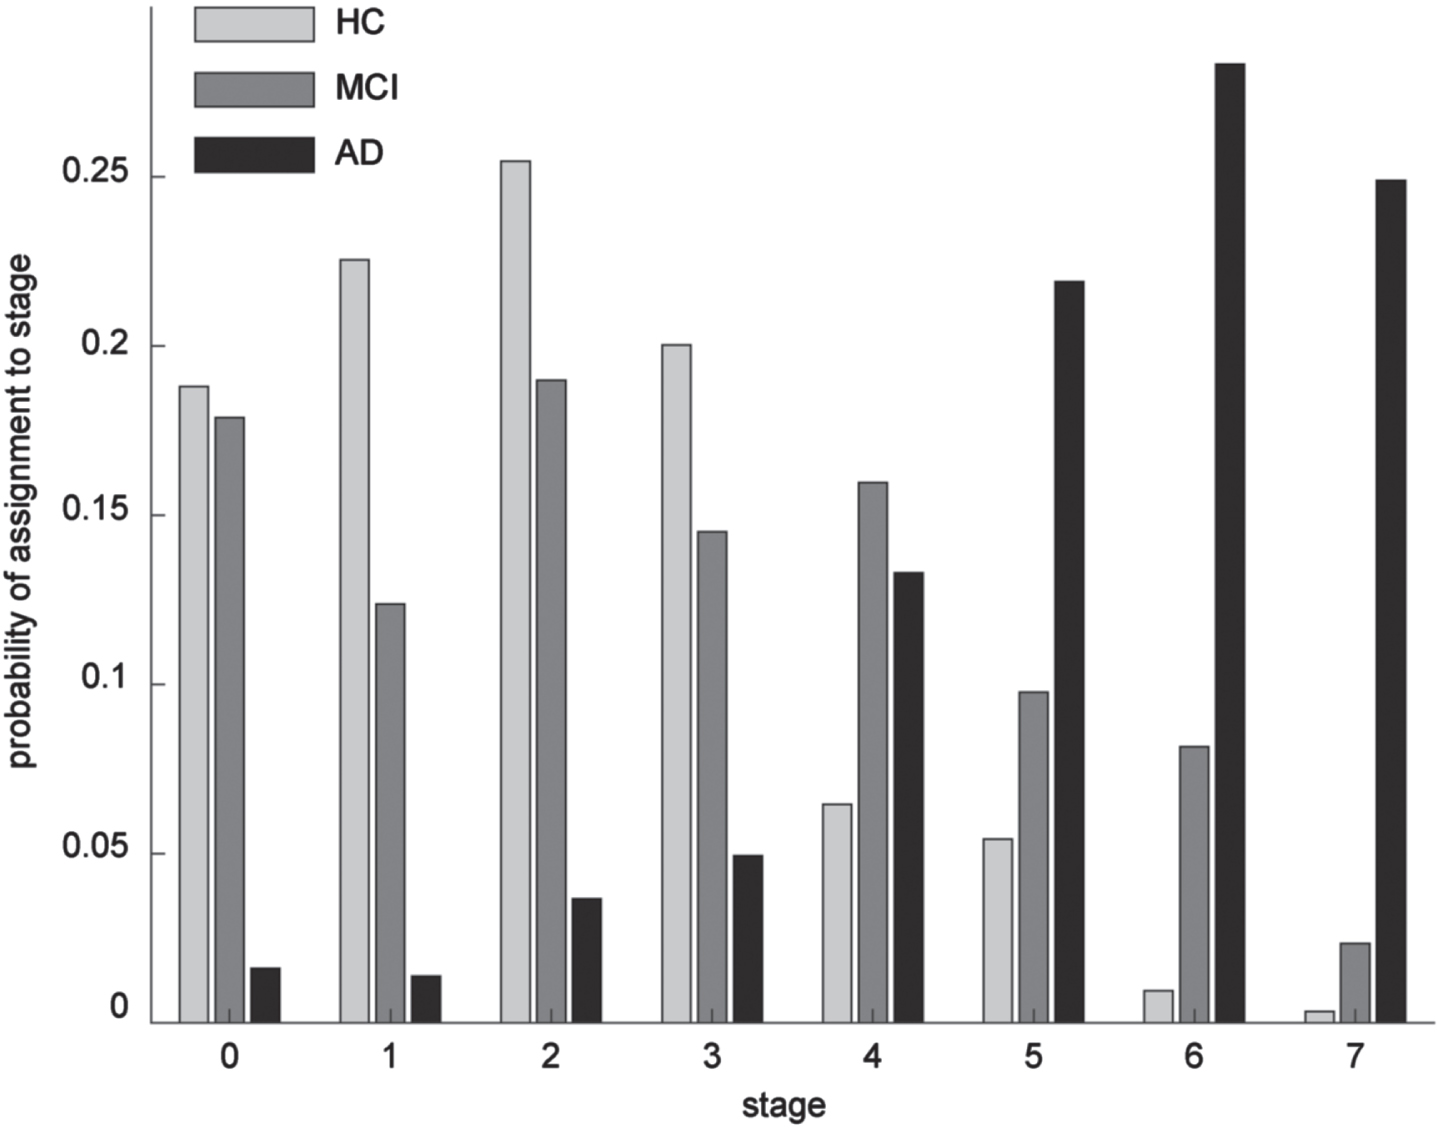
Probability of assigning a subject with a given diagnosis to one of the eight stages of the model.
Along this line, carriers of two APOE E4 alleles are sign. overrepresented in the limbic route compared to the cortical route (53/25 subjects;
Development of grey matter atrophy
To further characterize the routes that lead to the final state with a high probability of an AD diagnosis, we compared the “corresponding” states of the two routes with each other (Fig. 4). The two routes can easily be differentiated by all seven brain regions, but we find a clear distinction between limbic and non-limbic regions. The limbic regions of subjects traversing the limbic route are significantly smaller or thinner, respectively than those of subjects following the cortical route (Fig. 4A-D) and vice versa for the non-limbic regions (Fig. 4E–G).
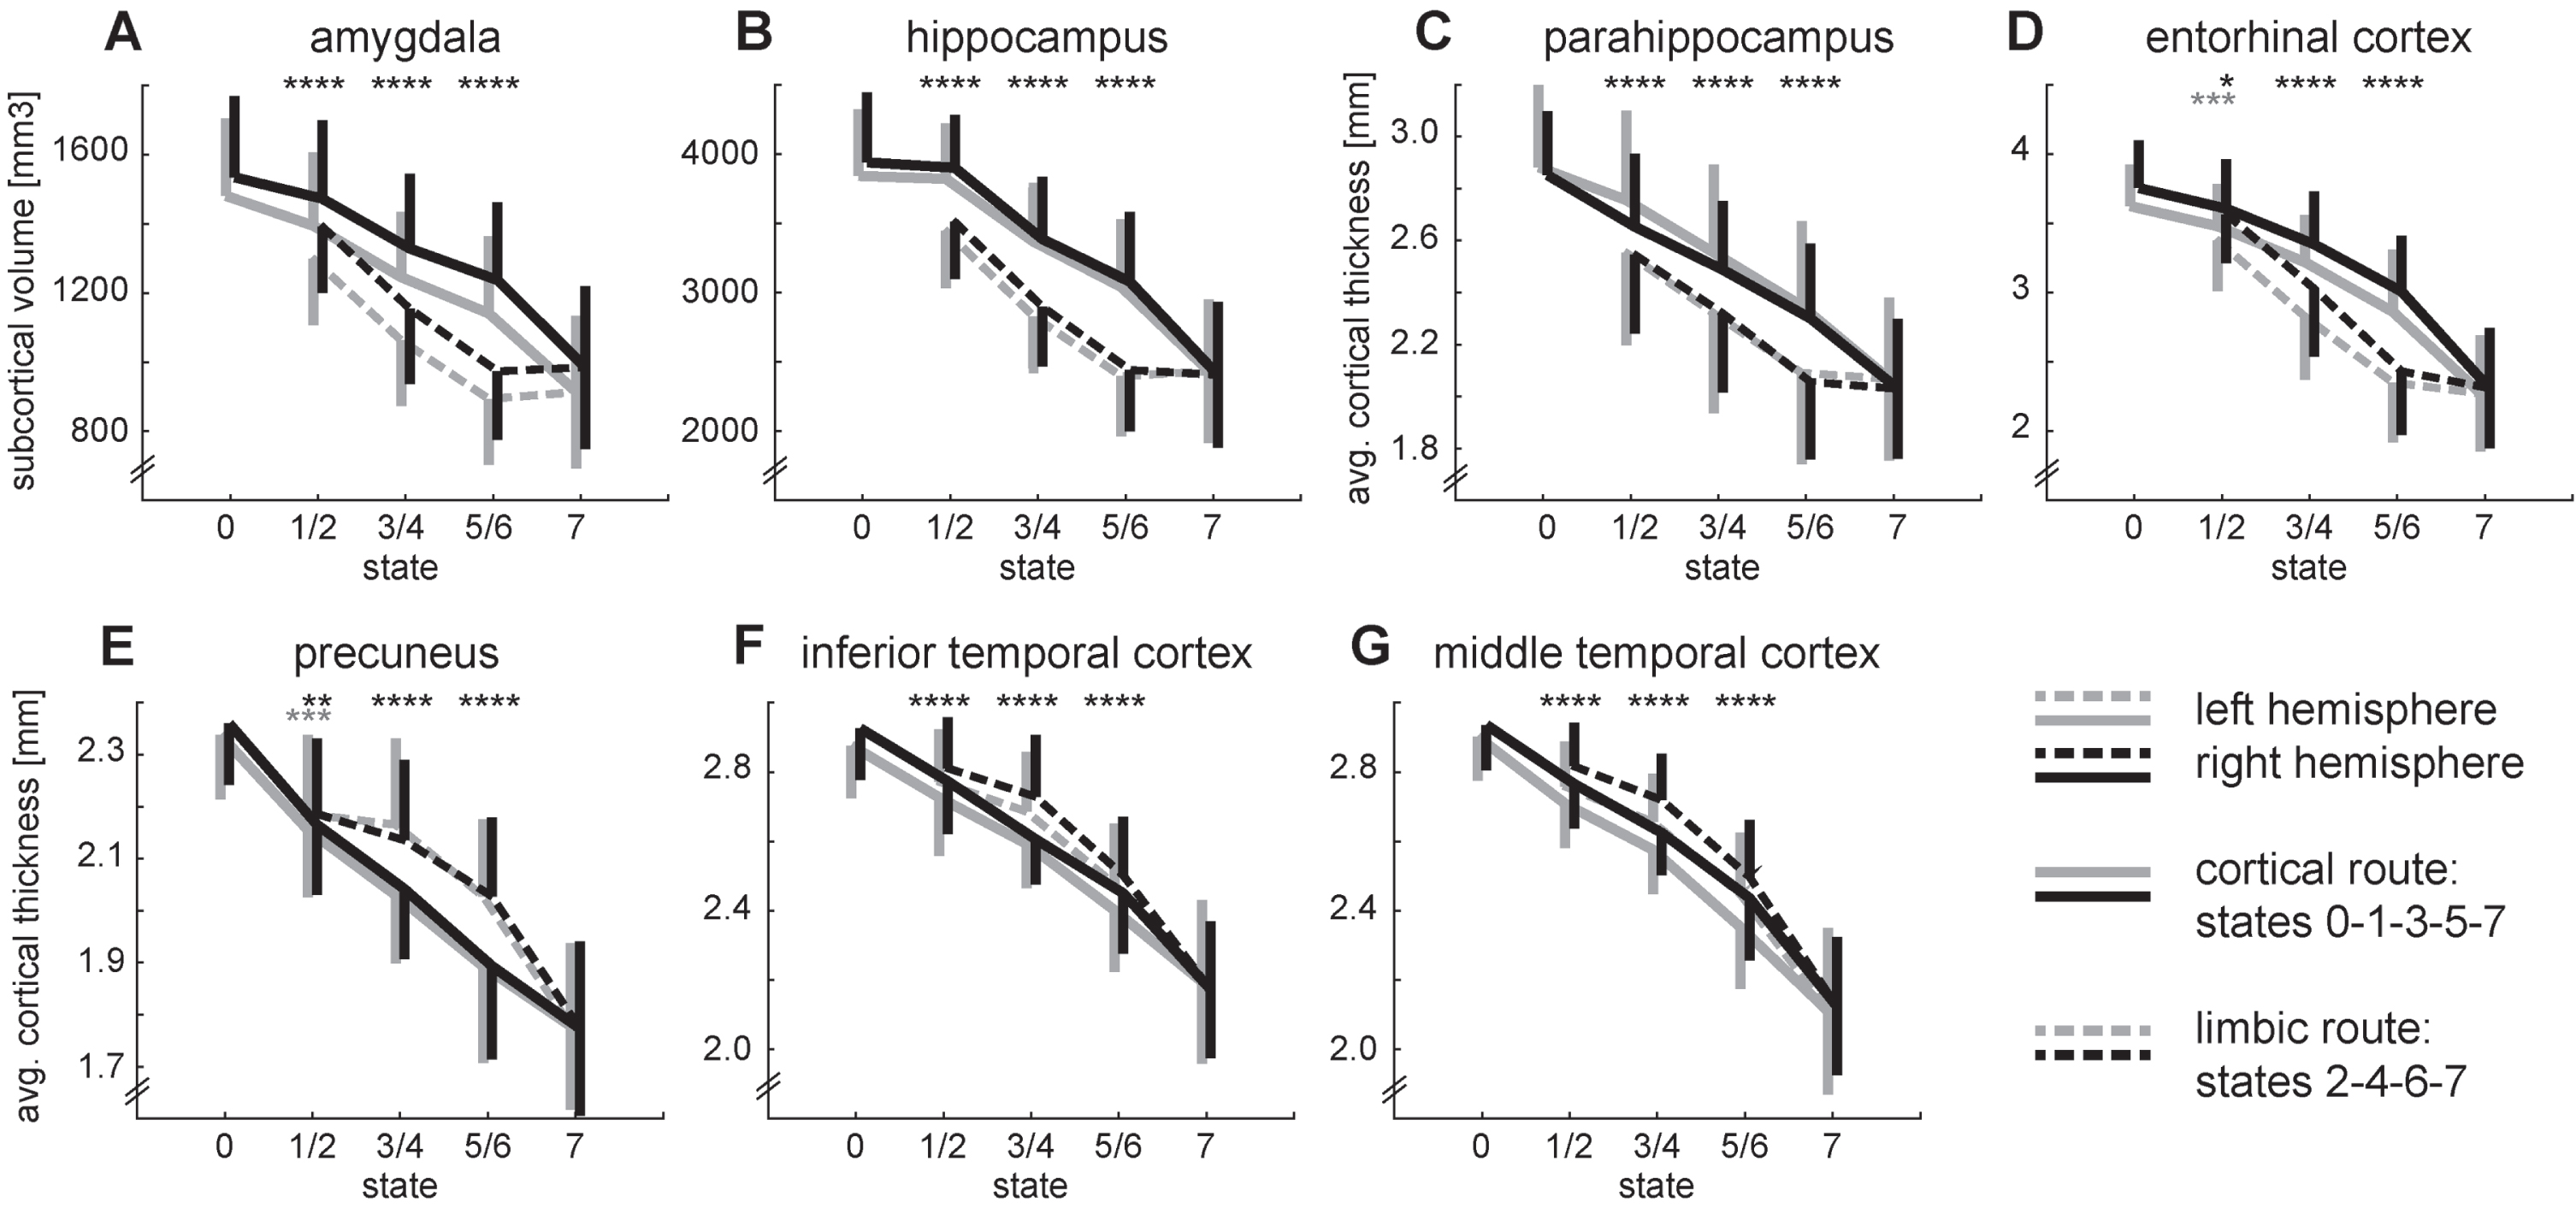
Development of grey matter atrophy for all brain regions. The top row (A–D) shows the regions of the limbic system. The bottom row (E–G) shows the remaining cortical regions. The transition from state 2 to 3 is omitted for clarity. Error bars depict symmetrical standard deviations but are only depicted for one side for clarity. Two-sided t-tests between states 1/2, 3/4, 5/6: ****p < 0.001 for both hemispheres, ***p < 0.001 for the left hemisphere, **p < 0.01 for the right hemisphere, *p < 0.05 for the right hemisphere.
Development of cognition
Overall cognitive impairment is significantly higher in the limbic route than in the cortical route (total ADAS-cog score; t3371 = 7.678; p < 0.001). Cognitive differences between the subjects traversing the two routes are most noticeable in the memory domain, with subjects from the limbic route experiencing stronger memory impairments (Fig. 5). We find significant differences for at least two comparisons for the ADAS subscores of word recall (Q1), orientation (Q7), and word recognition (Q8). A similar albeit weaker differentiation presents itself for the remaining memory subscore recall instructions (Q9) with a difference between states 3 and 4 (t1173 = 2.806; p = 0.005). Three language subscores show a similar differentiation between states 3 and 4: naming (Q5; t1173 = 4.010; p < 0.001), word finding (Q11; t1173 = 5.123; p < 0.001), and comprehension (Q12; t1173 = 2.067; p = 0.039). Finally, we find a stronger cognitive decline in the praxis domain for the subjects on the limbic route for ideational praxis (Q6) for the comparison between states 3 and 4 (t1173 = 2.682; p = 0.007) as well as states 5 and 6 (t889 = 2.372; p = 0.018).
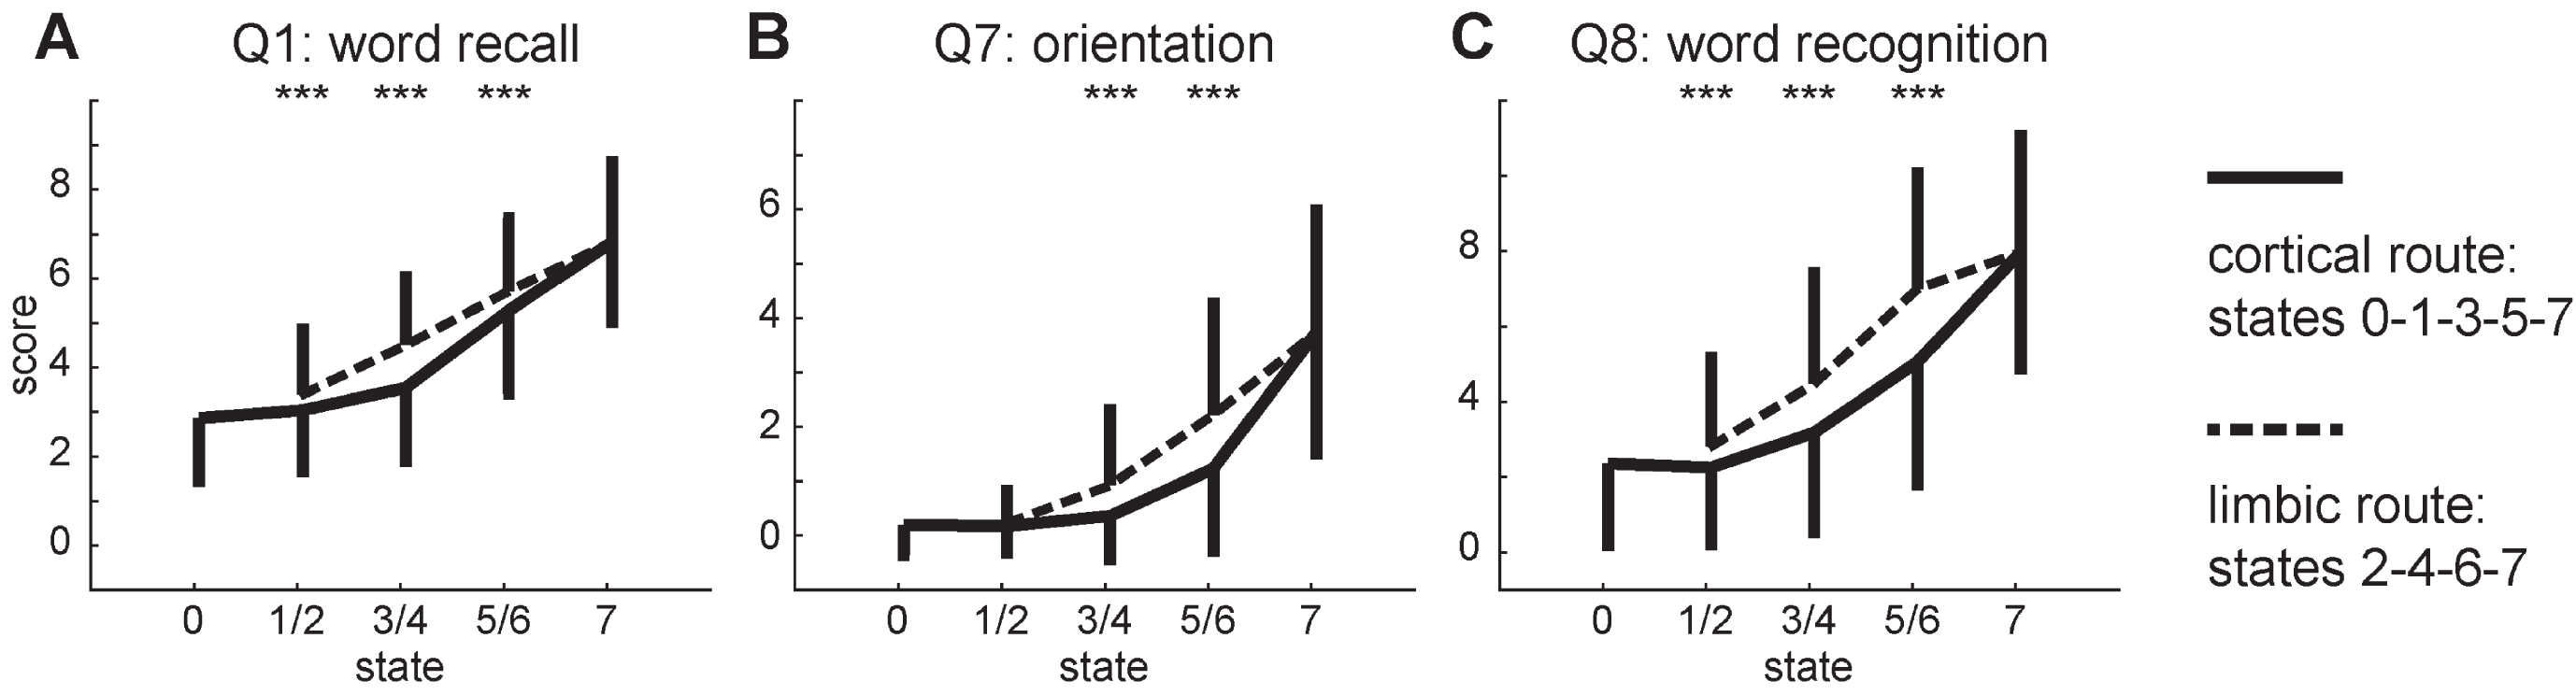
Development of the three ADAS-cog subscores that differ most between the two routes of the model. The transition from state 2 to 3 is omitted for clarity. Error bars depict symmetrical standard deviations but are only depicted for one side for clarity. Two-sided t-tests between states 1/2, 3/4, 5/6: ***p < 0.001.
Two subscores show the opposite pattern with stronger impairment of subjects traversing the cortical route. We find a differentiation between states 5 and 6 for commands (Q2; t889 = 3.884; p < 0.001) in the language domain and construction (Q3; t889 = 2.315; p = 0.021) from the praxis domain. The subscores for spoken language (Q10) do not differentiate between the two routes at all.
Development of neurophysiological markers
CSF and PET markers were not obtained for all subjects and time points. Therefore, our analysis of the neurophysiological markers is based on only one third of the data points (30.34% / 35.95% / 35.95 % / 46.41% / 27.09% for abeta / tau / p-tau / FDG / AV45). Aβ levels are significantly lower in the first two states of the limbic route than in the corresponding states of the cortical route (Fig. 6A). For both tau levels we do not find significant differences between the two routes. Analogue to Aβ levels, we find significant reduction in FDG uptake for the first two states of the limbic route compared to the cortical route (Fig. 6B). Finally, amyloid concentration in the brain assessed with AV45-PET starts with a similar disadvantage of the subjects in the limbic route but the differences between routes later become inconclusive (Fig. 6C).
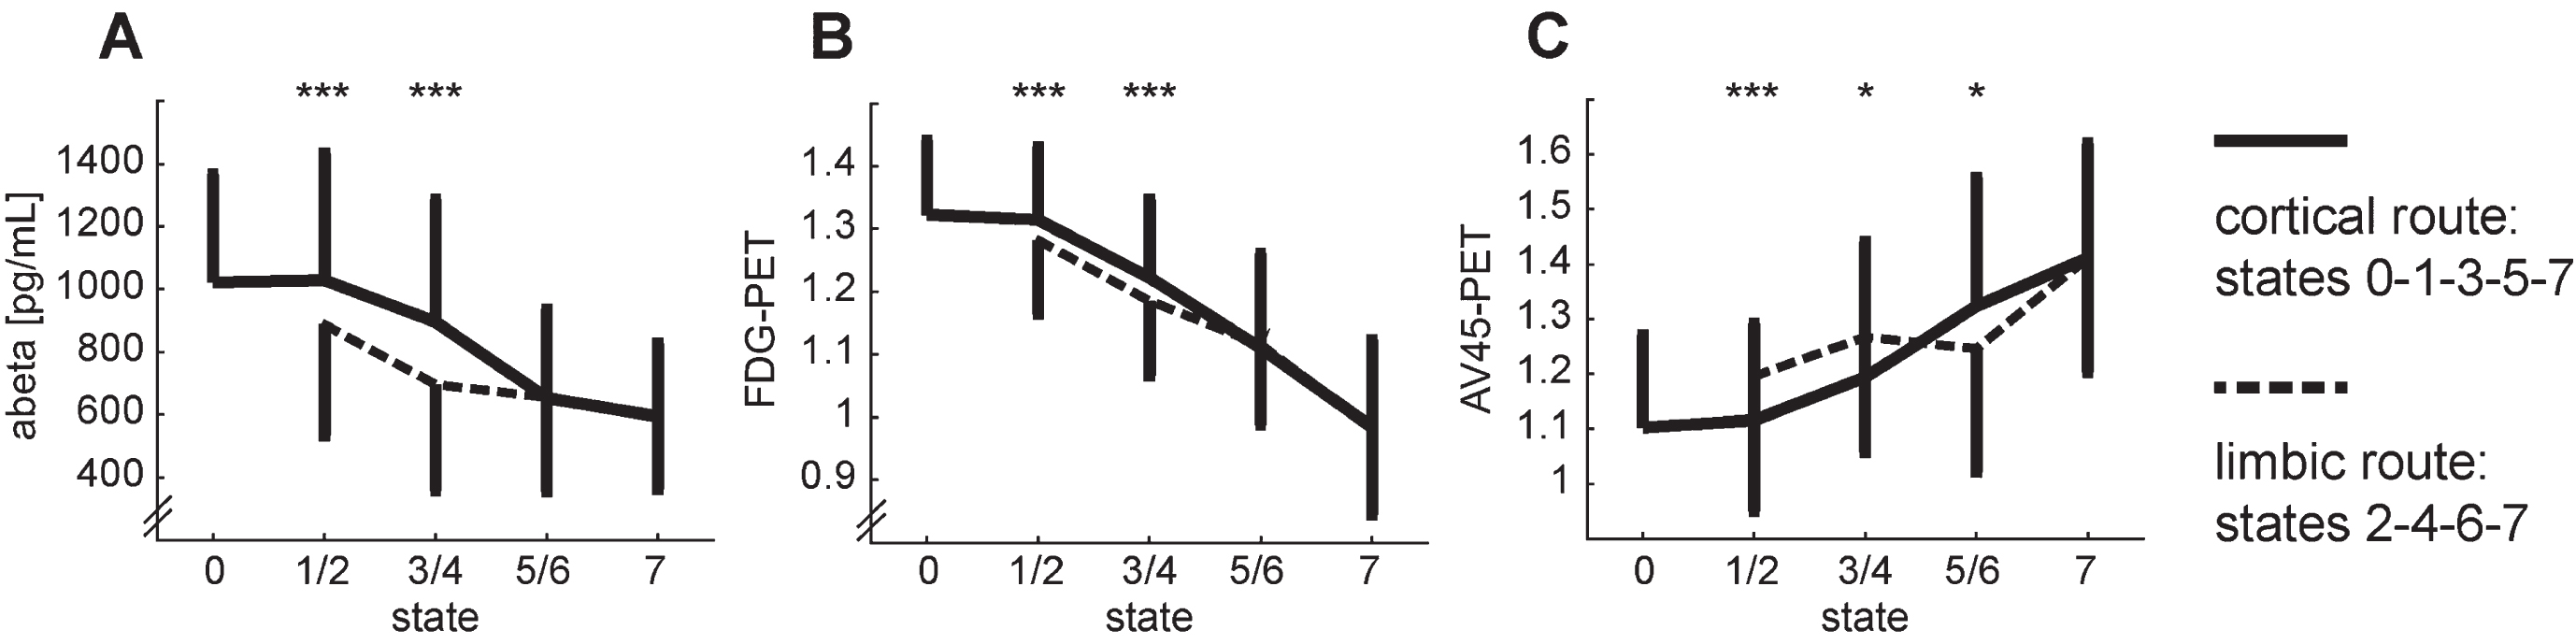
Development of the neurophysiological markers that differ between the two routes of the model: abeta (A), FDG-PET (C), and AV45-PET (C). The transition from state 2 to 3 is omitted for clarity. Error bars depict symmetrical standard deviations but are only depicted for one side for clarity. Two-sided t-tests between states 1/2, 3/4, 5/6: ***p < 0.001, *p < <0.05 (n.s.).
DISCUSSION
Modeling the progressive spread of grey matter atrophy with 1,017 subjects of the ADNI cohort leads to eight states with differentiable neuroanatomical features. This unconstrained modeling approach revealed more than the three disease stages that are usually included in a diagnosis-based progression of AD: healthy, mild cognitive impairment, and finally, AD. Even though there is a higher proportion of diagnosed AD patients in the later states, we find subjects with all diagnoses in each state. Furthermore, we do not find a single consistent spreading pattern but can differentiate disease courses based on a set of neuroanatomical markers with two parallel routes crossing once at an early point and merging at the final state. On both routes, grey matter atrophy is constantly increasing. The limbic route is characterized by early grey matter decrease mainly in the limbic regions (hippocampus, amygdala, parahippocampus, entorhinal cortex). In contrast, the cortical route is characterized by early and sustained atrophy mainly in the non-limbic cortical regions (precuneus as well as inferior and middle temporal cortex). All anatomical regions included discriminate the two routes very well throughout the progression. The limbic regions of subjects traversing the limbic route are significantly smaller or thinner than those of subjects traversing the cortical route and vice versa for the non-limbic regions. Overall, cognitive performance is worse in the subjects on the limbic route than in the ones on the cortical route, but the detailed pattern of cognitive sub-functions mirrors the specific regional atrophy underlying the two routes.
The limbic route of our model matches the dominant view of AD progression with early atrophy in the hippocampus and entorhinal cortex, spreading through the medial temporal lobe and finally to other cortical regions [6, 54]. Accompanying early decrease in CSF Aβ levels [73], glucose metabolism [74], and to a smaller degree early increase in PET Aβ concentration [73] complete the picture of the ‘typical’ AD progression. A specific cognitive decline accompanies the differential development of grey matter atrophy. The subjects traversing the limbic route are significantly more impaired in various memory tasks. This is consistent with the prominent role of the hippocampus [6], parahippocampus [75], and entorhinal cortex [76] in memory. As the core structure of emotion processing, the amygdala complements the memory-processing regions by storing emotional experiences [77]. The higher impairment in the memory domain might also explain the significantly higher proportion of AD diagnoses in the limbic route since diagnostics is mainly driven by memory function. The significantly higher proportion of carriers of two APOE E4 alleles in this route is consistent with the prominent role APOE E4 as major risk factor for AD [78].
In contrast, the cortical route is characterized by early atrophy in cortical regions. Grey matter decline in those regions is usually assumed to start later than the decline in limbic regions [9]. However, two routes with differentiable involvement of hippocampus atrophy have been proposed before [13, 28]. Overall, the cognitive performance of subjects in the cortical route is better, except for the ADAS-cog tasks command and construction. This specific cognitive decline fits the brain regions affected in the cortical route. The precuneus and the inferior temporal cortex are involved in visuospatial processing and visual representation, respectively [79, 80], which are necessary skills for the construction task. The middle temporal cortex is a likely candidate for the impairment in the commands task due to its involvement in accessing word meaning [81].
Our findings support the heterogeneity of AD progression suggested before [13, 28]. Goyal et al. [13] trained an HMM on clinical, biochemical, demographic, and neuroimaging biomarkers. This approach also resulted in two routes of progression that differed in hippocampal volume as well as CSF and PET Aβ. Interestingly, the differences in the amyloid markers between groups relative to the difference in hippocampal volume were switched for our model. However, Goyal et al. [13] included those markers in the model while they serve only as additional descriptors for our subtypes. Other structural anatomical markers than the hippocampal volume, however, were not included in their model; hence we add with our results the tracking of the spatial progression of the disease. On the other hand, Young et al. [28] performed their analysis on similar structural anatomical markers as our study but used a different modeling approach. They discerned three subtypes of AD patients with differential spread of grey matter atrophy with their typical subtype showing parallels to our limbic route and their cortical subtype showing parallels to our cortical route. The third subtype cannot be mapped with our model since we chose only seven anatomical key regions as features. In addition to the two previously mentioned studies, we investigated the detailed cognitive performance of the subjects. Even though this data was specifically excluded from our modeling process, the adequate cognitive performance of subjects traversing the two routes of our model suggests behavioral relevance of the two routes of brain atrophy. Taken together, our work strengthens the hypothesis of differential AD progression based on physiological changes and complements the few existing studies on this topic.
All three studies based on longitudinal physiological data from the ADNI dataset [13, 28], and or own, find clear intermediate disease stages that are not captured by the current diagnostic procedure, nor do they identify the different types of progression that these studies distinguish. Furthermore, finding subjects of all three diagnoses in all states of our model and the models of the previous studies suggests that more detailed diagnostic categories might be preferable to avoid rather heterogeneous physiological and behavioral populations described by the same diagnostic category. However, a long way of research is still ahead to clearly separate the subtypes, to diagnose, and to treat them adequately. In the early states of our model, we find mainly subjects without AD diagnosis, but the states already provide prognostic capacity. This means that based on the structural integrity of only seven key regions in the brain, we can provide the probability of a person proceeding to AD via the limbic or the cortical route. Our findings add to previous research [13, 28] that AD can be detected earlier than it is in current clinical practice. Therefore, to identify AD patients early, a more comprehensive assessment needs to be performed, even with or rather especially with patients having atypical symptoms that are not driven by memory loss.
The model proposed in this study is based on seven subregions of highly preprocessed anatomical brain data only. To provide a more complete picture of AD progression, it is necessary to consider more brain regions and other physiological markers as well. Adding more brain regions might further differentiate the two routes as demonstrated by Young and colleagues [28] and may add further stages as well. However, it lies in the nature of clinical data sets that the sample size is limited, constraining the number of markers that can be investigated. Therefore, more studies with various physiological markers are needed to finally obtain the bigger picture by combining their results. However, in order to resolve seemingly contradictory findings like the role of the amyloid markers in the two routes, studies carefully combining them should also be undertaken. Additionally, more findings based on other subjects than the ADNI cohort would be desirable. This dataset is of invaluable importance for AD research, but independent confirmation of results based on other datasets would be important to generalize the findings. It is desirable to have robust, objective and easily obtainable markers for diagnosis and prognosis. MRI has the advantage of being non-invasive but is still rather expensive. The processing of the image to obtain the markers used in this study is cumbersome and rather not suited for clinical routine (yet).
In summary, we find eight stages of brain atrophy that can lead to AD via two separate routes. Discerning subtypes of AD based on physiological markers of disease progression is still in the stage of exploratory research. The specific cognitive impairments exhibited by the subjects traversing the two routes suggest a behavioral relevance of the subtyping based on neuroanatomical markers.
Footnotes
ACKNOWLEDGMENTS
Data collection and sharing for this project was funded by the Alzheimer’s Disease Neuroimaging Initiative (ADNI) (National Institutes of Health Grant U01 AG024904) and DOD ADNI (Department of Defense award number W81XWH-12-2-0012). ADNI is funded by the National Institute on Aging, the National Institute of Biomedical Imaging and Bioengineering, and through generous contributions from the following: AbbVie, Alzheimer’s Association; Alzheimer’s Drug Discovery Foundation; Araclon Biotech; BioClinica, Inc.; Biogen; Bristol-Myers Squibb Company; CereSpir, Inc.; Cogstate; Eisai Inc.; Elan Pharmaceuticals, Inc.; Eli Lilly and Company; EuroImmun; F. Hoffmann-La Roche Ltd and its affiliated company Genentech, Inc.; Fujirebio; GE Healthcare; IXICO Ltd.; Janssen Alzheimer Immunotherapy Research & Development, LLC.; Johnson & Johnson Pharmaceutical Research & Development LLC.; Lumosity; Lundbeck; Merck & Co., Inc.; Meso Scale Diagnostics, LLC.; NeuroRx Research; Neurotrack Technologies; Novartis Pharmaceuticals Corporation; Pfizer Inc.; Piramal Imaging; Servier; Takeda Pharmaceutical Company; and Transition Therapeutics. The Canadian Institutes of Health Research is providing funds to support ADNI clinical sites in Canada. Private sector contributions are facilitated by the Foundation for the National Institutes of Health (![]() ). The grantee organization is the Northern California Institute for Research and Education, and the study is coordinated by the Alzheimer’s Therapeutic Research Institute at the University of Southern California. ADNI data are disseminated by the Laboratory for Neuro Imaging at the University of Southern California.
). The grantee organization is the Northern California Institute for Research and Education, and the study is coordinated by the Alzheimer’s Therapeutic Research Institute at the University of Southern California. ADNI data are disseminated by the Laboratory for Neuro Imaging at the University of Southern California.
FUNDING
A.R. was supported by a research grant from the German Federal Ministry for Education and Research (BMBF, project id 01IS17067).
CONFLICT OF INTEREST
The authors have no conflict of interest to report.
DATA AVAILABILITY
Data sharing is not applicable to this article as no datasets were generated during this study.