



Abstract
Background:
Alzheimer’s disease (AD) is the most common type of dementia, affecting individuals over 65. AD is also a multifactorial disease, with disease mechanisms incompletely characterized, and disease-modifying therapies are marginally effective. Biomarker signatures may shed light on the diagnosis, disease mechanisms, and the development of therapeutic targets. tRNA-derived RNA fragments (tRFs), a family of recently discovered small non-coding RNAs, have been found to be significantly enhanced in human AD hippocampus tissues. However, whether tRFs change in body fluids is unknown.
Objective:
To investigate whether tRFs in body fluids are impacted by AD.
Methods:
We first used T4 polynucleotide kinase-RNA-seq, a modified next-generation sequencing technique, to identify detectable tRFs in human cerebrospinal fluid and serum samples. The detectable tRFs were then compared in these fluids from control, AD, and mild cognitive impairment patients using tRF qRT-PCR. The stability of tRFs in serum was also investigated by checking the change in tRFs in response to protein digestion or exosome lysis.
Results:
Among various tRFs, tRF5-ProAGG seemed to be impacted by AD in both cerebrospinal fluid and serum. AD-impacted serum tRF5-ProAGG showed a correlation with the AD stage. Putative targets of tRF5-ProAGG in the hippocampus were also predicted by a computational algorithm, with some targets being validated experimentally and one of them being in a negative correlation with tRF5-ProAGG even using a small size of samples.
Conclusions:
tRF5-ProAGG showed the potential as an AD biomarker and may play a role in disease progression.
INTRODUCTION
Sporadic late-onset Alzheimer’s disease (AD) is the most frequent cause of dementia after age 65. As the population ages, AD is becoming a healthcare burden of unprecedented proportions [1]. The most significant AD neuropathology is characterized by amyloid-β and tau accumulation and neuronal and synaptic loss. As brain lesions accumulate, the affected individuals develop a gradual and progressive loss of cognitive functions. Eventually, all patients become bed-bound, requiring around-the-clock care [2–4]. Available treatments are marginally effective, with the most recently approved lecanemab showing clinical decline by 27% after 18 months of treatment of early-stage symptomatic AD, compared with those who received a placebo [5–7].
Brain neuronal damage in AD patients begins long before symptoms arise. However, the disease diagnosis depends heavily on clinical symptoms via cognitive testing, neuroimaging (brain magnetic resonance imaging, fluorodeoxyglucose-positron emission tomography (PET), amyloid scan, and tau PET imaging), cerebrospinal fluid (CSF) amyloid, and tau profile evaluation. At present, only symptomatic AD diagnosis and treatment are available. Identifying prodromal stages of AD remains a major challenge due to the lack of sensitive biomarkers to accurately distinguish early stages of AD from age-related cognitive deficits [8–11]. Therefore, the study of AD biomarkers is essential for early diagnosis and treatment. Several established biomarkers, including β-amyloid and tau in body fluids, are useful in some settings [12, 13]. However, given the heterogeneous nature of AD and its incomplete mechanistic understanding, an expansion of the AD biomarker toolbox is urgently needed. tRNA-derived RNA fragments (tRFs) is a recently discovered family of small non-coding RNAs (sncRNAs). They were found to be involved in many diseases, such as cancer, infectious diseases, metabolic diseases, and neurological diseases [14–17]. They also serve as potential biomarkers for neurological disorders. For example, a tRF derived from ValCAC has been shown to be a promising prognostic biomarker for amyotrophic lateral sclerosis [18]. tRFs were also reported to be able to predict seizures in patients with epilepsy [19]. Circulating tRFs are also biomarker candidates for Parkinson’s disease [20, 21]. These 18∼36 nt tRFs are generated by endonucleolytic cleavage from pre-tRNAs or mature tRNAs and are usually classified into three groups: tRF5, which is derived from the 5’-end of mature tRNA, tRF3 whose sequence is aligned to the 3’-end of mature tRNA, and tRF-1 which contains the 3’-trailer sequence of pre-tRNAs [16]. They are present not only in human tissues but also in biofluids, including CSF and serum [22, 23].
We recently reported that the expression of a limited set of tRF5 in the hippocampus is enhanced in AD patients, compared with controls, and the change of some tRF5 s is associated with disease stages [24]. To further explore the possibility of tRF5 s as biomarkers, we compared CSF and serum tRF5 s between control and AD patients in this study. CSF biomarkers are useful for neurological diseases, as CSF is in direct contact with the brain’s extracellular space; therefore, biochemical changes in CSF can potentially reflect what happens inside the brain [25]. Compared with CSF biomarkers, which require a lumbar puncture to collect, blood biomarkers are less invasive and risky to obtain. In addition, blood tests are generally less expensive than CSF tests. Therefore, blood biomarkers for AD are more desirable if such biomarkers exist [1, 26].
Standard small RNA-seq usually uses 3’-hydroxyl (3’-OH) at 5’-ends for the sequencing barcode ligation. Therefore, it is a routine method to quantify miRNAs and other sncRNAs with 3’-OH at their 5’-ends. The 5’-end of tRFs are heterogeneous, with many of them lacking 3’-OH. Therefore, we used a modified small RNA-seq to quantify tRF expression for patient RNA samples. Basically, the samples were pretreated with T4 polynucleotide kinase (T4 PNK), an enzyme adding 3’-OH to the 5’-end of tRFs, which do not have 3’-OH, before the seq, improving the capability and precision of tRF detection in RNA-seq and qRT-PCR [27–29]. We called this modified seq as T4 PNK-RNA-seq, which revealed that tRFs are the most abundant sncRNAs in CSF and the secondary in serum. T4 PNK treatment also enables tRF5 s, but not tRNAs, to be ligated to an RNA linker so that we could use paired primers against the 3’-end of tRFs and the RNA linker to quantify tRFs by qRT-PCR without signal interference from their parent tRNAs. Using this modified qRT-PCR, we compared tRF5 s in CSF and serum samples derived from AD and age-matched control subjects and identified tRF5-ProAGG as a promising biomarker candidate.
tRFs have been demonstrated to exhibit a gene trans-silencing activity by complementary binding to target mRNAs [17, 31], but using different targeting mechanisms from miRNAs/siRNAs. miRNAs/siRNAs usually use their 5′-portion for gene regulation, while tRFs primarily use the 3’-end to target genes, and their middle portions also play some roles [22, 32]. In this study, we predicted the putative targets of tRF5-ProAGG in the hippocampus by identifying AD-impacted hippocampus genes deposited in GSE173955 [33], in combining the in silico prediction targets as we previously described [34]. Some tRF5-ProAGG-regulated targets were then experimentally validated, and one target was in a negative correlation with tRF5-ProAGG despite a small size of samples, supporting the importance of tRF5-ProAGG in the disease mechanisms of AD.
MATERIALS AND METHODS
Human specimens
CSF and hippocampus samples were requested through the National Institutes of Health (NIH) NeuroBioBank (https://neurobiobank.nih.gov/). Through the bank, 58 postmortem human CSF samples and 23 postmortem human hippocampus samples were shipped from the Human Brain & Spinal Fluid Resource Center (Los Angeles, CA, US), the University of Miami Brain Endowment Bank (Miami, FL, US), Mount Sinai NeuroBioBank (Mount Sinai, NY, US), and the University of Maryland Brain and Tissue Bank (Baltimore, MD, US). Among 58 CSF samples, 41 were from disease individuals, including 24 from diagnosed AD patients, eight from individuals with mild cognitive impairment (MCI), and nine with frontotemporal dementia (FTD). The remaining 17 samples were from age-matched control patients. The hippocampus samples included ten controls and 13 samples from individuals with diagnosed AD.
One hundred thirteen serum samples were requested and obtained from the Texas Alzheimer’s Research and Care Consortium (TARCC), including 62 controls, 47 AD samples, and 11 MCI samples.
RNA isolation
mirVanaTM PARISTM RNA and native protein purification kit (AM1556, Invitrogen, Waltham, MA) was used to extract total RNAs from 300μl CSF or 250μl serum samples, according to the manufacturer’s protocol. 5μl of 5 nM artificial microRNA (cel-miR-39) was spiked after denaturing endogenous ribonucleases to control extraction efficiency. At the elution step, samples were incubated on the column for 5 min at 65°C, and RNAs were eluted with 45μl nuclease-free water. TRIzol reagents (Thermo Fisher Scientific, Hercules, CA) were used to extract RNAs from the hippocampus.
T4 PNK-RNA-seq and data analyses
To profile the tRF expression in CSF and serum, CSF and serum RNA samples from healthy donors were subjected to T4 PNK-RNA-seq as described [27]. Briefly, the RNAs were treated with T4 PNK (New England Biolabs, Ipswich, MA, US) to make the 3’-end of tRFs homogenously with 3’-OH before the ligation with sequencing barcodes, as the ligation of the 3′-end of sncRNAs with sequencing barcodes requires the presence of 3′-OH and not all tRFs have 3-OH ends. The treated RNA was purified and concentrated using Zymo RNA Clean and Concentrator kit (D4060, Thomas Scientific, Swedesboro, NJ). Small RNA libraries were then prepared with NEB Next Multiplex Small RNA Library Prep Set for Illumina (Ipswich, MA, US). Libraries were sequenced in the NGS Core of UTMB using the Illumina NextSeq 550 Mid-Output sequencing run.
For seq data analyses, adaptor sequences were removed using Cutadpat, and RNAs with a length≥15 bp were extracted. RNAs with counts of less than ten and all rRNAs were filtered out. The remaining RNA reads, also treated as cleaned input reads, were mapped to our in-house small RNA database using bowtie2 (v2.4.1), allowing two mismatches, as we previously described [27, 30]. In brief, our in-house small RNA database includes 1) tRF5 and tRF3 databases using the identical sequences derived from different tRNAs [sequences downloaded from tRNA genes using the Table Browser of the UCSC genome browser [35], 2) tRF1 sequences using genome locations of tRNAs, 3) miR/snoR sequences downloaded from the UCSC genome browser, and 4) piRNA sequences downloaded from piRBase (https://www.pirnadb.org/browse/pirna). Raw read counts of each category were normalized with the DEseq2 median of ratios method as we previously described [27]. Differentially expressed tRFs were determined by p-value < 0.05 and mean of normalized counts > 10 in CSF or serum samples. All the data are deposited in GEO (GSE241686).
qRT-PCR
As previously described, a modified qRT-PCR was used to quantify tRFs of interest [24, 28]. In brief, the total RNAs were treated with T4 PNK and followed by ligation with 3’-RNA linker using T4 RNA ligase (Thermo Fisher Scientific). The ligation products were used as RNA input for reverse transcription reaction with RT primers complementary to the linker seq using TaqMan Reverse Transcription Reagents (Thermo Fisher Scientific). Finally, the cDNA was subjected to SYBR Green qPCR using iTaqTM Universal SYBR Green Supermix kit (Bio-Rad, Hercules, CA) with the primers specific to the 5’-end of tRF5 s and RNA linker. The sequences of the primers and the 3’-RNA linker are listed in Table 1.
Sequence information on tRF5s, RNA adaptor, RT primer, qPCR primers, and PCR primers
Sequence information on tRF5s, RNA adaptor, RT primer, qPCR primers, and PCR primers
For normalization, the spike-ins cel-miR-39 and endogenous U6/miR-24 were used to normalize across all Ct values using a combined geometric mean of all three Ct values [36–38]. The geometric mean Ct of cel-miR-39, U6, or miR-24 had similar values in the CSF of AD and control groups.
Regarding putative target quantification in the hippocampus, iScript cDNA Synthesis Kit (Bio-Rad) was used to generate cDNA from total RNAs, followed by qPCR using iTaqTM Universal SYBR Green Supermix kit (Bio-Rad). Ribosomal Protein L13(RPL13), one of the most stable housekeepers in AD autopsy brain tissue, was used for normalization [39]. The primers used to detect Synaptic vesicle glycoprotein 2B (SV2B), Cadherin 8 (CDH8), Neurofilament light chain (NEFL), Calneuron 1 (CALN1), Chromosome 1 open reading frame 216 (C1ORF216), Kalirin rhoGEF kinase (KALRN), Clavesin 2 (CLVS2) and Synaptotagmin 13 (SYT13) are shown in Table 2.
Primer information of qRT-PRC for gene quantification
The serum samples were aliquoted on ice into four tubes (250μl in each tube), followed by the treatment with 1 mg/mL DNase/RNase–free proteinase K (Sigma-Aldrich, St. Louis, MO), 100 U/ml RNase A (NEB), or 0.3% SDS (Sigma-Aldrich) at 37°C for 60 min. An equal volume of PBS was added to the serum for the untreated control. The samples were then denatured by 2X denaturing solution from the mirVanaTM PARISTM kit. cel-miR-39 was spiked in denatured samples. The RNAs were then collected using the mirVanaTM PARISTM kit, followed by tRF5-ProAGG quantification by qRT-PCR.
Bioinformatics analysis for target prediction
RNAhybrid was first used to identify all 5’- or 3’- UTR sites interacting with these tRF5 sequences with a hybridization energy of less than -25 kcal/mol. Next, we selected pairs with consecutive sequence matches of 8-mers or more. These tRF5-mRNA pairs were then further narrowed down in two ways: 1) 3’-end of tRF5 s interacting with 3’ UTRs [34] and 2) among these, 5’ UTR of the same mRNA interacting with the same tRF5 [40], but from the other side of the tRF5 and at least 16 nt away the 3’-UTR-interacting 8-mers, as our previous study showed both middle portion and 3’-end of tRF5 are critical for gene regulation [30]. Finally, to explore the decreased genes in the AD hippocampus, we reanalyzed the online RNA-seq data of the hippocampi from AD and control human brains (GSE173955) [33]. Decreased expressed genes were determined by p-value < 0.05, log2 fold change < –0.9, and average abundance log2 (CPM) > 5.
Gene Ontology (GO) enrichment analysis for the tRF5-ProAGG putative targets, which were decreased expression in AD’s hippocampus, was performed using ShinyGO (0.76.3, http://bioinformatics.sdstate.edu/go/) based on Cellular Component Categories Database.
tRF5-ProAGG transfection
Human pluripotent stem cells (iPSCs)-derived neurons have been proposed to be a highly valuable cellular model for studying the pathomechanisms of AD. To investigate the impact of tRF5-ProAGG on gene expression, iPSC from AD unaffected patient (AG27602) was purchased from Coriell Institute and maintained in mTeSRtrademark Plus medium (Stemcell technologies, Vancouver, BC, Canada) on matrigel (Corning) coated plates, followed by neural progenitor cells (NPCs) generation using STEMdiffTM SMADi Neural Induction Kit and subsequently neuron differentiation/maturation using supplemented STEMdiffTM Neuron Differentiation medium and STEMdiffTM Neuron Maturation medium, according to the manufacturer’s protocols. iPSCs-derived neurons were transfected with 50 pmol tRF-ProAGG mimics or CN mimics per well using 4μl of Lipofectamine RNAiMax (Thermo Fisher) according to the manufacturer’ ‘s instruction. After 48 h post-transfection, the cells were harvested for western blot or RNA extraction. tRF5-ProAGG and CN mimics were purchased from Integrated DNA Technologies (IDT, Coralville, IA). The antibody against NEFL was from Cell Signaling (Cell Signaling, Danvers, MA).
Statistical analysis
The experimental results were analyzed using GraphPad Prism 5 software. An unpaired two-tailed Mann-Whitney U test was used to compare the tRFs and gene expression between two groups (control versus AD, control versus MCI, or control versus FTD). To compare the tRF5-ProAGG expression among proteinase K, RNase A, SDS, and PBS-treated serum samples, one-way analysis of variance (ANOVA) with Dunnett’s posthoc test was employed. A p-value < 0.05 was considered to indicate a statistically significant difference. Single and two asterisks represent a p-value of < 0.05 and < 0.01, respectively. Means±standard errors (SE) are shown.
For correlation analyses, we performed Spearman’s rank correlation test. Spearman’s rank correlation coefficient (Rs) was used to determine correlations. A p-value of less than 0.05 was considered significant.
RESULTS
T4 PNK-RNA-seq revealed abundant tRFs in CSF and serum
To profile the sncRNA expression in human CSF and serum samples, we performed T4 PNK-RNA-seq for five CSF and three serum samples. The seq data were analyzed, similarly as described in [27, 30]. In brief, the sequences with length > 15 bp and reads > 10 were mapped to the in-house small RNA database containing tRFs, miRNA/snoRNAs, and piRNAs to address redundant tRNA sequences across the genome after removing rRNAs. As shown in Fig. 1A, the most abundant sncRNAs in CSF were tRF5 s, followed by piRNAs. While in serum, the most abundant sncRNAs were piRNAs, tRF5 s was the second most abundant sncRNAs (Fig. 1B). tRF5-GlyGCC was the highest expressed tRF5 both in CSF and serum, followed by tRF5-GluCTC. The top-15 ranked CSF and serum tRF5 s were listed in Tables 3 and 4, respectively. Figure 1 C showed that there were 57 and 39 tRF5 s in CSF and serum, respectively, among which 38 tRF5 s were present in both CSF and serum, 19 tRF5 s were found only in CSF, and one tRF5 was present only in serum (Fig. 1 C, and Supplementary Tables 1 and 2). In this study, we used T4 PNK-RNA-seq to identify detectable tRFs, but not AD-impacted tRFs, simply due to the expensive nature of seq and the limited access of sample volume from the tissue banks resulting in insufficient RNAs for seq.

sncRNA composition in human CSF and serum samples. Pie chart analysis on the mean percentages of sncRNA reads from human CSF (A) and serum (B). Venn diagram showing tRF5s expression in CSF and serum (C). The sample information and data were deposited in GEO (GSE241686).
AD-impacted tRF expression in CSF
To further evaluate whether tRF5 expression in CSF is affected by AD, we requested more CSF specimens from NIH NeuroBioBank. CSF specimens with blood contamination were excluded. CSF samples from 17 control (CN) and 24 AD were included in this study. Since our recent publication revealed that tRF5 derived from tRNA GlyGCC (tRF5-GlyGCC), GluCTC (tRF5-GluCTC), GlyCCC2 (tRF5-GlyCCC2), ProAGG (tRF5-ProAGG), and CysGCA (tRF5-CysGCA) are enhanced by AD in the human hippocampus [24], and these tRFs were also present in CSF samples (Table 3), we compared the abundance of these five tRF5 s in CSF samples from CN and AD groups. Our qRT-PCR results suggested CSF tRF5-ProAGG and tRF5-GlyCCC2 were also increased in the AD group, compared with the CN group (Fig. 2A, B). In contrast, tRF5-GluCTC, tRF5-GlyGCC, and tRF5-CysGCA were comparable in AD and CN groups (Fig. 2 C, F, G). Other than these five tRFs, two additional tRFs were studied: tRF5-LysCTT and tRF5-ValCAC. As shown in Tables 3 and 4, there were two main subtypes of tRF5-LysCTT: tRF5-Lys-CTT-2-5 with a length of 33 nts and tRF5-Lys-CTT-6-1 with a length of 17 nts. tRF5-Lys-CTT-2-5 was the major type in CSF, while tRF5-Lys-CTT-6-1 was the main type in serum. In addition to tRF5-LysCTT-2-5 in CSF, tRF5-ValCAC also exhibited enrichment in CSF (Table 3 and Supplementary Table 2). Thus, we also compared the expression of these two tRF5 s in CSF samples from CN and AD groups. As shown in Fig. 2D and 2 H, the CSF expression of these two tRFs was comparable in CN and AD groups. Due to the running out of some CSF samples, the measurement of tRF5-GlyGCC, tRF5-CysGCA, and tRF5-ValCAC was from 14 CN and 18 AD subjects.
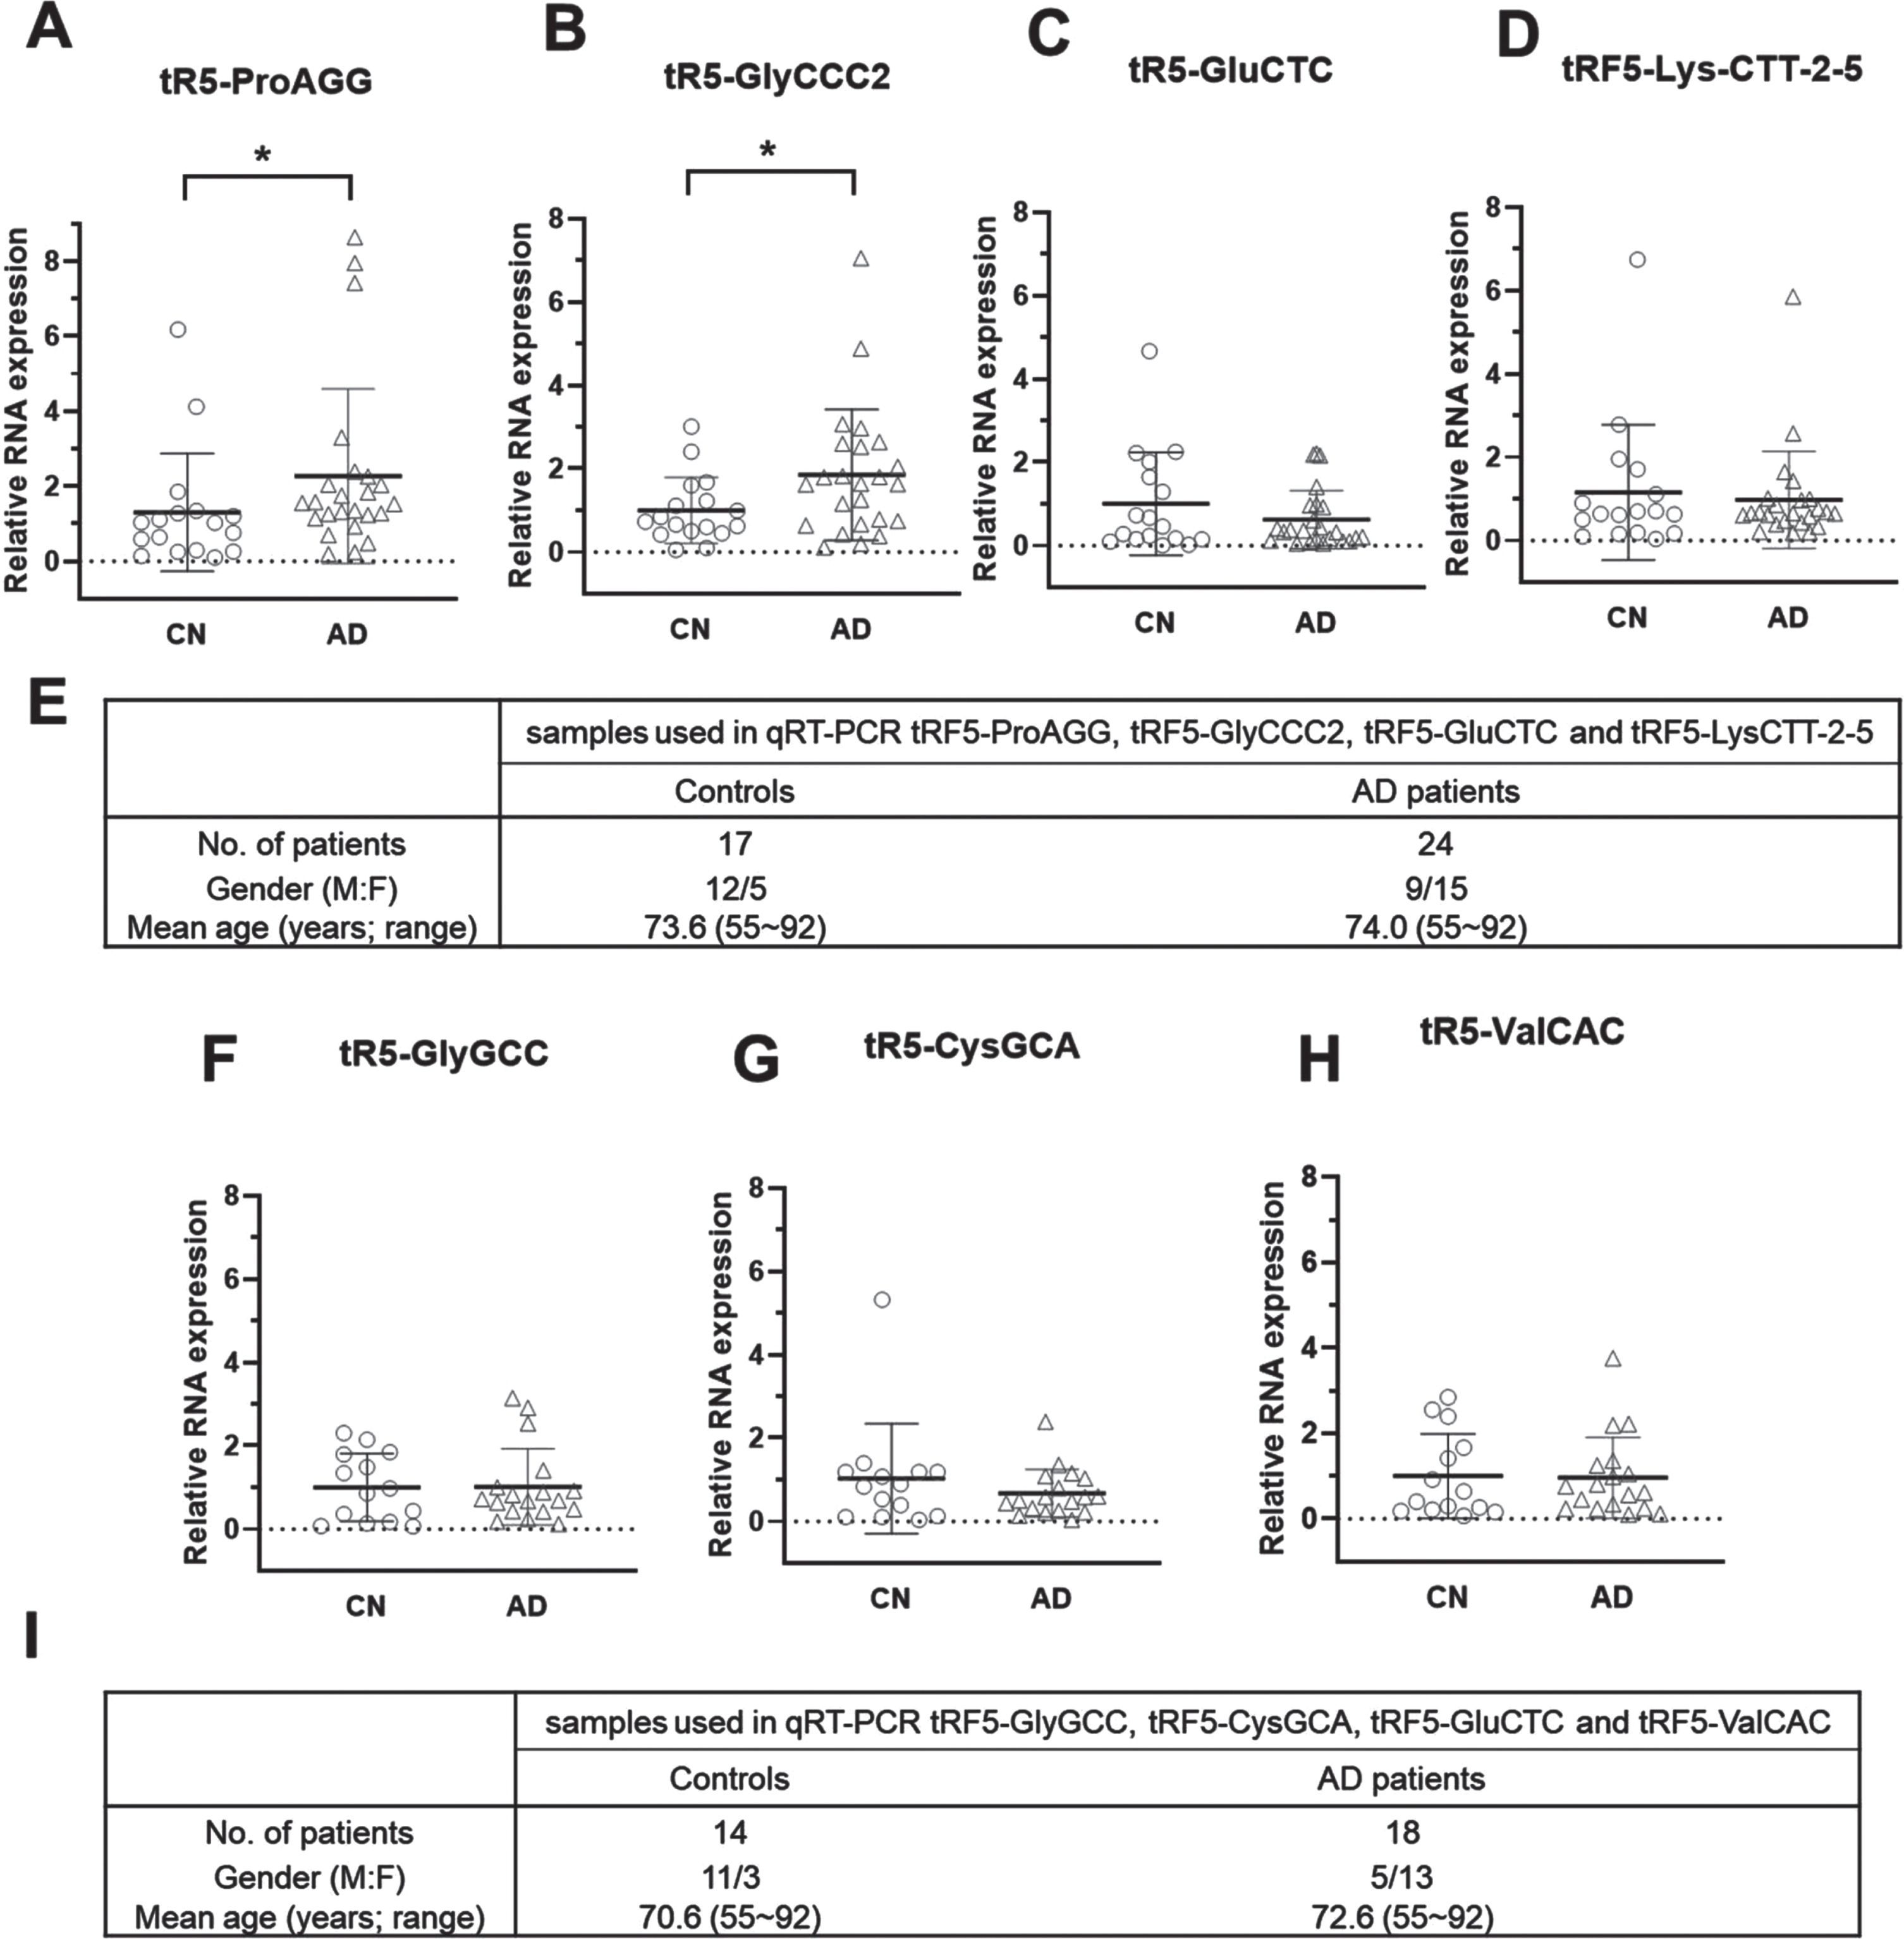
AD-affected tRF5 in CSF. A-D) qRT-PCR was performed to detect tRF5-ProAGG (A), tRF5-GlyCCC2 (B), tRF5-GluCTC (C), and tRF5-Lys-CTT-2-5 (D) in the CSF from control (CN) and AD patients. E) Patient information for samples used in A-D. F-H) qRT-PCR was also used to detect tRF5-GlyGCC (F), tRF5-CysGCA (G), and tRF5-ValCAC (H) in the CSF from CN and AD patients. I) Patient information for F-H samples. Unpaired two-tailed Mann-Whitney U tests were performed for statistical comparisons. *p < 0.05, relative to the paired control group as illustrated. Data are shown as mean±SE.
Top 15 abundant tRF5s in CSF
Most AD patients would suffer through a preclinical phase with underlying biomarker abnormalities, then a prodromal state of MCI, and finally, frank AD dementia [41]. MCI is an early stage of memory or other cognitive ability loss and represents a transitional state between normal aging and dementia [12, 42]. Hence, we also assessed CSF tRF5-ProAGG and tRF5-GlyCCC2 in MCI and age-matched CN subjects. As shown in Fig. 3A and 3B, CSF tRF5-ProAGG was increased in MCI compared to CN, while tRF5-GlyCCC2 expression was not significantly different between MCI and CN groups.
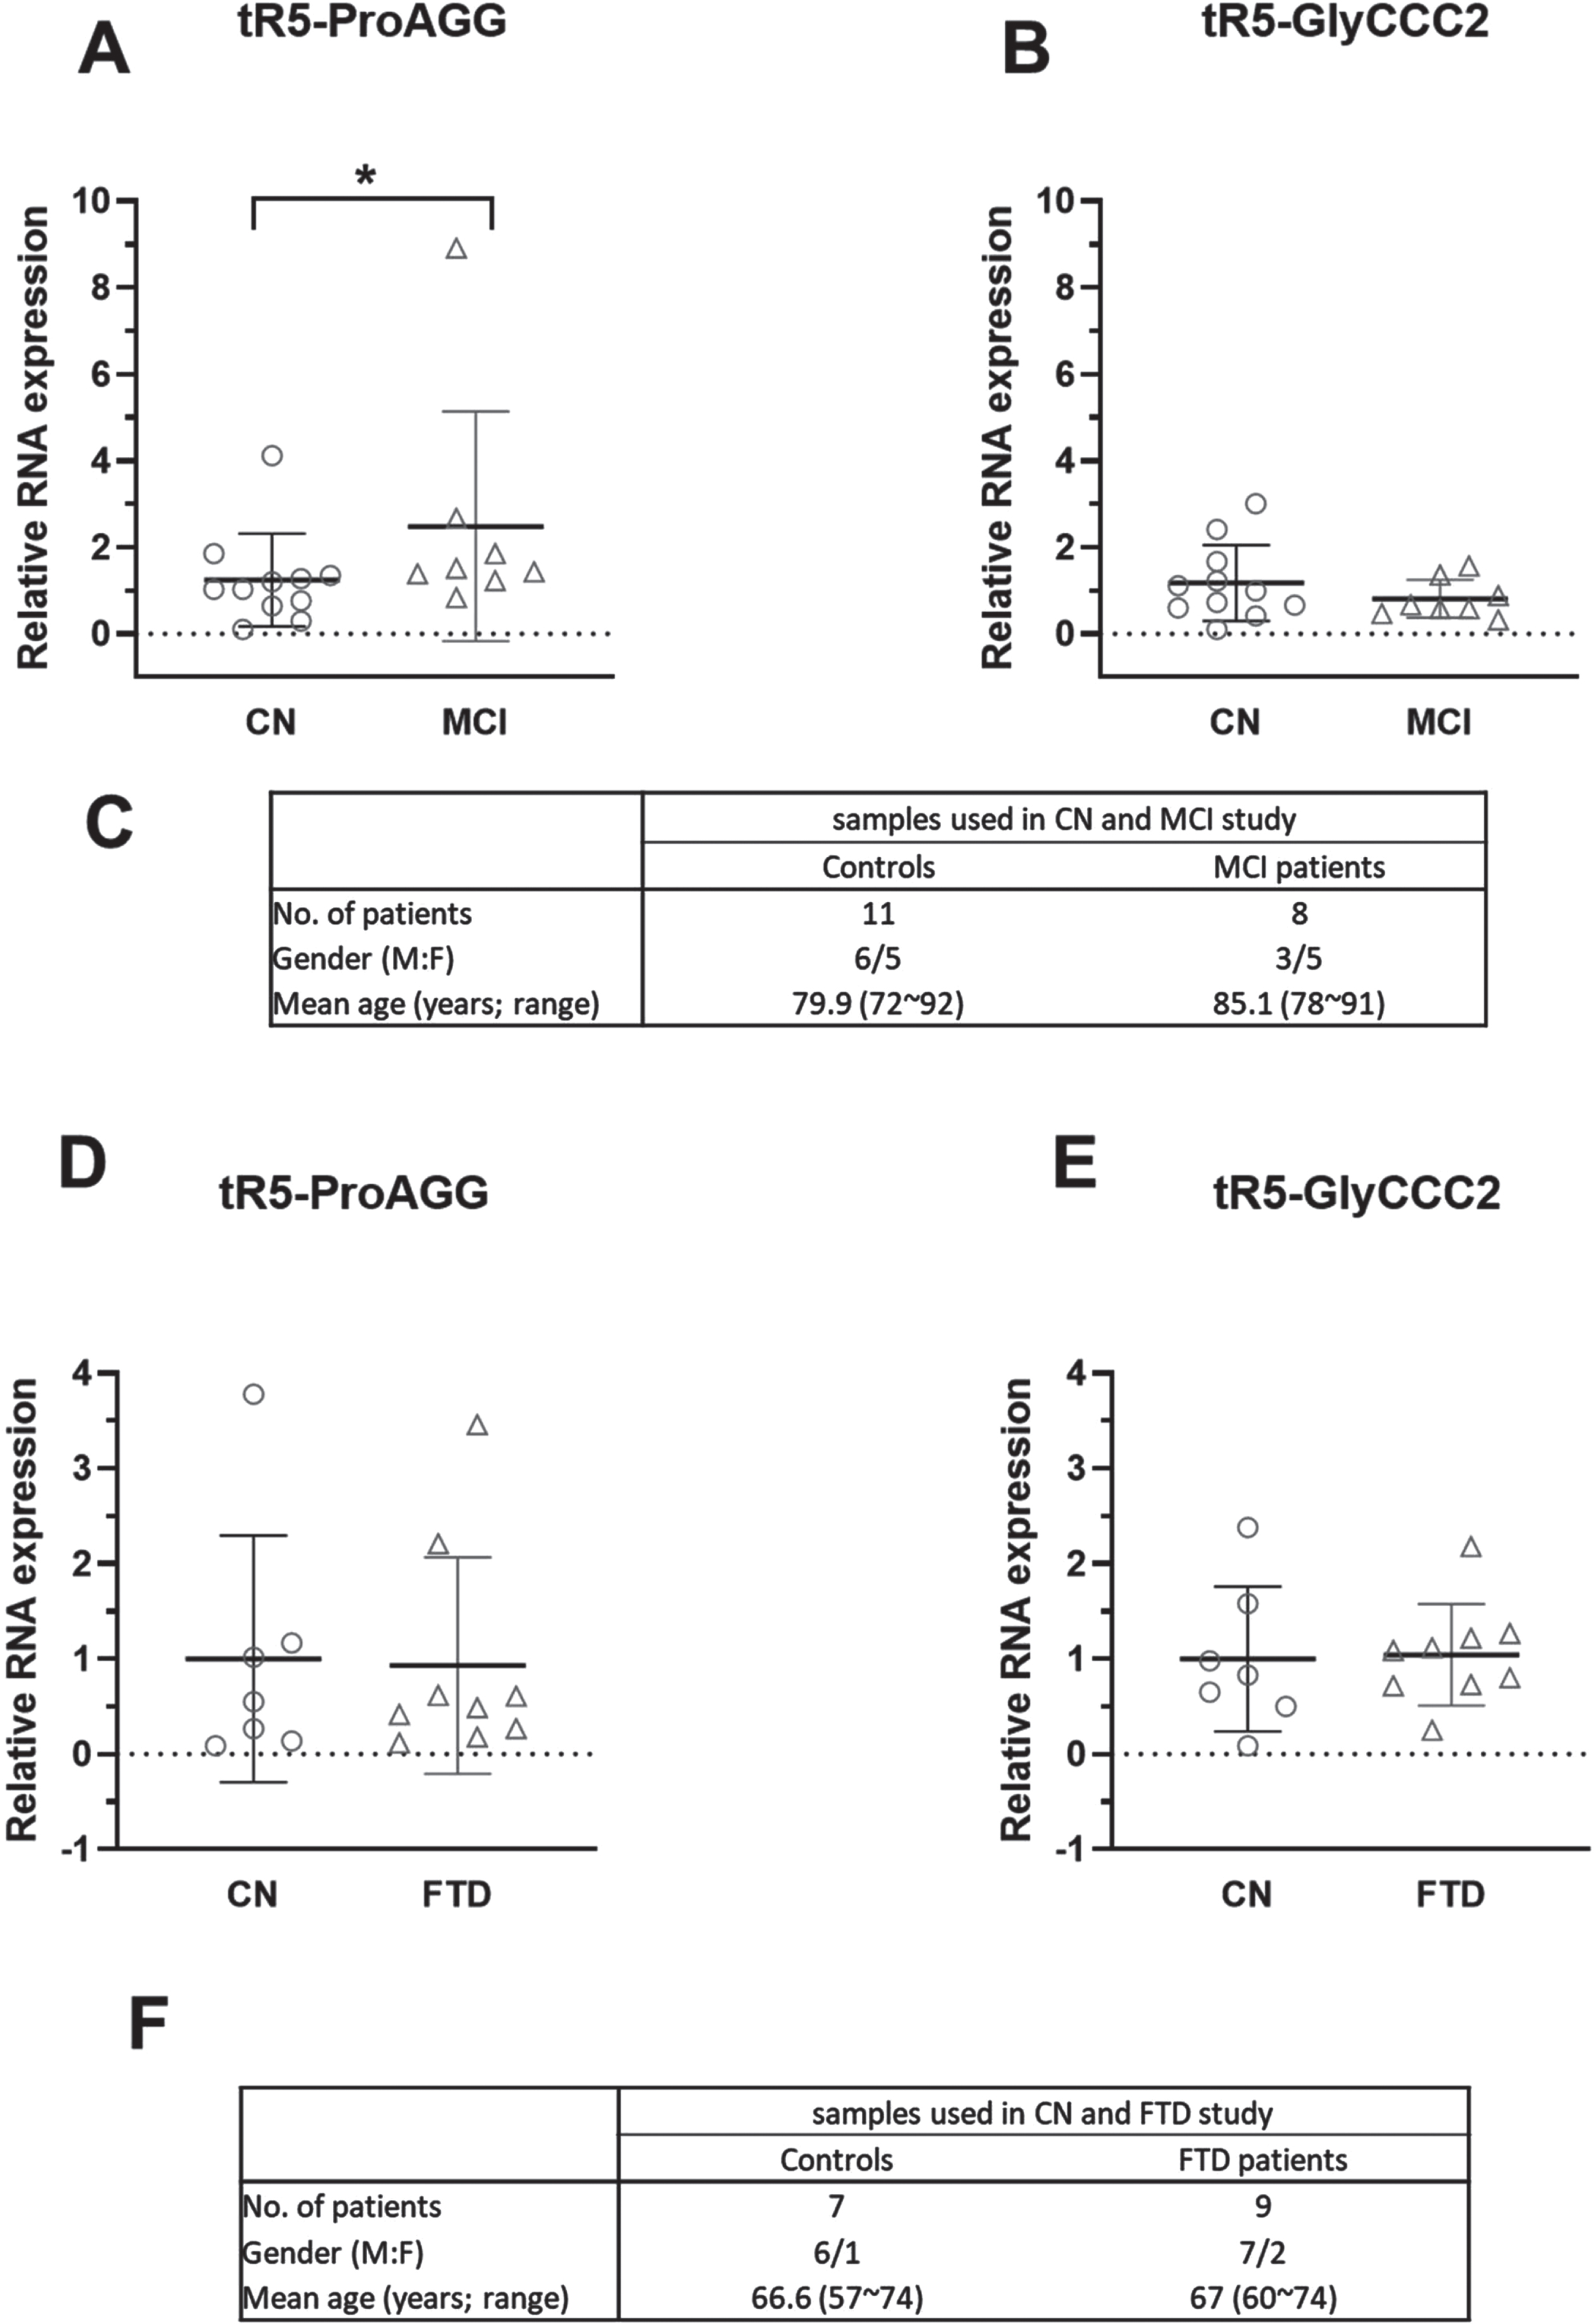
The effect of MCI and FTD on tRF5-ProAGG expression in CSF. A, B) qRT-PCR was used to quantify tRF5-ProAGG (A) and tRF5-GlyCCC2 (B) in CSF from CN and MCI patients. C) Patient information for samples is shown in A and B. D, E) qRT-PCR was carried out to detect CSF tRF5-ProAGG (D) and tRF5-GlyCCC2 (E) from CN and FTD patients. F) Patient information for samples used in D and E. Unpaired two-tailed Mann-Whitney U tests were used and data are shown as mean±SE.
FTD is another common neurodegenerative dementia due to the relatively selective atrophy of the frontal and temporal lobes [43]. It is often misdiagnosed as AD [44]. To explore whether tRF5-ProAGG and tRF5-GlyCCC2 in CSF could discriminate AD from FTD, we compared the expression level of these two CSF tR5 s in FTD and AD patients. Our result suggested these two tRF5 s were not impacted by FTD (Fig. 3D, E).
AD-impacted serum tRF5-ProAGG
Serum samples can be readily and easily obtained from patients, which is an ideal source for biomarker studying. We received 62 age-matched CN and 47 AD serum samples from TARCC and studied the tRF5-ProAGG and tRF5-GlyCCC2 expressions in these samples. Our results suggested that serum tRF5-ProAGG was less in the AD group than in the CN group, while tRF5-GlyCCC2 was comparable between AD and CN (Fig. 4A, B). We are currently collecting more samples to investigate the impact of gender and other AD risk factors on serum tRF expression by subgroup analyses.
Given the significance of tRF5-ProAGG in AD, we also explored whether it associated with disease progression in 120 serum samples with Mini-Mental State Examination (MMSE) scores and Clinical Dementia Rating (CDR) scores, including 62 age-matched CN, 47 AD, and 11 MCI (Supplementary Table 3). As shown in Fig. 4 C and 4D, tRF5-ProAGG in serum positively correlated with the MMSE (Rs = 0.236, p = 0.009) and negatively correlated with CDR (Rs = –0.220, p = 0.015). In contrast, no correlation was observed between tRF5-ProAGG and age (Fig. 4E).
Top 15 abundant tRF5s in serum
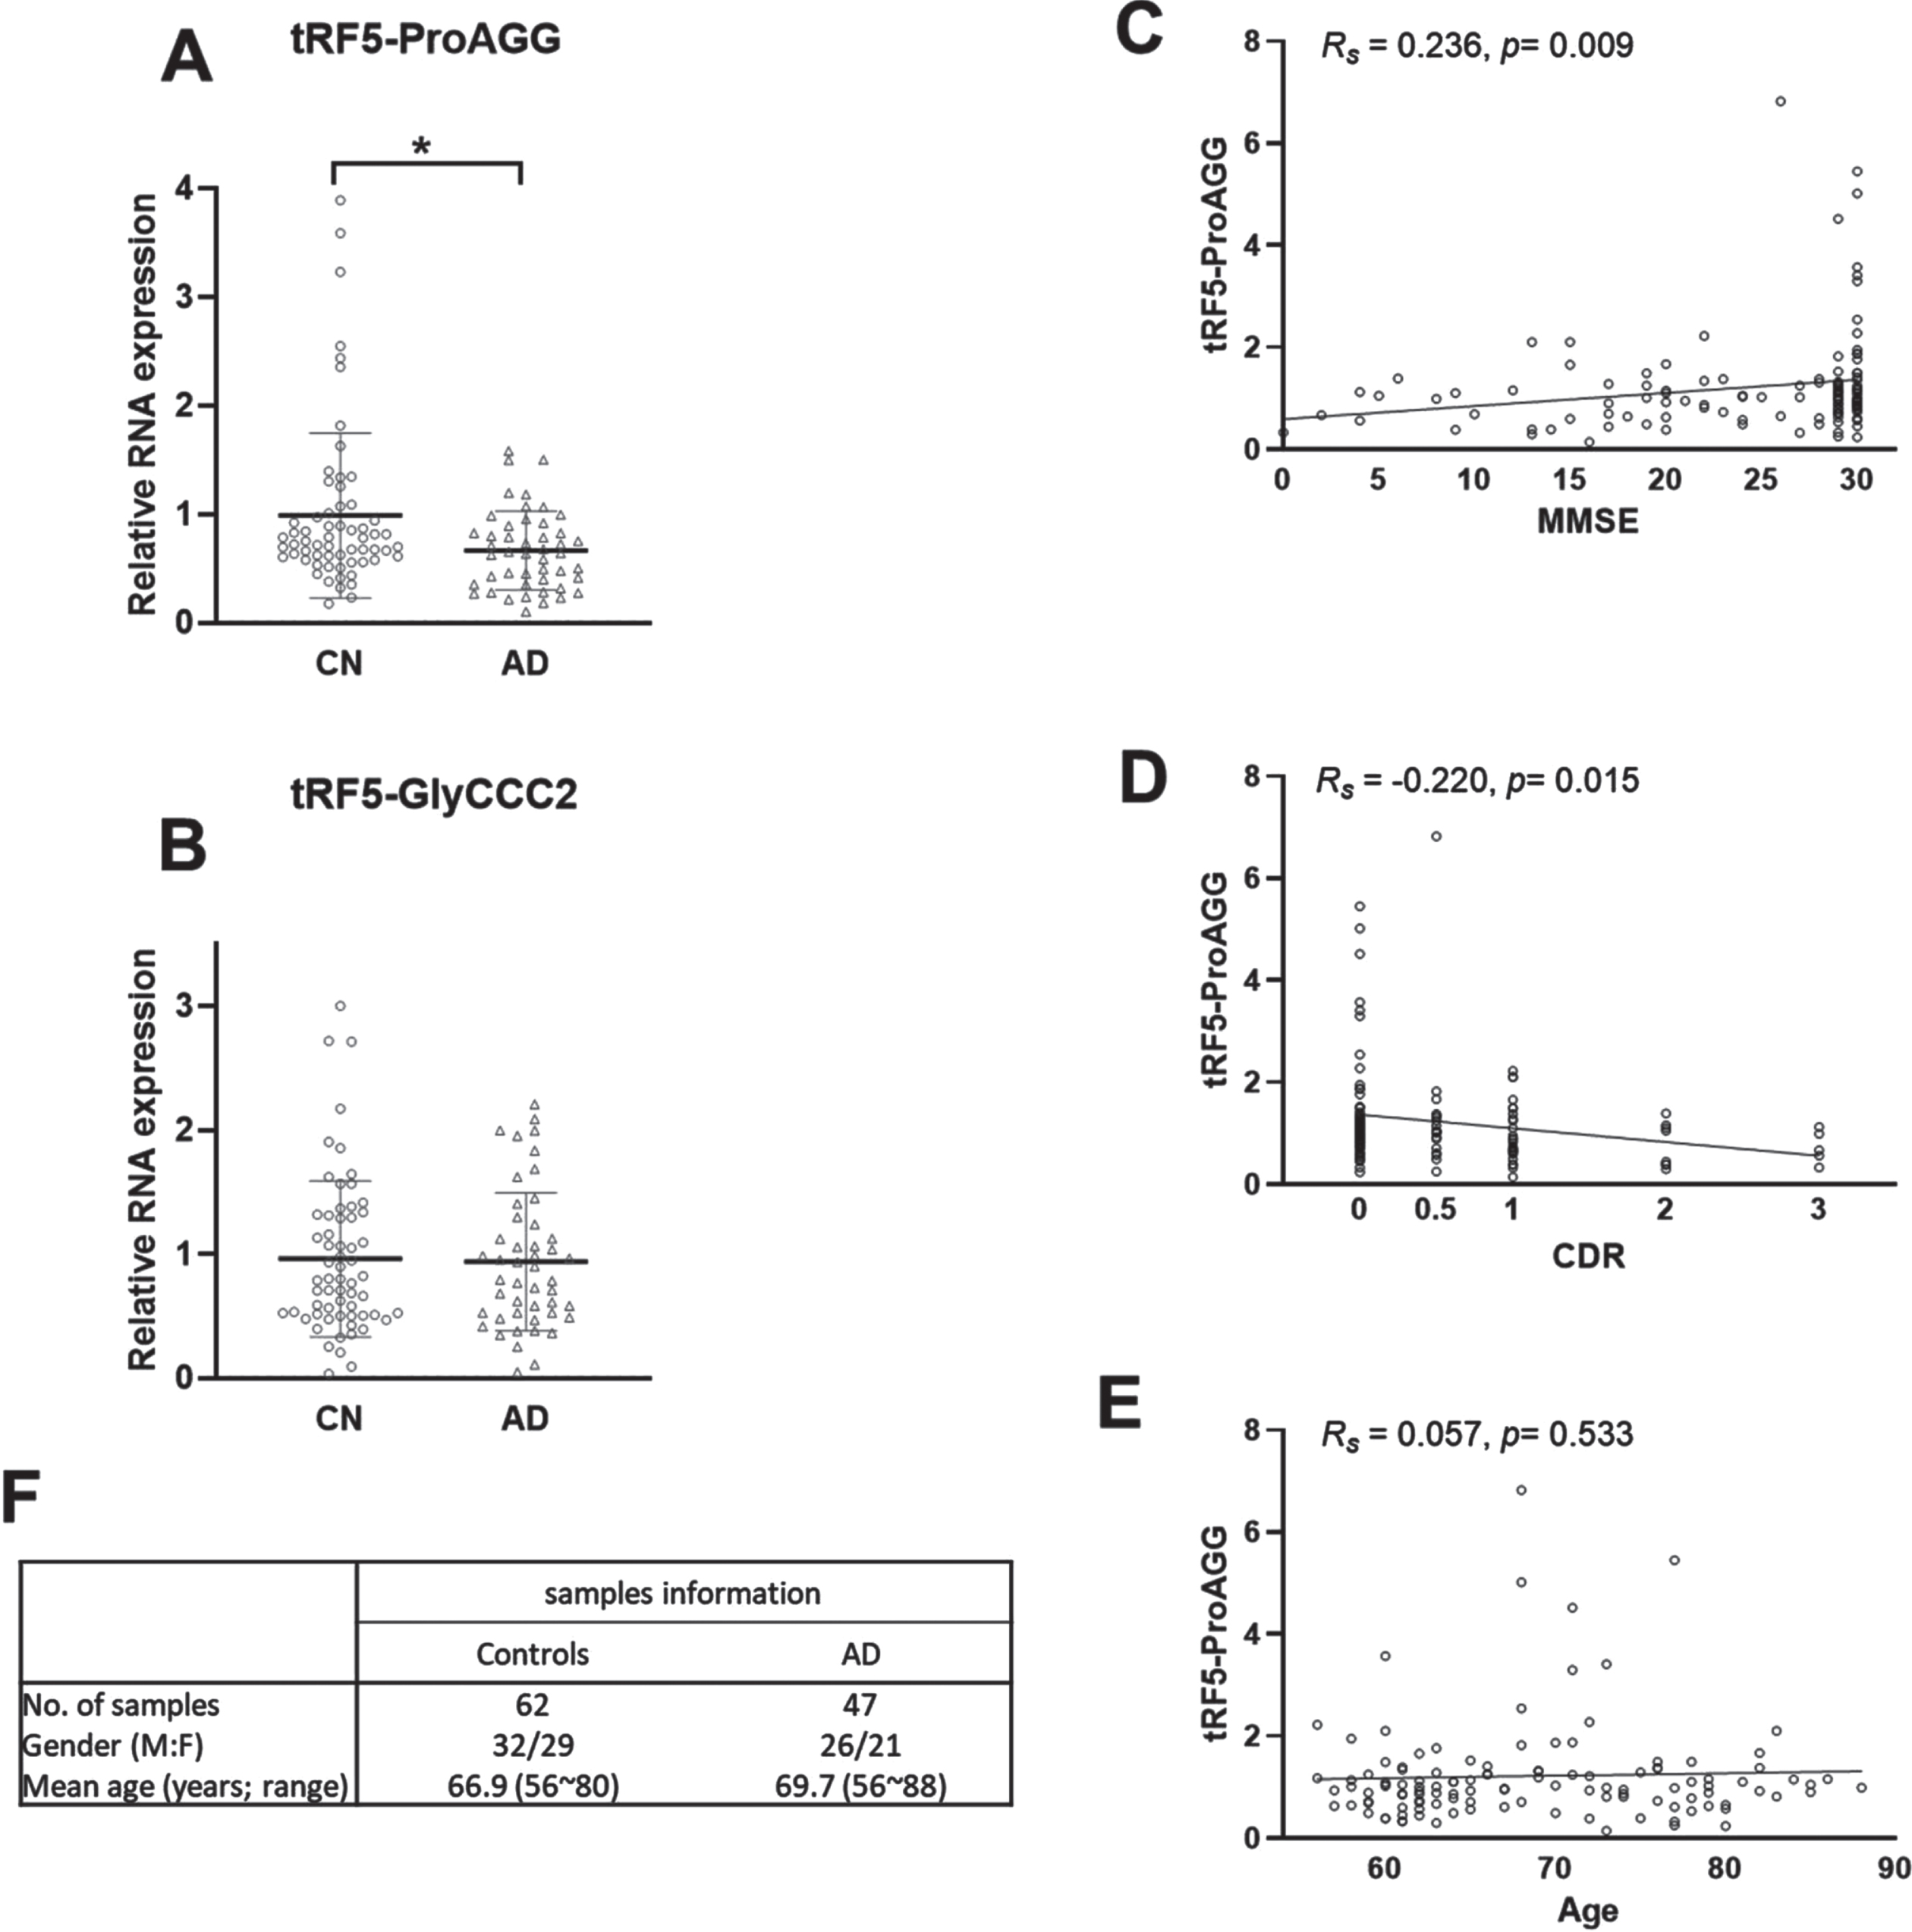
The effect of AD on tRF5-ProAGG expression in serum. A, B) qRT-PCR was performed to detect tRF5-ProAGG (A) and tRF5-GlyCCC2 (B) in serum from CN and AD patients. For A and B, unpaired two-tailed Mann-Whitney U tests were used and data are shown as mean±SE. *p < 0.05. C-E) The graphic demonstration of ‘Spearman’s rank correlation between serum tRF5-ProAGG expression and MMSE (C), CDR (D), or age (E). *p < 0.05. F) Patient information.
The potential of tRF5-ProAGG as a prognosis biomarker for AD
In this study, TARCC also generously gave us a small set of serum samples from a longitudinal cohort of eight patients whose serum was collected yearly for over three years. Four patients were grouped into MCI-AD progression group (MCI (year 1) and AD (year 2/3), and four belonged to an age-matched control group (stay normal from year 1 to year 2/3) (Fig. 5 C). We analyzed tRF5-ProAGG in longitudinal serum samples of each subject. Three out of four sets of disease progression samples displayed a decrease in tRF5-ProAGG expression when the disease progressed from MCI to AD) (Fig. 5A). While no change of tRF5-ProAGG was observed in the control group (Fig. 5B). Although the results were inconclusive because of small sample numbers, the data are encouraging for a future longitudinal study to confirm whether tRF5-ProAGG can serve as an MCI-AD progress biomarker.

Changes in serum tRF5-ProAGG expression in MCI-AD progression. Samples harvested from a longitudinal study. Patients were divided into the MCI-AD progressive group and CN group. The progressive group includes MCI patients who developed AD in years 2/3. CN group includes subjects who stayed normal from year 1 to year 2/3. A, B) qRT-PCR was performed to detect tRF5-ProAGG in serum in the MCI-AD progressive group (A) and CN group (B). C) Patient information for samples used in A and B. D) Serum tRF5-ProAGG was measured by qRT-PCR to determine the treatment impact of RNase A, proteinase K, and SDS on serum tRf5-ProAGG stability. Each group was compared with untreated samples. One-way analysis of variance (ANOVA) with Dunnett’s post-hoc test was employed. **p < 0.01. Data are shown as mean±SE.
Considering the presence of endogenous ribonucleases in the blood, the resistance to RNases is necessary for sncRNAs to serve as biomarker candidates [45]. To access the stability of serum tRF5-ProAGG, 100 U/ml exogenous RNase A was used to treat the serum at 37°C for 60 min. tRF-ProAGG in RNase A-treated serum was then compared with that in control samples. As shown in Fig. 5D, tRF5-ProAGG was not sensitive to RNase A treatment. Blood microRNAs have been reported to exhibit resistance to endogenous ribonuclease activity because of their binding to proteins such as Argonaute-2 and high-density lipoprotein or being packed by microvesicles [46–48]. To explore the underlying mechanism, the serum was treated with 1 mg/mL proteinase K or 0.3% SDS to respectively abolish the protection from protein complexes and microvesicles on RNAs. The results indicated serum tRF5-ProAGG was degraded after proteinase K treatment but not SDS (Fig. 5D), suggesting serum tRF5-ProAGG was protected by protein, not microvesicles.
tRF5-ProAGG putative targets
Our previous study documented that tRF5 s exert trans-silencing capacity to target gene expression [30, 34]. Herein, we predicted the putative targets of tRF5-ProAGG based on seq complementary pairing between tRF and targets and calculated the free energy of interaction, as we previously described [34, 40]. As shown in Fig. 6A, 1,191 putative targets were identified. Considering the hippocampus is one of the main AD-impacted areas in the brain and tRF5-ProAGG is increased in AD’s hippocampus [24], we studied whether these in silico prediction targets are indeed impacted by AD, by analyzing online data from the GEO DataSets with an accession #: GSE173955 [33]. The deposited raw high throughput sequencing data of mRNAs were obtained from the postmortem human hippocampus brains of eight AD and ten non-AD subjects [33]. In this online data, we identified 364 decreased genes in AD, and 40 of these were tRF5-ProAGG putative targets (Fig. 6A). GO enrichment analysis result indicated these 40 putative targets were associated with cellular components of neurons, including postsynapse, glutamatergic synapse, ion channel complex, postsynaptic specialization, synaptic membrane, and axon, implying the critical role of tRF5-ProAGG in neurons function (Fig. 6B). Among these 40 genes, we selected eight putative targets for validation by qRT-PCR [33]. As shown in Fig. 7, three predicted targets (SV2B, CDH8, and NEFL) in hippocampus were significantly decreased in AD. Moreover, SV2B expression level negatively correlated with the tRF5-ProAGG (Rs = –0.426, p = 0.043).

Putative targets of tRF5-ProAGG. A) Venn diagram showing the putative targets of tRF5-ProAGG which also decreased in ‘AD’s hippocampus. B) GO enrichment analysis of the putative targets in (A).

Expression of tRF5-ProAGG putative targets in the hippocampus. A-H) qRT-PCR was performed to detect SV2B (A), CDH8 (B), NEFL (C), CALN1 (D), C1ORF216 (E), KALRN (F), CLVS2 (G), and SYT13 (H) in hippocampus from CN and AD patients. I) The graphic demonstrates Spearman’s rank correlation between tRF5-ProAGG expression and SV2B. J) Patient information for samples used in A-I. *p < 0.05. Unpaired two-tailed Mann-Whitney U tests were used, and data are shown as mean±SE.
To further study gene regulation by tRF5-ProAGG, we transfected tRF5-ProAGG mimic into iPSC-derived neurons, followed by qRT-PCR to investigate whether tRF5-ProAGG influences the expression of SV2B, CDH8, and NEFL. As shown in Fig. 8, compared to scrambled oligo-transfected cells, tRF5-ProAGG-transfected cells had less expression of these three genes at mRNA level. We also confirmed the regulation of NEFL by tRF5-ProAGG at the protein level.

tRF5-ProAGG-regulated targets. iPSC-derived neurons were transfected with tRF-ProAGG mimic or scrambled RNAs. After 48 post transfection, the cells were harvested for total RNA preparation to compare the mRNA of SV2B (A), CDH8 (B) and NEFL (C) by qRT-PCR. The impact of tRF5-ProAGG on NEFL was also confirmed by western blot (D).
DISCUSSION
In recent decades, many efforts have been made to study CSF and serum miRNAs and their roles as neurological disease biomarkers. Many studies were initiated with next-generation sequencing (NGS) and generated valuable information [49–51]. The standard barcode ligation in small RNAs (small RNA-seq) is effective to capture sncRNAs with 3’-OH at their 5’-ends [52]. However, other types of sncRNAs lacking a 3′-OH can be easily missed during the barcode ligation step. Regarding tRFs, 2′,3′-cyclic phosphate (cp) group is often present in their 5’-ends; therefore, standard small RNA-seq cannot completely catch all tRF signals. On the other hand, emerging evidence indicates abundant tRFs in CSF and serum, even more than miRNAs [23, 54]. T4 PNK-RNA-seq, therefore, was recently developed and employed to profile sncRNAs with heterogeneous ends [27]. In brief, extracted RNAs were treated with T4 PNK to make the 3’-ends homogenous with -OH before library construction. Sequencing data revealed that tRF5 s and piRNAs had the highest global expression in CSF and serum, respectively (Fig. 1A, B). Compared with standard small RNA-seq results from Dr. Erle’s group [23], which showed about 46% sncRNAs in CSF being tRFs, our T4 PNK-RNA-seq showed that tRFs accounted for ∼73% in CSF, supporting more tRFs were ligated to the seq barcode by T4 PNK pretreatment. In addition, CSF had more types and higher expression of tRF5 s than serum (Fig. 1 C). The top-listed types of tRFs are also different between CSF and serum samples (Tables 3 and 4). The top 15 tRF5 s in serum were derived from tRNA Gly, tRNA Glu, tRNA Sec, tRNA Lys, and tRNA Pro, and the top 15 tRF5 s in CSF were derived from tRNA Gly, tRNA Glu, tRNA Val, tRNA Leu, tRNA Lys, tRNA Pro, tRNA His and tRNA Ser (Tables 3 and 4). Notably, for the tRF5 s derived from tRNA Lys, tRF5-Lys-CTT-2-5 was the major type in CSF, while tRF5-Lys-CTT-6-1 was the main type in serum. tRF5-Lys-CTT-6-1 was not classic tRF5 s; its 5’-end starts around the D loop and 3’-end stops around the anticodon region, and it lacks the first 16 nt of the tRNA 5’end. Although the sequence of tRF5-Lys-CTT-6-1 was very similar to the 3’-portion of tRF5-Lys-CTT-2-5, they were generated from the different tRNA isoacceptors tRNA, suggesting different biogenesis mechanisms of these two types tRFs.
Our recent publication showed that tRF5-ProAGG and tRF5-GlyCCC2 were enhanced in AD hippocampus, and tRF5-ProAGG expression positively correlates with the Braak stage [24]. In this study, we found these two tRF5 s also increased in the CSF samples of AD (Fig. 2). Remarkably, CSF tRF5-ProAGG was elevated by MCI but not by FTD, suggesting tRF5-ProAGG as a promising AD-specific biomarker candidate (Fig. 3). One advantage of the newly developed qRT-PCR is that it requires significantly less sample loading. In contrast to the need for 1 ml CSF to obtain the tRF5-ProAGG signal from the Northern blot (Supplementary Figure 1A), we used 300 ul CSF for RNA extraction, which was enough to quantify about five tRFs. The qRT-PCR is also reliable, supported by a nice standard curve of tRF5-ProAGG mimic (Supplementary Figure 1B)
In this study, we found that in contrast to AD-enhanced tRF5-ProAGG in the hippocampus and CSF, serum tRF5-ProAGG was less in AD samples. Although we do not know exact mechanisms underlying differential compartmental tRF5-ProAGG expression, higher CSF and lower plasma expression of certain AD related disease risk factors such as apolipoprotein A1 (APOA1) has also been reported for APOE4 carriers [55]. We think there are several possibilities. First, as shown in Fig. 5D, serum tRF5-ProAGG seemed to protect them from ribonucleases by binding to proteins. It is possible the abundance or protective capability of bound proteins is dampened by AD, leading to more tRF5-PreAGG degradation subsequently less presence in serum. It has been reported previously that some blood miRNAs bind to high-density lipoprotein (HDL) to protect them from ribonucleases [56]. Dysfunctional and aberrant HDL is believed to contribute to the many disease development including neurodegenerative diseases [57]. Therefore, it is possible that tRF5-ProAGG-associated proteins are reduced or dysfunctional in peripheral blood in AD, leading to impaired tRF transporting from CSF to peripheral blood and/or less protection against tRF degradation. Second possibility is that AD-dysregulated CSF circulation makes more tRF5-ProAGG trapped in CSF and less tRF5-ProAGG released into peripheral blood. CSF circulation and turn over serves an important homeostatic role for the function of the central nervous system. The disruption of normal CSF circulation and turnover is believed to contribute to disease development, including neurodegenerative conditions such as AD [58]. In the future, we will investigate the mechanisms underlying differential compartmental changes in tRFs by AD.
The results of the current study and a previous publication [24] suggested that AD enhances tRF5-ProAGG in CSF/hippocampus but reduces tRF5-ProAGG in serum. Our published results also demonstrate that hippocampus tRF5-ProAGG is positively correlated to AD progression [24]. Therefore, these results supported that enhanced hippocampus tRF5-ProAGG may lead to less serum tRF5-ProAGG along the AD progression. It is known that a lower MMSE score or a higher CDR score serves as a vital AD progression index. Therefore, Fig. 4 results on the relationship between the lower MMSE/higher CDR score with less serum tRF5-ProAGG coordinates well with our previous finding on enhanced hippocampus tRF5-ProAGG by AD.
MCI is an intermediate stage between normal aging and dementia [59]. In the follow-up studies, approximately 80 % of MCI patients have converted to AD in 6 years, and some MCI patients stabilized at MCI or reverted to normal [42, 60]. Prediction of conversion from MCI to AD would enable earlier and potentially more effective treatment. One of the limitations herein is that we could not conclude whether serum tRF5-ProAGG expression is significantly different in MCI and CN groups due to a limited number of MCI serum samples (Supplementary Figure 2A). However, by analyzing each case closely (Fig. 5), we found that three out of four patients showed a continuous decrease in serum tRF5-ProAGG along MCI advancing to AD, while no changes in the CN group. Although the case numbers regarding the changes of serum tRF5-ProAGG along MCI to AD progression are not enough to make a conclusive statement, the results suggested the need for a longitude MCI-AD study with sufficient samples to conclude the predictive value of tRF5-ProAGG for the cognitive decline and onset of AD. Our results also showed a decreased tendency of serum tRF5-ProAGG by AD in both males and females (Supplementary Figure 2B, C). No sex impact was observed in the control (Supplementary Figure 2D) or AD group (Supplementary Figure 2E). We are currently collecting more serum samples for subgroup analysis to determine the impact of sex on AD-decreased serum tRF.
Similar to what we have shown previously [24], this study revealed that most AD-impacted were ∼30 nt in length. This type of tRFs has been reported to exert regulatory function by multiple mechanisms, including promoting the assembly of stress granules to impede translation initiation [61], interacting with ribosomes to inhibit global translation [62], and trans-silencing capacity to regulate target genes expression [30, 34]. Unlike miRNAs which generally use their 5’-ends to induce cleavage of the target mRNAs. tRF5 s use 3’-ends and the middle portions for target regulation, with the 3’-ends being more important than the middle portions [30]. Our in-house prediction algorithm, based on such gene trans-silencing rules of tRFs, raised a group of putative targets. The target number was narrowed down by comparing algorithm-predicted genes with online-deposited AD-impacted hippocampus genes, and 40 common genes were defined as final putative targets. We then initiated target validation by qRT-PCR to confirm AD-downregulated genes in the hippocampus. Among eight selected genes (free-energy-based) for initial validation, SV2B, CDH8, and NEFL were promising targets. Notably, the SV2B expression level negatively correlated with the tRF5-ProAGG and suppressed by tRF5-ProAGG transfection, supporting SV2B suppression by tRF5-ProAGG in the hippocampus. SV2B is a synaptic vesicle protein 2 (SV2) family member and is localized at synaptic vesicles. This protein regulates presynaptic Ca2 + signaling and participates in synaptic vesicle exocytosis and neurotransmitter release [63–65]. The reduced levels of SV2B protein had been observed in human embryonic stem cell-derived AD models [66]. Recently, SV2B has been identified as a novel presynaptic interactor of β-site APP cleaving enzyme 1 (BACE1), regulating amyloidogenic processing [67]. Consistent with reported AD-reduced NEFL in the hippocampus [68], our qRT-PCR and western blot also confirmed the decrease of NEFL in the AD hippocampus. Plasma NEFL is also a biomarker candidate for AD [69–71]. These results imply the reliability of our target prediction methods for tRF5-ProAGG. The function of CDH8 in AD is not that clear. However, as a cadherin protein and its known function in synaptic adhesion, axon outgrowth, and guidance [72, 73], it is worth investigating its role in AD. Besides downregulated targets shown in Fig. 6, we also found that some predicted targets are increased in AD brains in sequencing data deposited in GSE173955 (data not shown), suggesting tRFs, like some miRNAs, can also stabilize the genes. We focused on downregulated targets in this study because those targets have been functionally acknowledged in neurodegenerative diseases and showed tRF-target correlation (Fig. 7) and regulation by tRF5-ProAGG (Fig. 8). In the future, for the genes passing the initial validation step, we will confirm them as targets using molecular and functional biology as we previously described [30, 34]. Despite this limitation, the relationship between tRF5-ProAGG and SV2B, the correlation between tRF5-ProAGG and AD progression, the reported functions of SV2B in AD, and the stability of tRF5-ProAGG in peripheral body fluid all support that tRF5-ProAGG is a promising biomarker of AD and/or a vital regulator controlling AD onset and development.
Footnotes
ACKNOWLEDGMENTS

FUNDING
This work was supported by grants from the US National Institute of Health (NIH) R21 AI66543 and R21AG069226 to XB, R61 AG075725 and TARCC Investigator-Initiated Research Award 952272 to XB and XF, R21 AG066060 to XF.
CONFLICT OF INTEREST
The authors have no conflict to report.
DATA AVAILABILITY
The seq data are deposited in GEO (GSE241686) and all other data supporting the findings of this study available within the article and/or its supplementary material.