



Abstract
Background:
Alzheimer’s disease (AD) is the most common type of dementia caused by irreversible neurodegeneration, with the onset mechanisms elusive. tRNA-derived RNA fragments (tRFs), a recently discovered family of small non-coding RNAs (sncRNAs), have been found to associate with many human diseases, including infectious, metabolic, and neurological diseases. However, whether tRFs play a role in human AD development is not known.
Objective:
This study aimed to explore whether tRFs are involved in human AD.
Methods:
Thirty-four postmortem human hippocampus samples were used. The expression of Drosha, Dicer, and angiogenin (ANG), three ribonucleases responsible for the biogenesis of sncRNAs, was determined by qRT-PCR and western blot. The tRFs in the hippocampus was detected by qRT-PCR or northern blot. We also used qRT-PCR to quantify NOP2/Sun RNA methyltransferase 2 (NSun2) and polyadenylation factor I subunit 1 (CLP1), two tRNA modification enzymes.
Results:
tRFs derived from a subset of tRNAs are significantly altered in the hippocampus of AD patients. The expression change of some tRFs showed age- and disease stage-dependent. ANG is significantly enhanced in AD, suggesting its role in inducing tRFs in AD. The expression of NSun2 in AD patients younger than 65 was significantly decreased. According to a previous report supporting NSun2-mediated tRNA methylation modification making tRNA less susceptible to ANG-mediated cleavage, our results suggested that the decrease in NSun2 may make tRNAs less methylated and subsequently enhanced tRF production from ANG-mediated tRNA cleavage.
Conclusion:
Our studies demonstrated for the first time the involvement of tRFs in human AD.
INTRODUCTION
Alzheimer’s disease (AD) is the most common form of dementia caused by irreversible progressive neurodegeneration [1]. According to its age of onset, AD has been divided into early-onset AD (EOAD, <65 years of age) and late-onset AD (LOAD, ≥65 years of age). In 2019, an estimated 5.8 million Americans of all ages are living with AD [2]. This number includes an estimated 5.6 million LOAD and approximately 200,000 EOAD [2, 3]. By 2050, the AD cases in the United States may grow to 13.8 million [2]. To battle AD, significant efforts have been carried out to identify disease hallmarks and AD-associated risk factors. However, the mechanisms underlying the AD onset remain elusive.
Recent advances in high-throughput sequencing revealed that 98%of human transcriptional products are non-coding RNAs (ncRNAs) [4]. Based on their length, ncRNAs can be roughly divided into small ncRNAs (sncRNAs) and long ncRNAs (lncRNAs,>200 nt) [5]. While accumulating evidence sup-ports the role of ncRNAs in AD pathogenesis, only limited types of ncRNAs are implicated [6–10]. The roles of many emerging ncRNAs in AD have not been studied. tRNA-derived RNA fragments (tRFs) is a recently discovered family of sncRNAs. Soon after the discovery, they were recognized to be an import-ant regulator of many diseases, such as cancer, infectious diseases, metabolic diseases, and neurological diseases [11–18]. However, whether tRFs contribute to human AD progression is not known.
To determine the importance of tRFs in AD progression, we re-analyzed the online sncRNA sequencing data data for the brain tissues of AD patients (GSE48552), with special attention to “ignored” tRFs. We found that the overall tRF expression was together enhanced in the AD group, which was higher than the fold increase in microRNAs (miRNAs) and PIWI-interacting RNAs (piRNAs) in AD, implicating the importance of tRFs in human AD. Intriguingly, the top ten tRFs are all derived from the 5’-end of tRNAs (tRF5). Using human hippocampus tissues, we also found the aberrant expression of several tRF5s in AD patients.
Cells use different ribonucleases to produce different types of tRFs. The biogenesis of tRF5 has been reported to be controlled by ribonuclease ANG or Dicer [19, 20]. ANG usually cleaves tRNAs before or after the anticodon loops, resulting in the production of tRF5 with 30- or 40-nt long, respectively [19]. Dicer-dependent cleavage often leads to the accumulation of tRF5 with a length of around 20 nts [20, 21]. In human hippocampus tissues, the majority of AD-affected tRFs were 30–40 nt long. Meanwhile, AD patients had enhanced expression of ANG, but showed comparable Dicer expression with healthy controls, supporting ANG-mediated cleavage. The exception was tRF5-ProAGG, which had two isoforms, with the long- and short-form having 32 and 18 nts respectively, suggesting a different biogenesis mechanism of tRF5-ProAGG.
In this study, we also explored the possible role of NOP2/Sun RNA methyltransferase 2 (NSun2) in AD, as NSun2-mediated cytosine-5 RNA methylation (m5C) modification has been reported to be essential for keeping tRNAs from ANG cleavage, contributing to tRNA stability [22], and many AD-related tRFs are derived from tRNAs, which are the substances of NSun2 [23]. We found that there was a significant decrease in NSun2 expression in the EOAD group, suggesting a possible association between decreased NSun2 and enhanced tRF production in that group.
In summary, this is the first report demonstrating the changes of tRFs in AD. Whether the impacted tRFs can be used as potential biomarkers and therapeutic targets for AD needs to be further investigated in the future.
MATERIALS AND METHODS
Human hippocampus specimens
Tissues were requested through the National Institutes of Health (NIH) NeuroBioBank (https://neurobiobank.nih.gov/). Thirty-four postmortem hu-man hippocampus samples were obtained from the Human Brain & Spinal Fluid Resource Center (CA, US), the University of Maryland Brain and Tissue Bank (MD, US), the Mount Sinai NeuroBioBank (NY, US), and the Harvard Brain Tissue Resource Center (MA, US). These samples included 14 con-trols, 15 samples from individuals with a neuropathological diagnosis of AD at Braak stage 5∼6, and 5 tissues from individuals at Braak stage 3. The characteristics of the patients were listed in Table 1.
Characteristics of AD patients and controls
Bioinformatic analysis
A global sncRNA expression profile in the brain of AD patients, deposited in the Gene Expression Omnibus (GEO) database with an accession #: GSE48552, was reanalyzed recently. In brief, the raw data was downloaded and individual sequences with read numbers ≥10 were classified by comparing them to the miRNA database (miRBase; http://www.mirbase.org), the rRNA database (RDP; http://rdp.cme.msu.edu/), the tRNA database (GtRNAdb; http://gtrnadb.ucsc.edu/), and the Exon-Intron Database (EID; http://www.utoledo.edu/med/depts/bioinfo/database.html). In high-throughput sequencing, the cloning frequency of a sncRNA provides a digital measure of its relative expression level. Therefore, we calculated the relative sequencing frequency of each sncRNA by dividing its raw read numbers by the total read numbers of each experimental group, similarly as we previously described in [13].
qRT-PCR
The total RNA was extracted from frozen hippocampus samples using TRIzol reagents (Thermo Fisher Scientific, MA, US). To measure the genes of interest, iScript cDNA Synthesis Kit (Bio-Rad, CA, US) was used to generate cDNA, followed by qPCR, using iTaq Universal SYBR Green Supermix (Bio-Rad) as we previously described [13]. Ribosomal Protein L13 (RPL13), one of the most stable housekeepers in AD autopsy brain tissue was employed for normalization [24]. The primers used to examine ANG, Drosha, Dicer, NSun2, and cleavage and polyadenylation factor I subunit 1 (CLP1) expression are shown in Table 2.
Sequence information of qRT-PRC primers
A schematic representation of specific quantifi-cation of tRF5s by qRT-PCR was shown in Supplementary Figure 1. To quantify tRFs, we first made the 3’-hydroxyl of tRF5s by treating total RNA with T4 polynucleotide kinase (T4PNK, NEB, MA, US) according to the manufacturer’s instructions. The treated RNAs were subsequently exposed to a ligation reaction with a 3’-RNA linker using T4 RNA ligase (Thermo Fisher Scientific, MA, US), and the product was used as a template for reverse transcription (RT) with primer against the linker. The RT products were subjected to SYBR Green qPCR (iTaq™ Universal SYBR Green Supermix, Bio-Rad) using a forward primer specific to a tRF5 of interest and a reverse primer specific to a 3’ linker, and 18S was used for normalization. The sequences of the primers and 3’-RNA linker are listed in Table 3.
The sequence of tRFs, RT primer, and qPCR primers
Western blot
The hippocampus proteins were prepared using RIPA buffer (Thermo Fisher Scientific, MA, US), followed by protein quantification using BCA Protein Assay Kit (Thermo Fisher Scientific, MA, US). The western blot was done similarly, as we previously described, using antibodies against ANG (Santa Cruz sc-74528, TX, US), Drosha (Santa Cruz sc-393591, TX, US), Dicer (Cell Signaling Technology #3363, MA, US), or GAPDH (Santa Cruz-47724, TX, US) antibodies [25].
Northern blot (NB)
Northern hybridization for tRFs was performed as described [26]. Briefly, 5μg RNA was separated in 15%denaturing polyacrylamide gel with 7 mol/l urea and then transferred to a positively charged nylon membrane (Amersham Biosciences, NJ, US). The membrane was hybridized with a 32P-labeled DNA probe reversely complementary to the tRF of interest in ULTRAhyb-Oligo solution (Life Technologies, NY, US), followed by washing according to the manufacturer’s instructions.
Statistical analysis
The experimental results were analyzed using Graphpad Prism 5 software. Group comparison was done by non-parametric statistics methods since the sample size throughout was small and distributional assumptions were not able to be met. Specifically, an unpaired two-tailed Mann-Whitney U test was used for the comparison of two independent groups, while the Kruskal-Wallis test was used for Fig. 3G, where four groups of patients with various disease stages were compared. Single, two, and three asterisks represent a p-value of <0.05, <0.01, and <0.001, respectively. Means±standard errors (SE) are shown. For correlation analyses, we performed Spearman’s rank correlation test. Spearman’s rank correlation coefficient (Rs) was used to determine correlations. A p-value of less than 0.05 was considered significant.
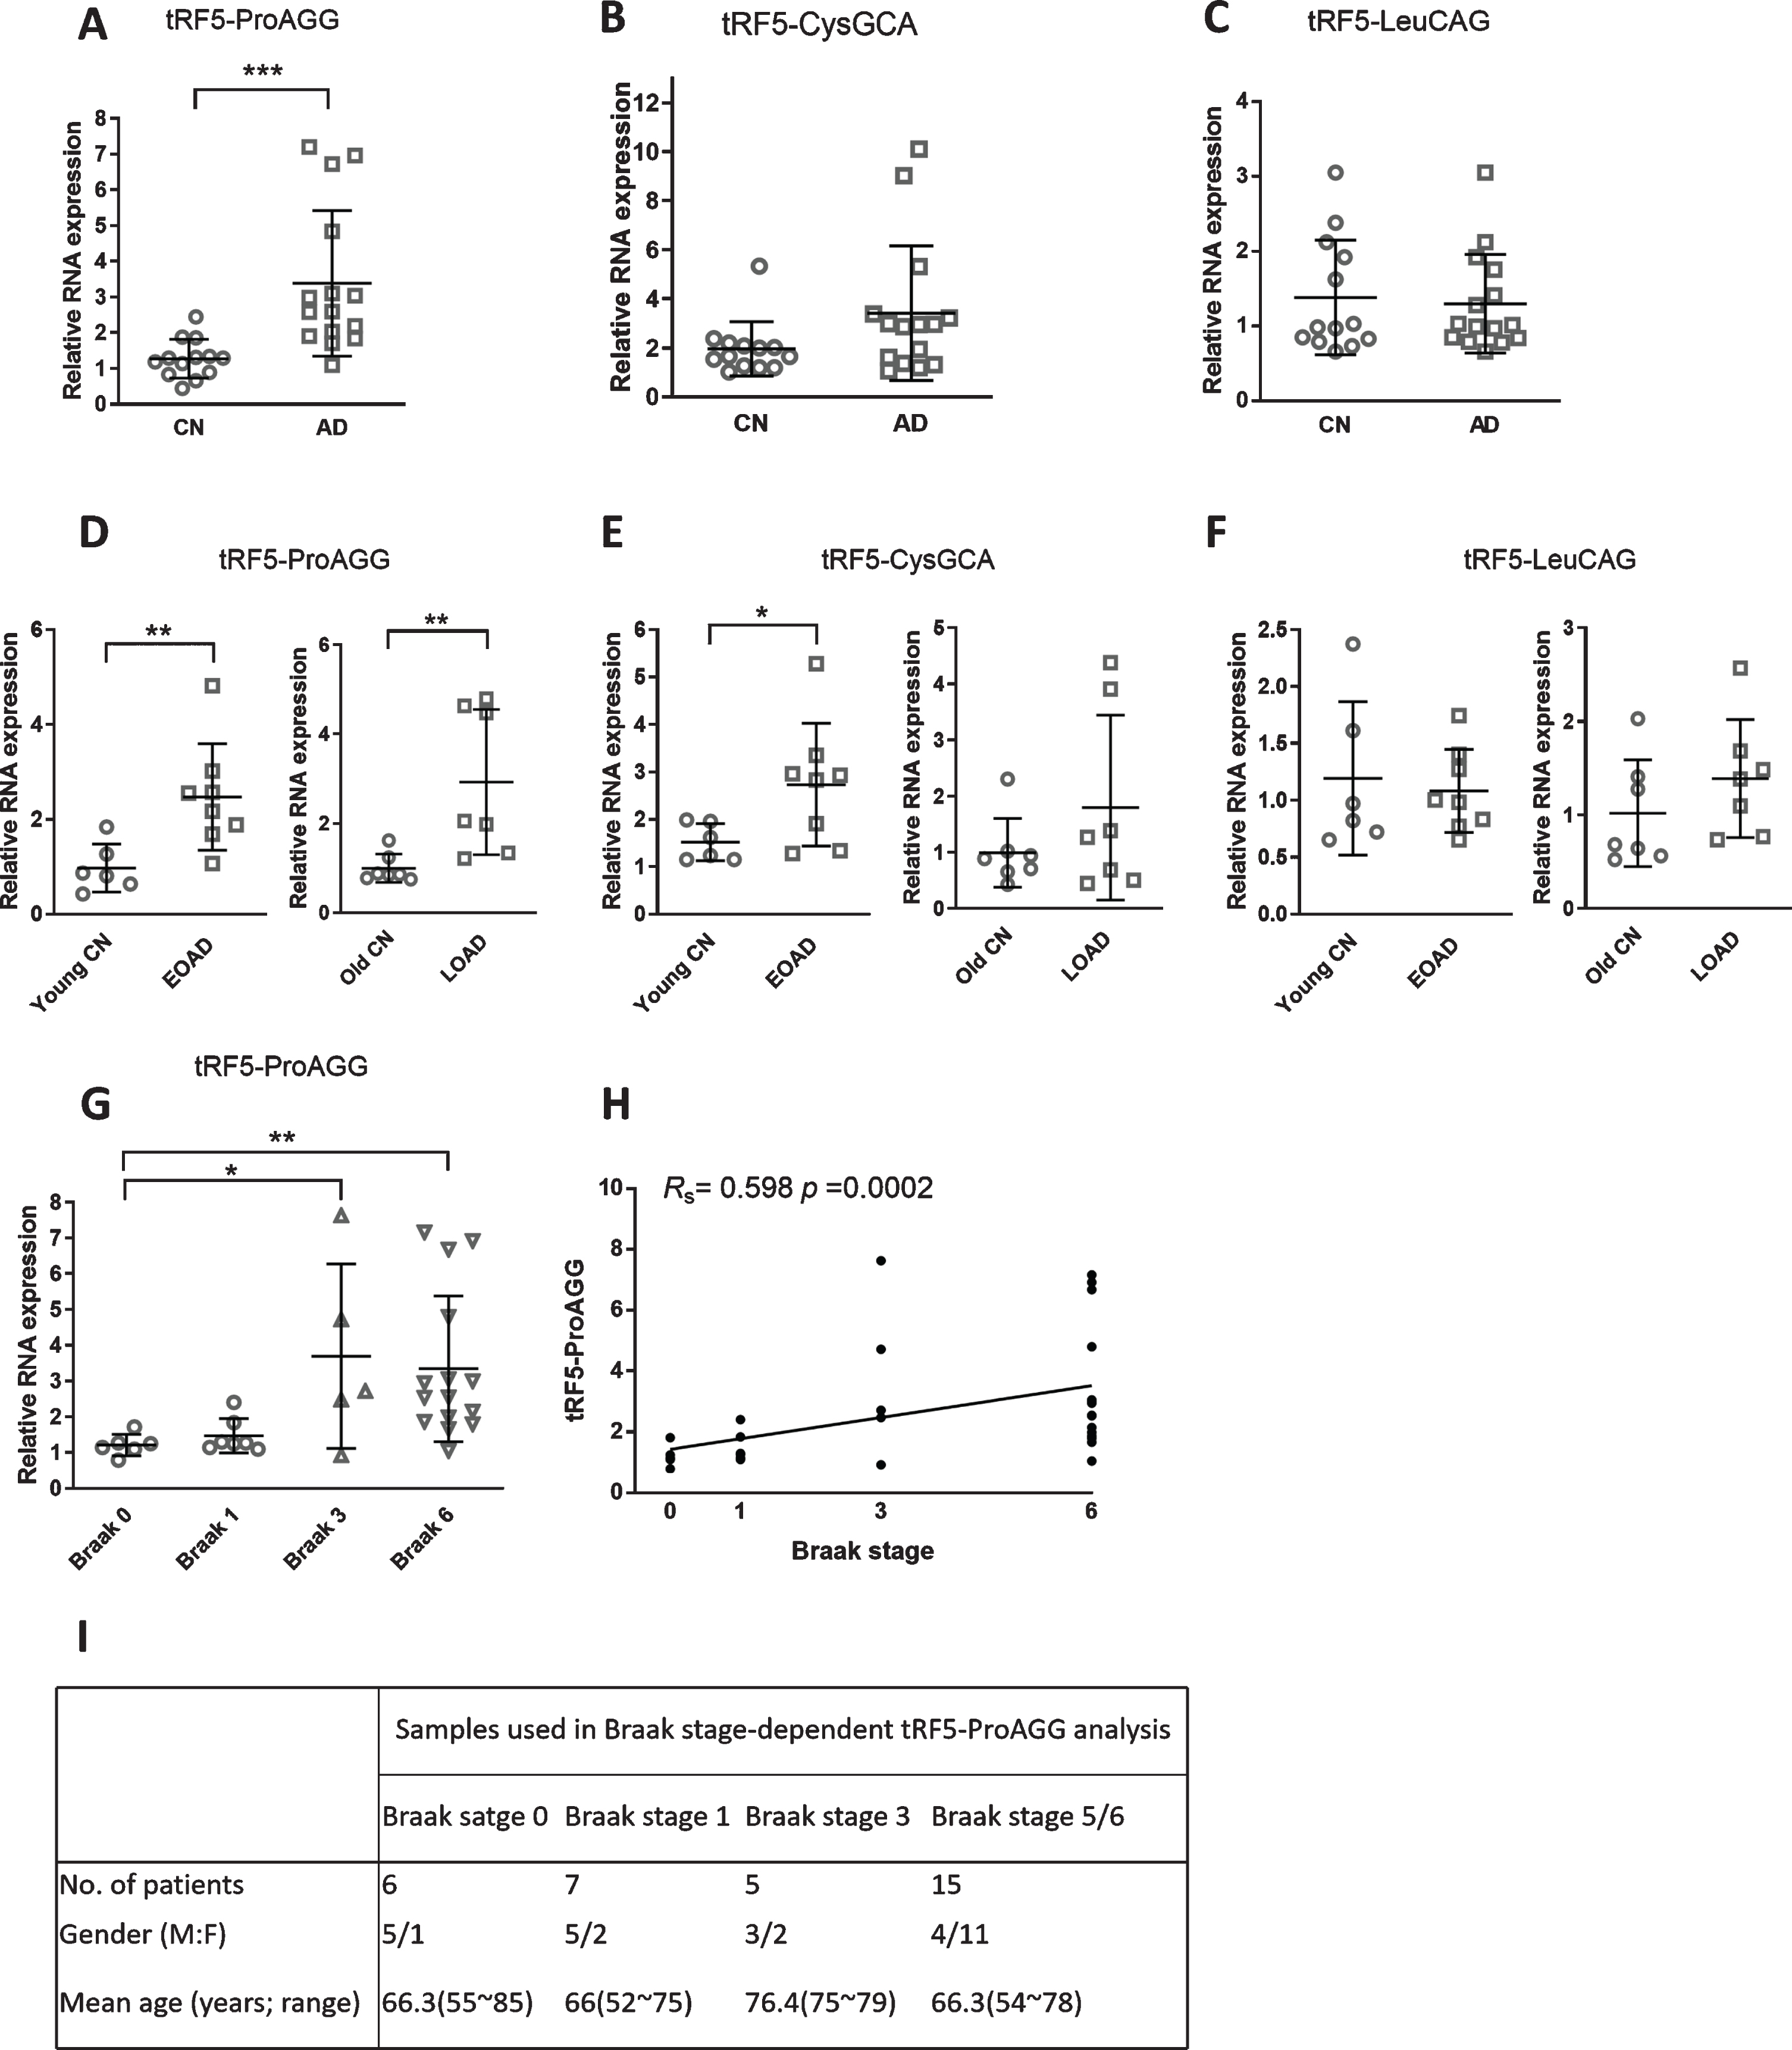
The expression changes of tRF5-ProAGG, tRF5-CysGCA, and tRF5-LeuCAG in AD. A-C) qRT-PCR was performed to detect tRF5-ProAGG (A), tRF5-CysGCA (B), and tRF5-LeuCAG (C) in the hippocampus of control and AD patients, described in Fig. 2. D-F) The expression of tRF5-ProAGG (D), tRF5-CysGCA (E), and tRF5-LeuCAG (F) was compared in the subgroups of EOAD and LOAD with respective paired controls as illustrated in the figures. G) Braak stage-dependent expression of tRF5-ProAGG. The expression of tRF5-ProAGG was plotted according to the Braak stages. H) A graphic demonstration of Spearman’s rank correlation between tRF5-ProAGG expression and Braak stage. I) Patient information. *p < 0.05, **p < 0.01, and ***p < 0.001. Data are shown as means±SE.
RESULTS
Both tRFs and ANG were upregulated in AD patients
We reanalyzed online data from the GEO DataSets with an accession #: GSE48552. The deposited raw high throughput sequencing data of small RNAs were obtained from the samples of six LOAD patients (72.2±6.0 years old) and six age-matched controls (72.3±10.4 years old). Among samples, we identified 244 tRFs with base mean reads >100. In AD patients, there were considerable changes in tRFs and miRNAs. As shown in Fig. 1A, tRFs and miRNAs accounted for 5.95±2.16%and 32.40±5.92%of the total mapped reads in the control group. The percentages of tRFs and miRNAs had a 2.4- and 1.5-fold increase in the AD group, respectively. However, piRNAs expression was comparable in the control and AD groups, suggesting that the most affected sncRNAs in AD are tRFs. In Table 4, the sequences and base mean of the top 10 expressed tRFs are listed.
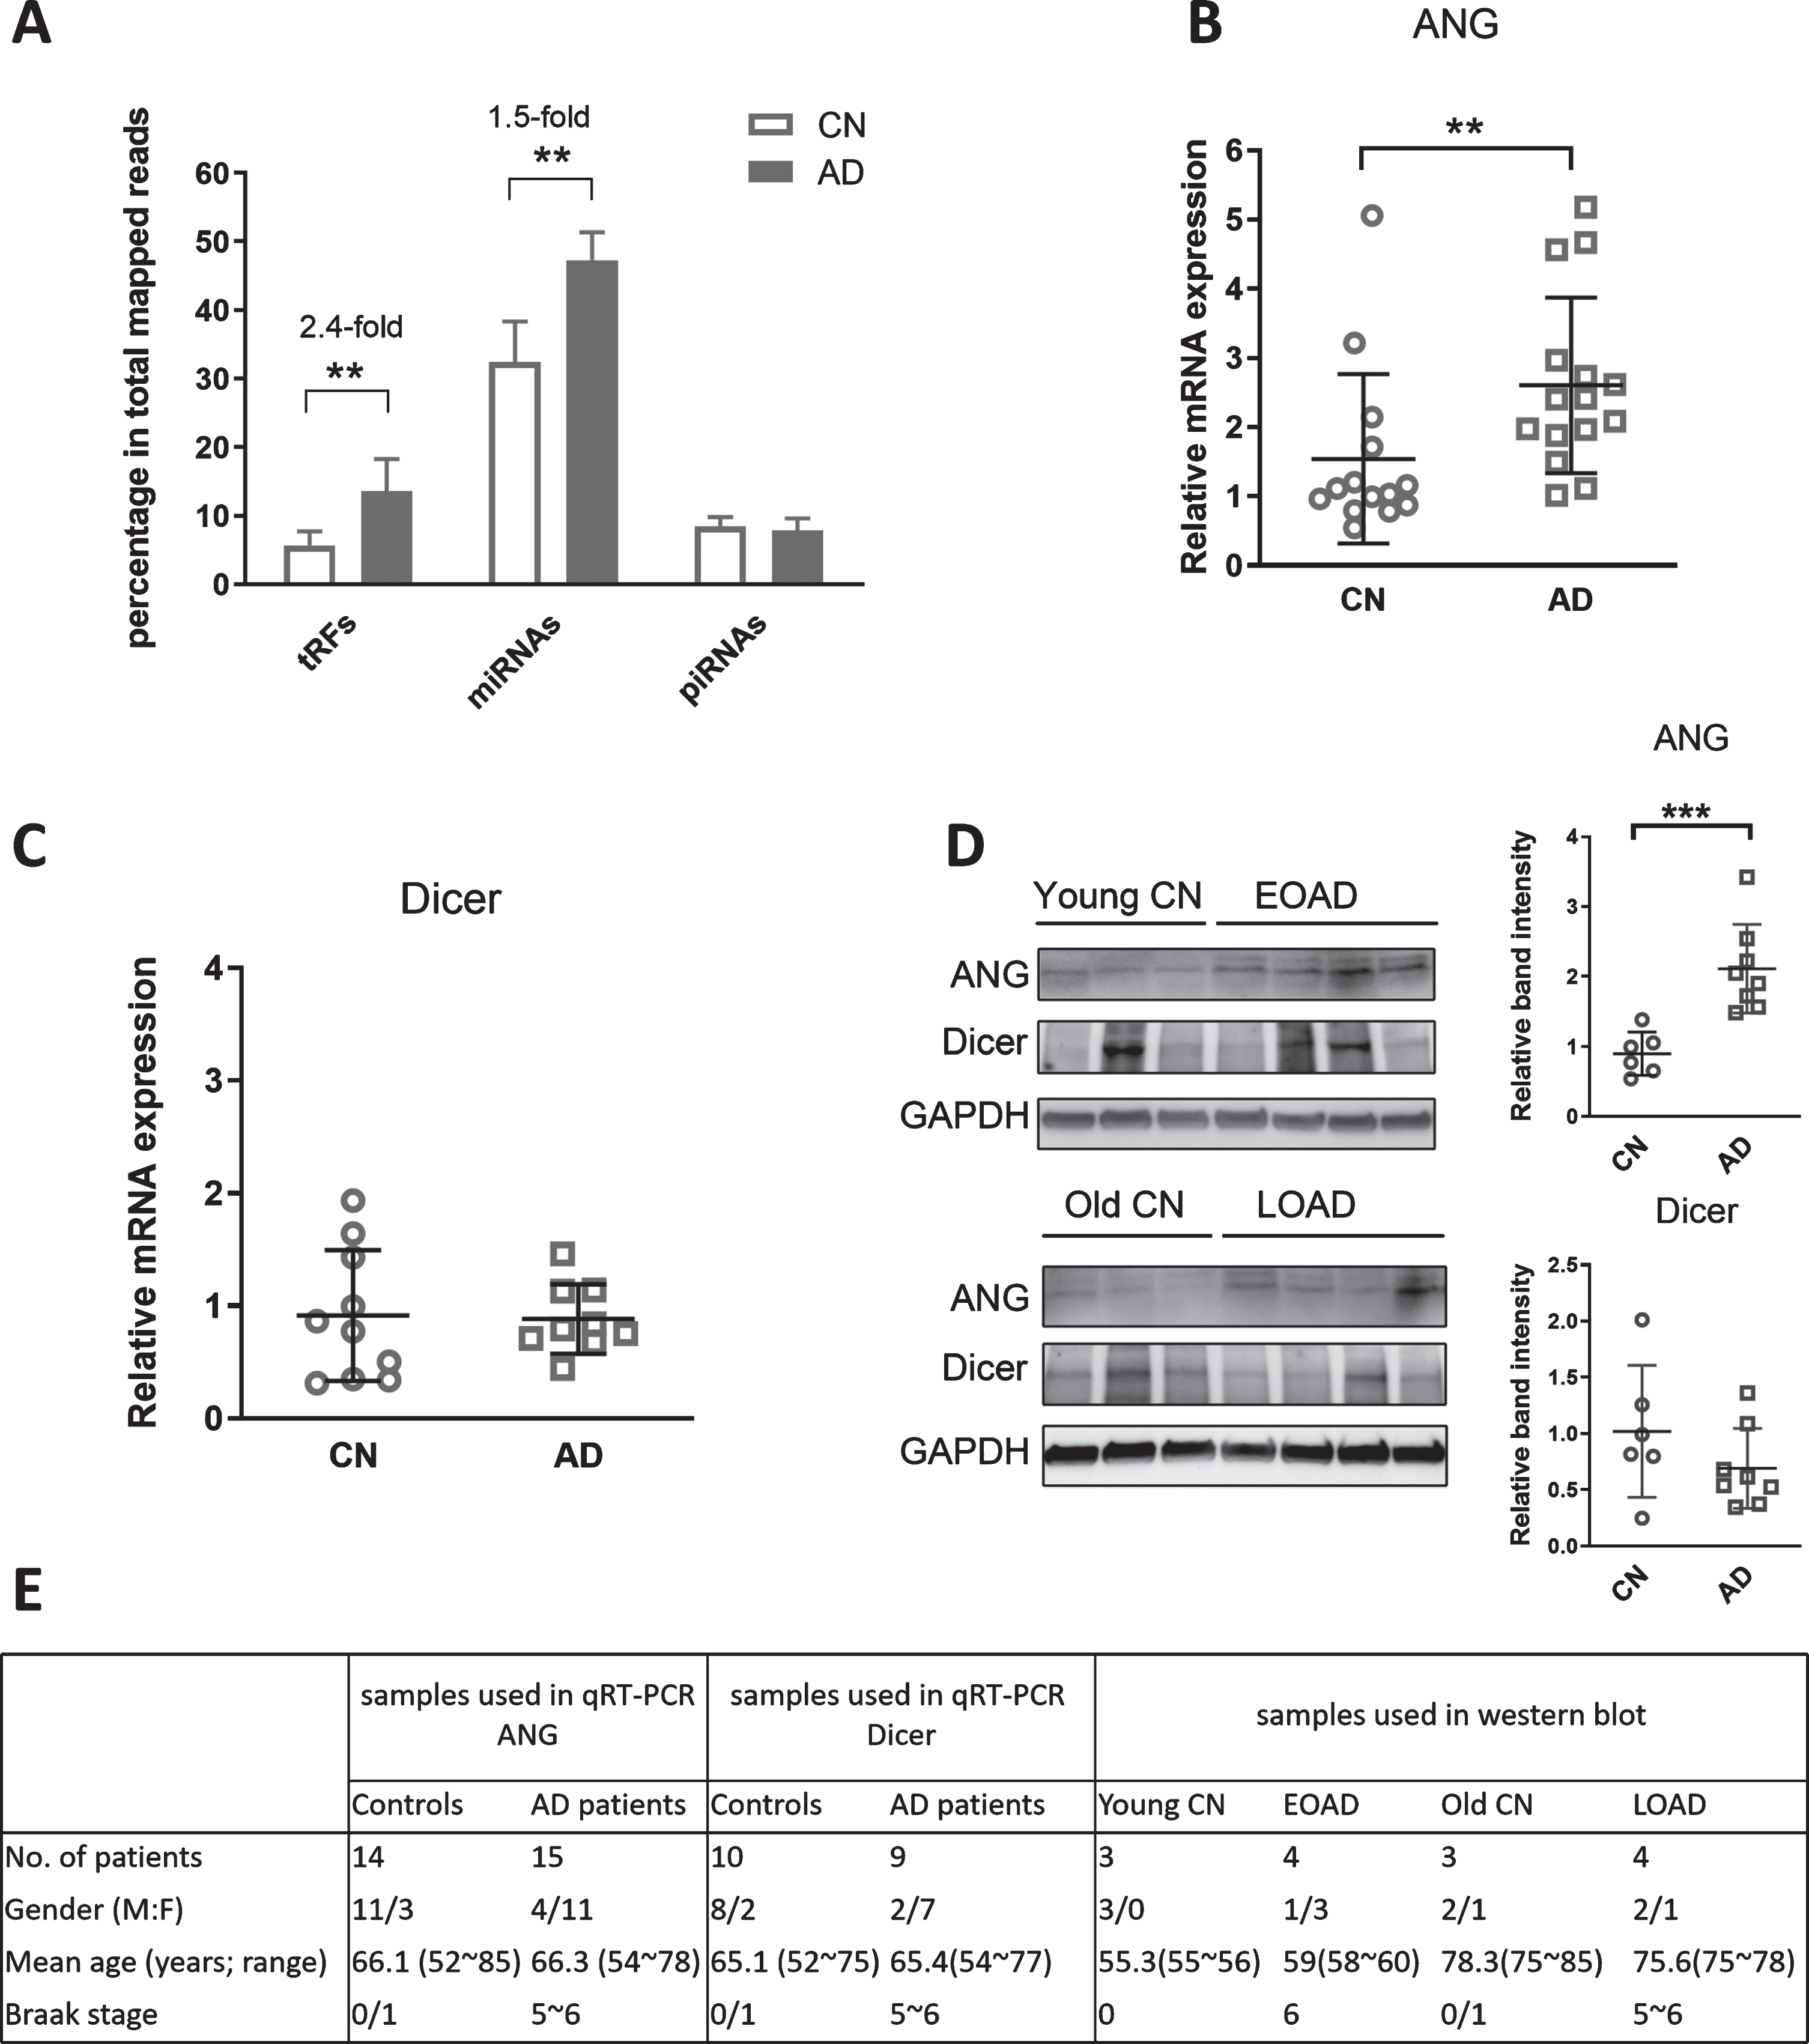
Changes of ribonucleases and sncRNAs in AD patients. A) Reanalysis of sncRNAs deposited in GSE48552. The relative sequencing frequency of tRFs, miRNAs, and piRNAs was calculated by dividing their raw read numbers by the total read numbers of each experimental group reads. B, C) The mRNA expression of ANG and Dicer. qRT-PCR was performed to detect the mRNA expression of ANG (B) and Dicer (C) in the hippocampus. RPL13 was used as an internal control. D) The protein expression of ANG and Dicer. Western blot was performed to detect ANG and Dicer protein expression levels in the hippocampus. GAPDH was used as an equal loading control. GAPDH-normalized band intensity of ANG and Dicer was determined by ImageJ. E) The corresponding patient information for samples used in B-D. All statistical comparisons were performed using an unpaired two-tailed Mann-Whitney U test. *p < 0.05, **p < 0.01, and ***p < 0.001 relative to the paired control (CN) group as illustrated. Data are shown as means±SE.
Sequence information of top ten expressed tRFs deposited in GSE48552
In the sequencing study of GSE48552 [27], miRNAs were the main focus and the RNA sequencing samples were not treated with T4PNK, an enzyme having 3′-terminal phosphatase activity that removes both a P and cP from the 3′-end of RNAs to form a 3′-OH end [28]. Since not all tRFs contain the 3′-OH end, tRFs without the 3′-OH end are unable to be ligated to sequencing barcode [21, 29]. Therefore, T4PNK-untreated sequencing likely left these tRFs unsequenced. For this reason, we did not compare the reads for individual tRFs between control and AD groups. Nevertheless, the study suggested aberrant tRF expression in AD (Fig. 1A).
tRFs are usually classified into three groups: tRF5 which is derived from the 5’-end of mature tRNA, tRF3 whose sequence is aligned to the 3’-end of mature tRNA, and tRF-1 which is the 3’-trailer sequence of pre-tRNAs [26]. Notably, the top ten expressed tRFs in the control group belong to all tRF5 of 30∼40 nt in length (Table 4).
To investigate the role of tRFs in AD development, we recently obtained the hippocampus, one of the main areas in the brain affected by AD [30, 31], from the NIH NeuroBioBank. We first investigated whether ribonucleases with a known function in controlling the tRF biogenesis are affected in AD. ANG usually cleaves tRNAs around the anticodon loops in response to stress or viral infections, resulting in 30–40 nt long tRFs [13, 19]. Our qRT-PCR results showed that ANG mRNA was significantly increased in the AD group, compared with the control group (Fig. 1B). Since Dicer is another ribonuclease responsible for generating 20-nt long tRFs in cancer [32, 33], we also quantified the mRNA expression of Dicer. As shown in Fig. 1C, Dicer mRNA expression was comparable between control and AD groups. In this patch of samples (from the Harvard Brain Tissue Resource Center), we were fortunate to get both EOAD and LOAD samples. However, both LOAD and its age-matched group had less than five samples, not enough for power analysis. Therefore, the significance of ANG in the EOAD and LOAD group was not investigated separately. Even though the sample size of some subgroups was not ideal, some hippocampus tissues were relatively big so that protein samples could be prepared for western blot. As shown in Fig. 1D, we run some EOAD samples and their controls in one gel and the LOAD samples and their controls in another one. Both western blots suggested higher expression of ANG in both EOAD and LOAD, compared with their respective control groups. The overall normalized band intensity of ANG also demonstrated ANG to be significant in AD, compared to the healthy controls, while the protein expression of Dicer was comparable between the AD and control groups (Fig. 1D).
Affected tRF5s in the hippocampus in AD
As shown in Table 4, tRFs from the 5’-end of tRNA-GlyGCC and tRNA-GluCTC, namely tRF5-GlyGCC and tRF5-GluCTC, are the two most abu-ndant basal tRFs. These two tRF5 are also abundant in the primate’s cerebellum, hippocampus, and liver [34]. Therefore, we started investigating the expression of tRF5-GlyGCC and tRF5-GluCTC in the hip-pocampus of AD patients. Our qRT-PCR results demonstrated that both tRF5-GlyGCC and tRF5-GluCTC were significantly increased in the AD group by 2.0 and 1.8 folds, respectively (Fig. 2A, B). We also chose a tRF called tRF5-GlyCCC-2, which is a moderately expressed isoform (Table 4), to investigate the impact of AD on its expression. As shown in Fig. 2C, tRF5-GlyCCC-2 was increased in AD by 1.57 folds, suggesting its involvement in AD, as well.
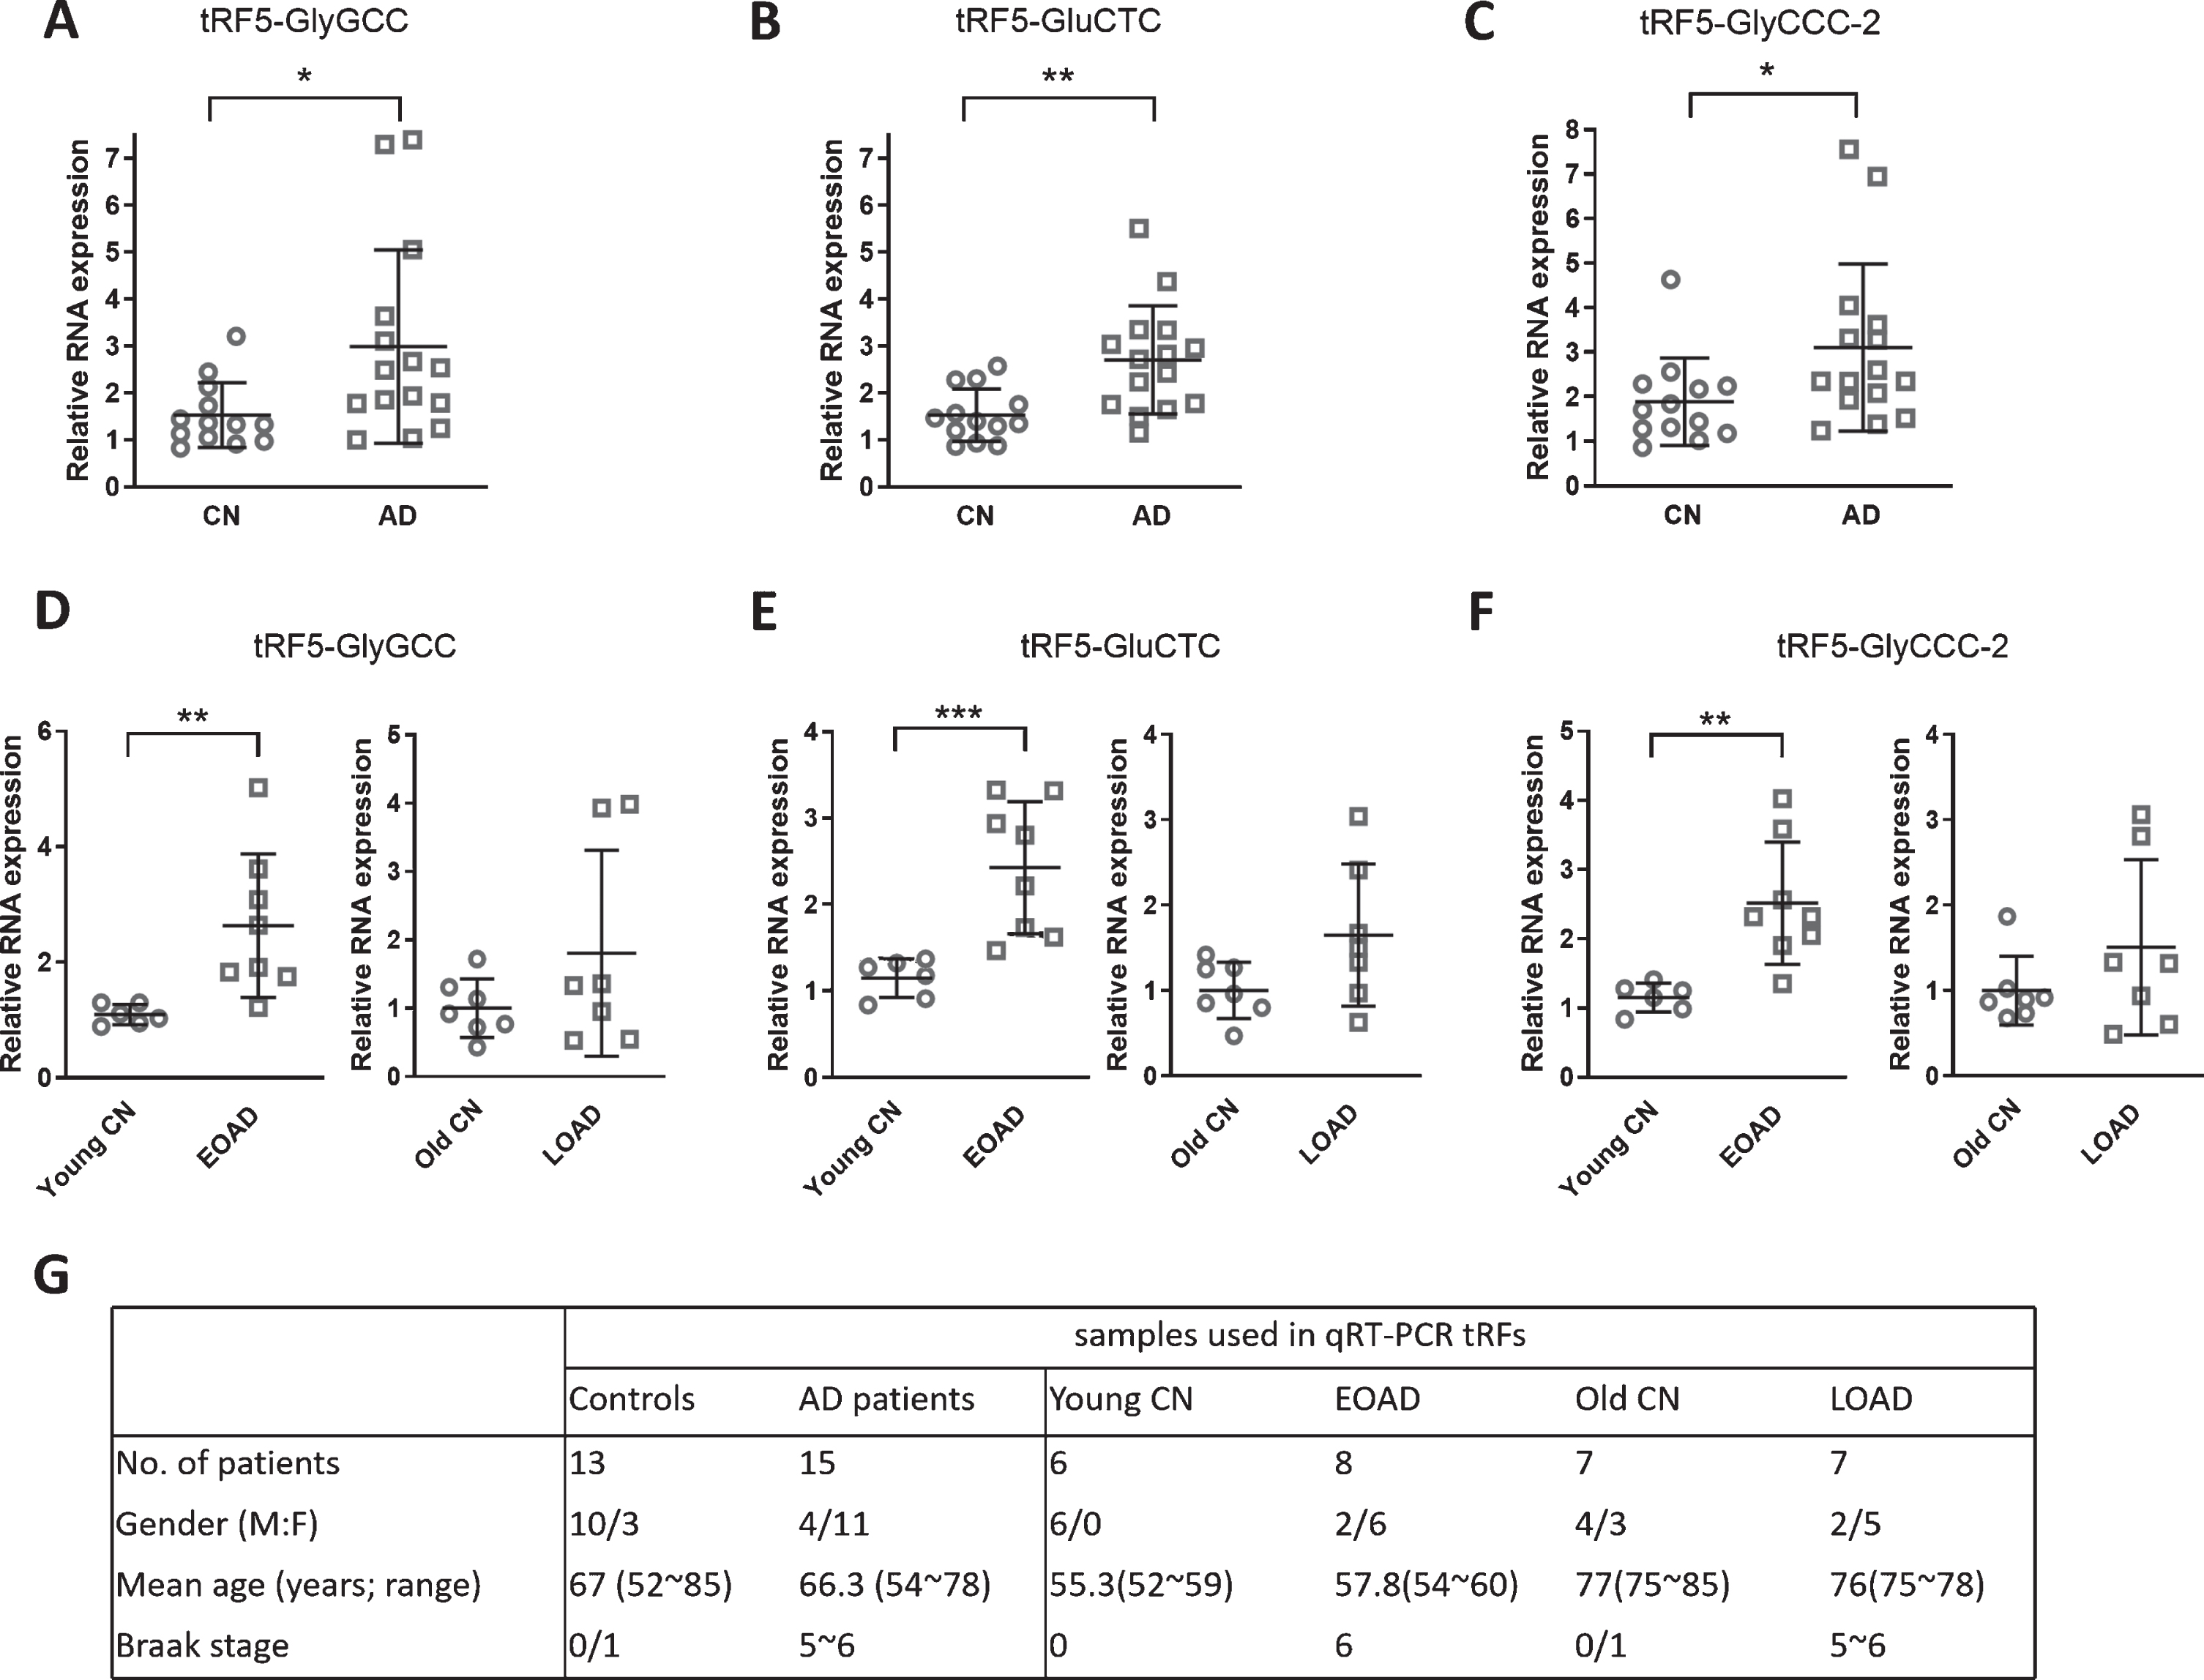
Changes in the expression of tRF5-GlyGCC, tRF5-GluCTC, and tRF5-GlyCCC-2 in AD. A-C) qRT-PCR was performed to detect tRF5-GlyGCC (A), tRF5-GluCTC (B), and tRF5-GlyCCC-2 (C) in the hippocampus from control and AD patients. All the expression was normalized by the internal control 18 s RNA. D-F). The hippocampus expression of tRF5-GlyGCC (D), tRF5-GluCTC (E), and tRF5-GlyCCC-2 (F) were also analyzed in subgroups of EOAD and LOAD. G) Patient information for samples used in A-F. Unpaired two-tailed Mann-Whitney U tests were performed for statistical comparisons. *p < 0.05, **p < 0.01, and ***p < 0.001, relative to the paired control group as illustrated. Data are shown as means±SE.
The experiments starting from Fig. 2 used samples from other NIH NeuroBioBank resource centers in CA, MD, and NY. Although the overall tissues were tiny and not enough to carry out western blot if needed, each subgroup (the EOAD and its age-matched control; LOAD and its age-matched control) had six or more samples. Therefore, we tried to investigate the significance of interested tRFs in the EOAD and LOAD separately. We found that all th-ree tRF5s shown in Fig. 2A-C had a significant increase in EOAD patients, compared with their age-matched controls (young controls). tRF5-GlyGCC, tRF5-GluCTC, and tRF5-GlyCCC-2, respectively, showed a significant increase of 2.6, 2.1, and 2.3 folds in the EOAD group, compared with its age-matched control group (left panels of Fig. 2D-F). The LOAD group did not show a significant difference in the expression of these tRFs, compared with its age-matched healthy control group (right panels of Fig. 2D-F). Among these three tRFs, the expression of tRF5-GluCTC showed an increasing trend toward significance in the LOAD (1.6-fold, p = 0.07, right panel of Fig. 2E), compared with the age-matched control group. More samples are probably needed in the future to define the significance of these tRFs.
Other than the three tRFs mentioned above, other tRF5s were also chosen for the study, as they were reported to be functional in other biological settings. For example, tRF5-ProAGG has been reported to interact with ribosomes and inhibit global translation [35]. tRF5-CysGCA can impede translation initiation, induce the assembly of stress granules, and have neuroprotective effects [36]. tRF5-LeuCAG promotes cell proliferation and cell cycle in non-small cell lung cancer [37]. Hence, we assessed these three tRF5 in the hippocampus of AD pat-ients. We found that tRF5-ProAGG had a significant 2.8-fold increase. However, tRF5-CysGCA and tRF5-LeuCAG were comparable in the control and AD groups (Fig. 3A-C). We also did subgroup analyses of tRFs shown in Fig. 3A-C. We found that tRF5-ProAGG had a significant 2.6- and 2.9-fold increase in the EOAD and LOAD groups, respectively, compared with their paired control groups (Fig. 3D). tRF5-CysGCA indeed showed a significant increase in EOAD (left panel of Fig. 3E), even though the significance was not observed in the overall AD patient samples (Fig. 3B). In contrast, no changes in the expression of tRF5-LeuCAG were observed in either the EOAD or LOAD group (Fig. 3F).
Given the significance of tRF5-ProAGG in AD, we also explored whether it also shows stage-dependent expression. In brief, 27 samples were provided with Braak stage information. 6 samples with Braak stage 0 were used as controls. Our result indicated tRF5-ProAGG showed a significant increase at Braak stages 3 and 6, but no difference at stage 1, demonstrating stage-dependent expression of tRF5-ProAGG (Fig. 3G). We next tested for correlation of tRF5-ProAGG with the Braak stage. As shown in Fig. 3H, the tRF5-ProAGG expression level positively correlated with the Braak stage (Rs = 0.598, p = 0.002).
One more interesting thing about tRF5-ProAGG is its molecular size. Although the melt curve of qRT- PCR for tRF5-ProAGG showed a single peak, the melting temperature of amplified products was 1°C higher than other tested tRFs. We, therefore, seque-nced all tRFs, after qRT-PCR products being inserted into the pGEM®-T Vector (Promega, WI, US), by Sanger sequencing. Unlike other qRT-PCR products, who demonstrated a single product, tRF5-ProAGG clones showed a 32-nt product with the sequence: 5’-GGCTCGTTGGTCTAGGGGTATGATTCTCGCTT-3’ (long form) and an 18-nt product with the sequence: 5’-GGCTCGTTGGTCTAGGGG-3’ (sho-rt form). Furthermore, NB confirmed two isoforms of tRF5-ProAGG (Fig. 4). Both isoforms were increased in the EOAD and LOAD groups.
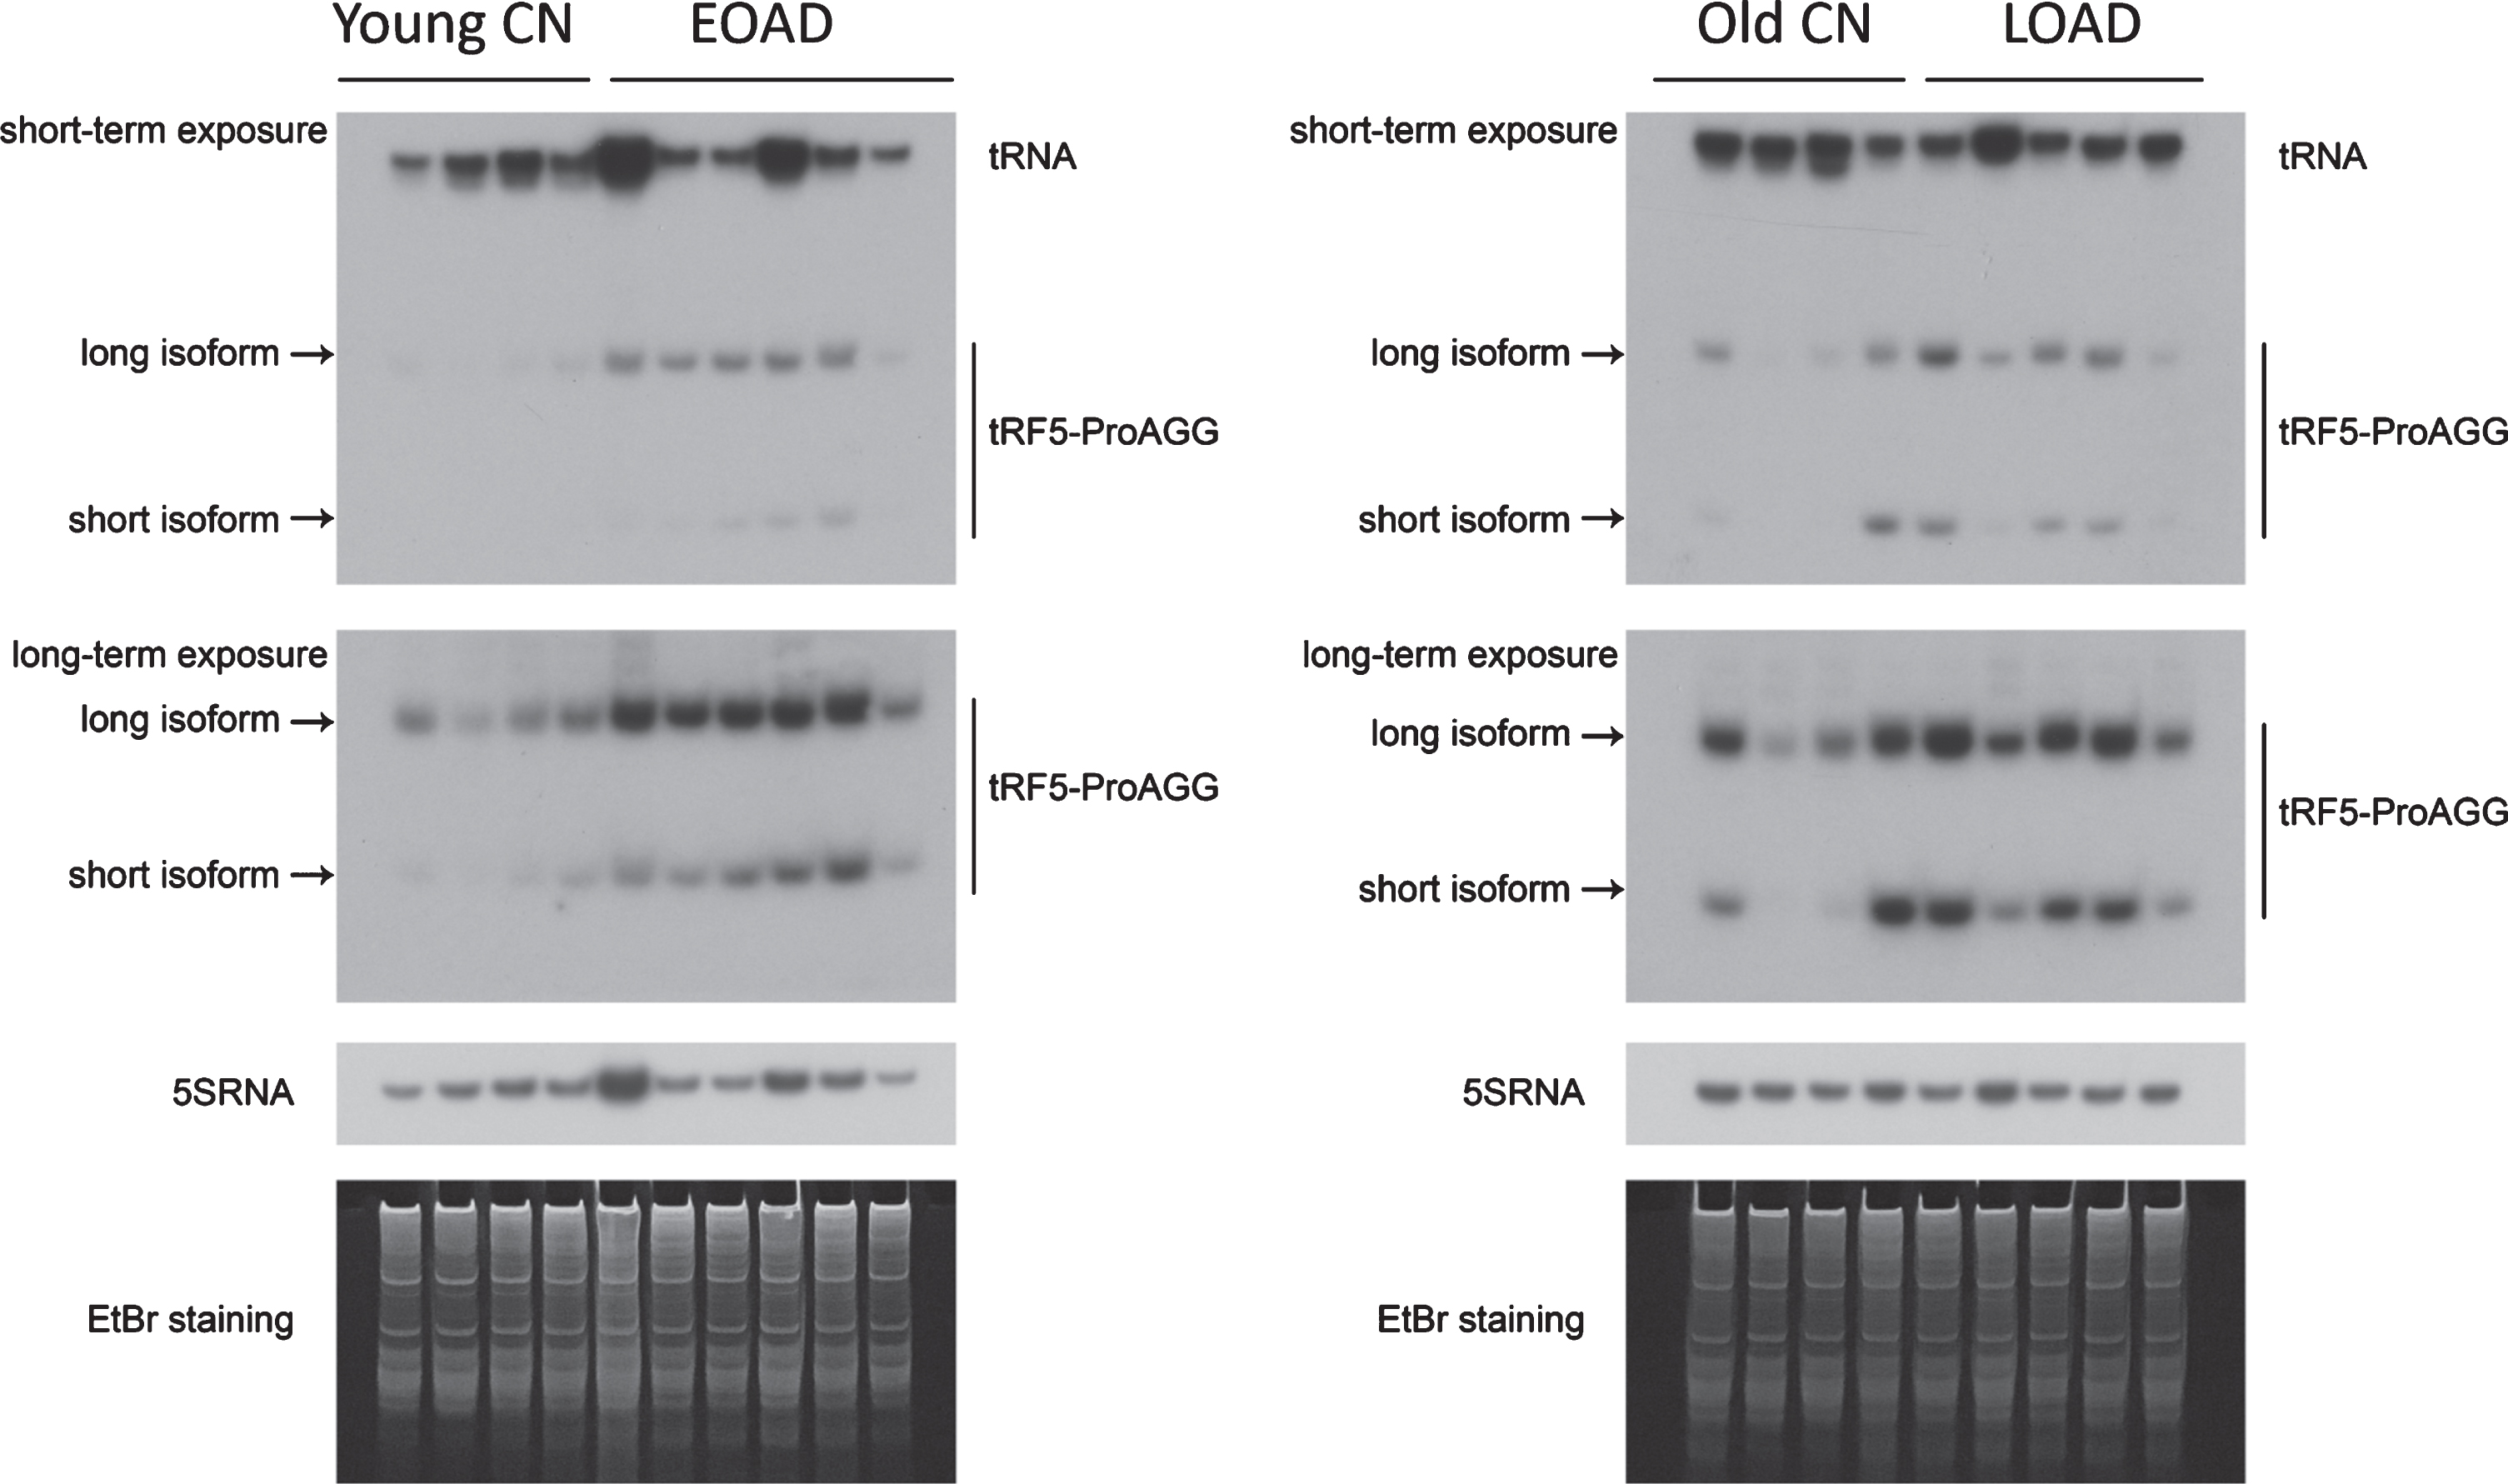
Two isoforms of tRF5-ProAGG. Northern blot was carried out to confirm the presence of long and short isoforms of tRF5-ProAGG in hippocampus tissues from EOAD and LOAD patients. Age-matched controls were included. 5s rRNA was used as an equal loading control.
NSun2 were decreased in EOAD
As shown in Fig. 1, ANG was increased in AD. It has been recently suggested that certain nt modifications of tRNAs determine their cleavage by ribonuclease. For example, NSun2-mediated 5-methylcytosine (m5C) methylation in tRNAs is essential for their stability [22, 23]. tRNAs lacking m5C methylation because of the decreased expression of NSun2 show increased affinity to ANG, and are prone to be cleaved [23]. tRNA modification controlled by CLP1, another multifunctional kinase, also contributes to tRNAs splicing [38]. The loss of CLP1 activity results in the accumulation of tRF5-Tyr, which sensitizes neurons to oxidative stress-induced cell death [38]. The CLP1-/- mice show a progre-ssive loss of spinal motor neurons [39]. In addition, patients with homozygous missense mutations in CLP1 (R140H) suffer from brain atrophy and severe motor-sensory defects [38, 40]. Therefore, we assessed NSun2 and CLP1 mRNAs expression in the hippocampus of EOAD and LOAD patients. Our results showed NSun2 mRNAs were downregulated in EOAD, compared with age-matched control (Fig. 5A), suggesting a possible association between the downregulation of NSun2 with ANG-mediated tRNA cleavage. Regarding CLP1, we did not detect any change in both EOAD and LOAD groups (Fig. 5B).
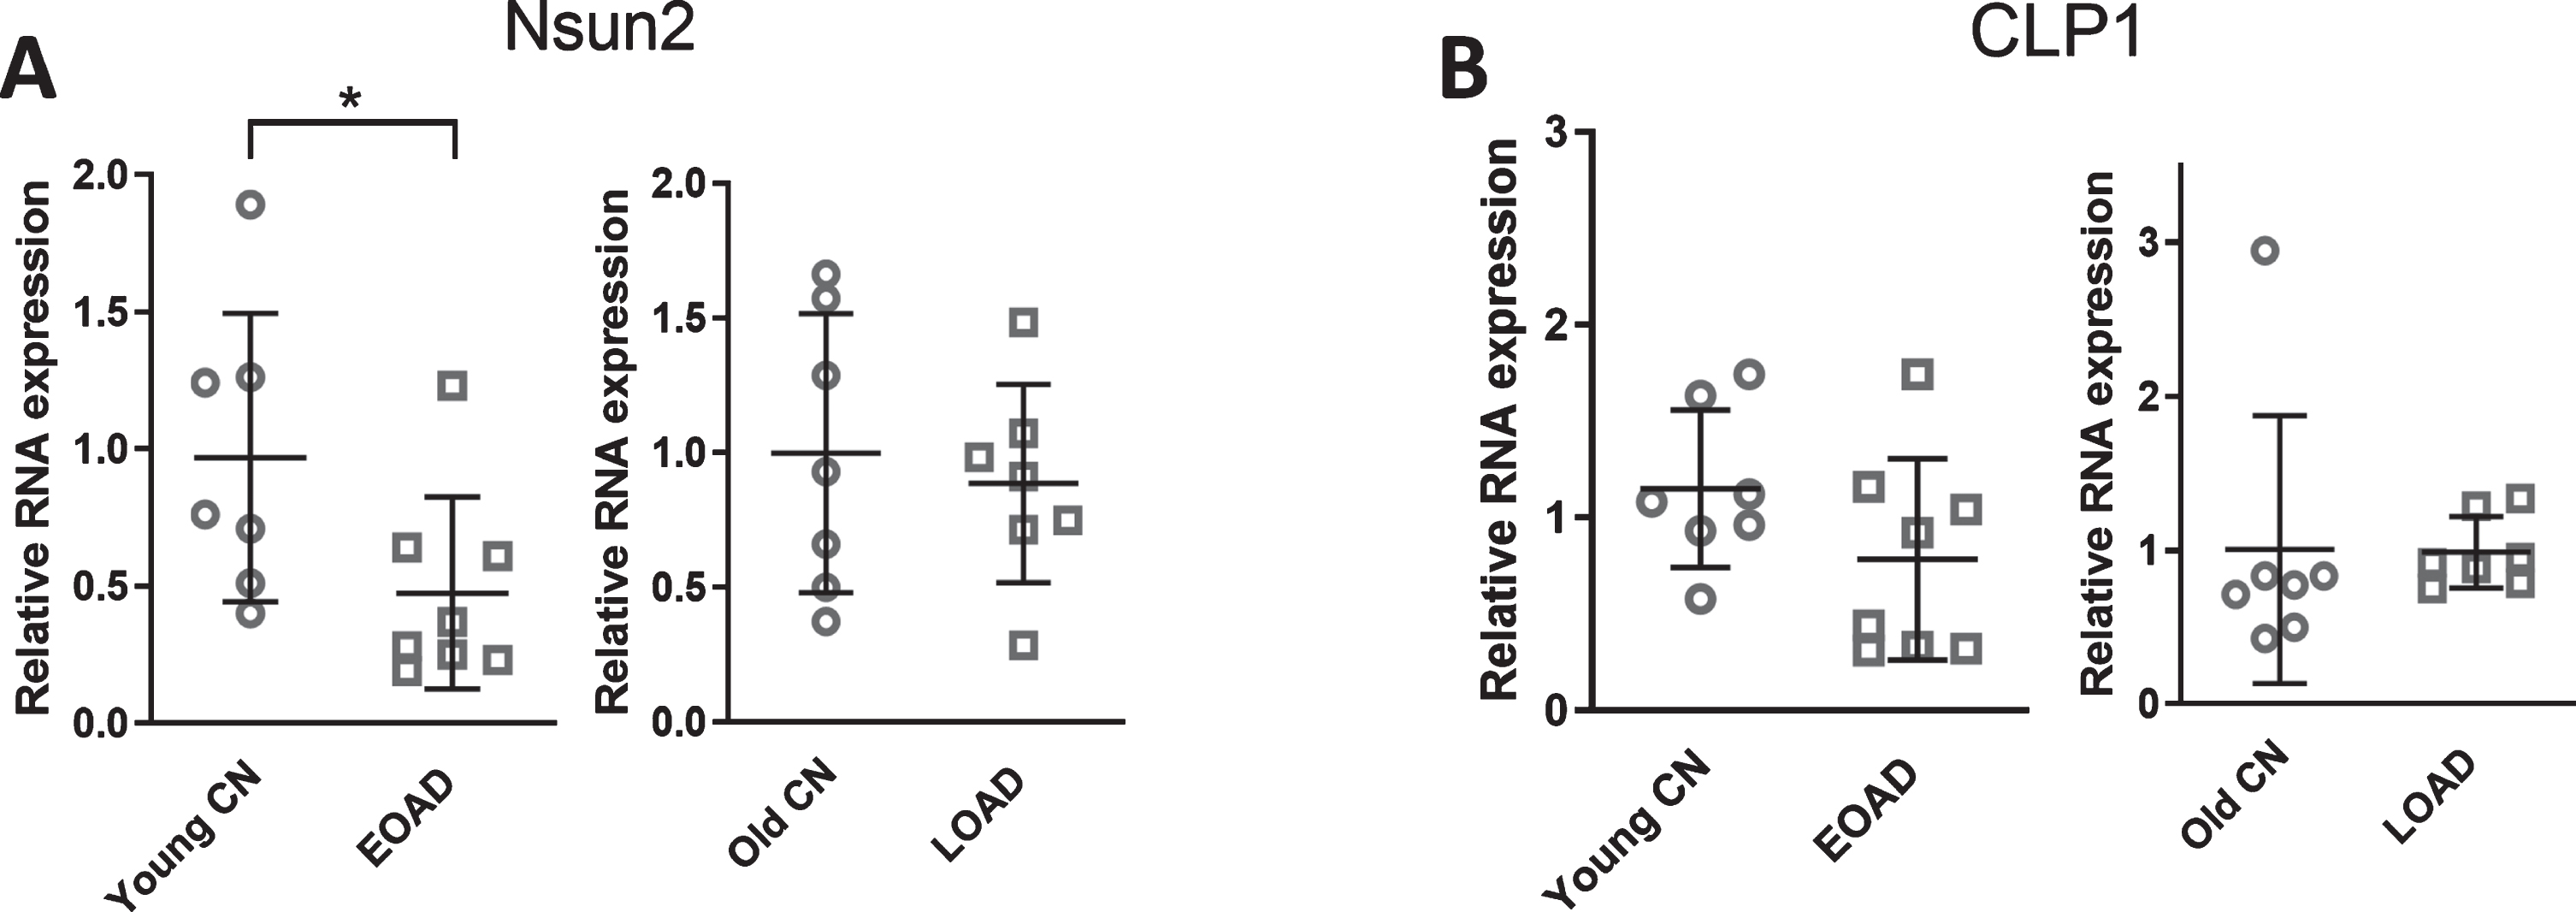
The expression of NSun2 and CLP1 expression in EOAD and LOAD patients. Hippocampus RNAs from EOAD and LOAD patients were used for qRT-PCR to quantify NSun2 (A) and CLP1 (B). Their respective age-matched controls were also included. The expression is present after the normalization by RPL13. The analyses and patient information were similar to what is described in Fig. 2. *p < 0.05, relative to the paired control group, as illustrated. Data are shown as means±SE.
DISCUSSION
AD is the most common form of dementia seen in late life, accounting for 60–80%of dementia cases [1]. In 2017, 121,404 patients died of AD, making AD the sixth leading cause of death in the United States [41]. In this study, we identified the altered expression of tRFs and their putative biogenesis controllers in the hippocampus of AD patients, providing new potential insight into the understanding of AD progression.
Given the fact that tRFs belong to a recently discovered family of sncRNAs, their expression and associated biogenesis and function mechanisms have not been investigated in ncRNA-related AD studies. ANG is a major endonuclease that cleaves mature tRNAs around the anticodon loops to generate tRFs in many biological settings [13, 29]. Several dysfunctional ANG gene variants have been identified to be associated with familial and sporadic cases of amyotrophic lateral sclerosis and Parkinson’s disease [42], and the reduced ANG levels in the cortex have been observed in an alpha-synuclein mouse model of Parkinson’s disease [43]. A nonsense ANG mutation has been also found in two AD patients (0.20%of the whole AD cohort), but more clinical data are needed to confirm its role [44]. In this study, we found that ANG was significantly increased in the hippocampus of AD patients. The increased ANG seemed associated with enhanced tRNA cleavage and tRF induction in the AD group. Nevertheless, more clinical information from these neurodegenerative diseases are needed to define the role of ANG in disease progression due to genetic predisposition or susceptibility.
NB is usually a routine method to experimentally detect and confirm tRF expression. We have used it to discover the tRFs induced by respiratory syncytial virus (RSV) infection and heavy metal pollutants [12–14]. However, RNA sequencing and NB confirmation require a relatively large amount of RNAs, which makes clinical samples with a limited amount of RNAs difficult to examine. qRT-PCR is a more sensitive way of detection. In addition, if qRT-PCR is well-designed, it can become semi-high throughput. However, a standard qRT-PCR protocol was thought to be impractical for tRF detection, because PCR primers will also amplify the signal from the corresponding mature tRNAs. To remove tRNAs signals, a probe-based qRT-PCR for tRF qualification was created by Yohei Kirino’s group [29]. Basically, extracted RNAs are treated with T4PNK to generate a hydroxyl group at the 3’-end of tRFs, followed by ligating the RNAs with a 3’ RNA linker. The tRF signals were singled out by using a probe which identifies the base pairs at the junction of the tRF5 of interest and the linker using qRT-PCR with the QuantiTect Probe RT-PCR Kit (Qiagen). However, for tRF detection, the tRF-specific probe is expensive. We found that adding the RNA linker followed by the SYBR Green-based qRT-PCR is more than enough to quantify most tRF5s in the hippocampus (Supplementary Figure 1). The probe indeed is not necessary. As demonstrated in Supplementary Figure 2A, the melt curve of qRT-PCR showed a single peak, suggesting a single PCR product. The PCR product for most tRF5s (using three tRFs shown in Fig. 2 as representative) in the denatured polyacrylamide gel also revealed only a single band of about 100 bp (tRF5 + RNA linker + RT primer nt extended beyond RNA linker), indicating the successful amplification and quantification of tRF5s without signals from mature tRNAs, which are supposed to be around 144 bp (tRNA+RNA linker + RT primer nt extended beyond RNA linker) if they can be reversely transcribed, or pre-tRNAs (SupplementaryFigure 2B). We also cloned the qRT-PCR products to the pGEM®-T Vector and our sequencing results also demonstrated the right products. The sequencing was done in the Genomics Core of UTMB and results are available upon request. There are possible two reasons why only tRFs were detected by probe-free qRT-PCR: 1) the linker favors the binding to tRF over to tRNA, as the 3-end of tRNA is usually attached with an amino acid [45], and/or 2) the temperature of the RT step does not favor the primer binding to tRNA, as tRNA reverse transcription requires a special denaturing temperature due to its cloverleaf secondary structure [46]. We, therefore, established a new modified qRT-PCR method for tRF5 quantification. Since all tRF5s have a common linker, the reverse primer is the same as all the test targets. In short, there is a significant saving in the elimination of the use of probes for each tRF5.
tRF5-GlyGCC and tRF5-GluCTC were reported to play important roles in various biological processes, including sperm maturation [47], RSV infection [13, 14], and breast cancer progression [48]. These two tRF5s were also significantly increased in the EOAD group and also showed an enhanced tendency in the LOAD group. In the future, more samples need to be requested to define the importance of these two tRFs in the LOAD. These two tRF5s are inducible by overexpression of ANG in cells, and the expos-ure of secreted ANG causes a complete cleavage of their parental tRNAs in vitro [49]. Interestingly, ANG cleavage is very tRNA type-specific. ANG overexpression in cells usually only cleaves one or two specific isodecoders (tRNAs with the same antico-don but different sequences elsewhere) of tRNA, while other isodecoders and isoacceptors (different tRNAs encoding the same amino acids with different anticodons) are not cleavable, suggesting a precise cellular control mechanism underlying ANG-mediated tRNA cleavage. Similar results were also observed in other tRF5s’ expression in AD.
tRF5-CysGCA has been shown to inhibit translation initiation and induce stress granules by ass-embling unique G-quadruplex (G4) structures and could protect motor neurons from stress-induced apoptosis and death [36]. We found the elevated tRF5-CysGCA only occurred in the EOAD group, and its basal level in the older and younger controls was comparable, suggesting tRF5-CysGCA may not be involved in brain aging. Compared with the LOAD group, the EOAD group had less hippocampal atrophy and hippocampal disease [50]. Therefore, increased tRF5-CysGCA may protect neurons in the hippocampus of EOAD patients and slow down the atrophy.
In this study, we found two isoforms of tRF5-ProAGG were enhanced in AD. The long isoform tRF5-ProAGG has been reported to interact with ribosomes and polysomes, leading to global translation inhibition and upregulation of a specific low molecular weight peptidyl-tRNA product [35]. Notably, this tRF5 is not stress-induced [35]. The role of the short isoform of tRF5-ProAGG is not known, but should be studied in the future. Nevertheless, we found both isoforms of tRF5-ProAGG increased in the EOAD and LOAD groups. Their enhancement was also observed in patients at Braak 3 and 6 stages, suggesting the expression of tRF5-ProAGG was stage-dependent and its potential role as AD biomarkers and therapeutic targets. Although some literature claims that not all AD cases have a tight association between the Braak stage and patient clinical presentation, most AD samples from the NeuroBioBank did not provide the information on clinical data, such as neuropsychology testing scores, neuroimaging, etc. Therefore, we will study whether the expression of tRF5-ProAGG correlates with AD clinical severity in the future.
From this study, we also investigated if NSun2-mediated methylation plays a role in controlling tRNA cleavage in AD. Several tRNAs, including tRNA GluCTC, tRNA GlyCCC, tRNA ProAGG, and tRNA LeuCAG, have m5C sites for NSun2-mediated methylation in stress-induced neuro-developmental disorders [23]. However, we did not see any changes in tRF5-LeuCAG expression in AD, either in EOAD or LOAD groups, compared with their age-matched controls, suggesting NSun2-mediated m5C on tRNA LeuCAG was not affected in AD.
The brain tissues of AD patients show pronounced changes in RNA metabolism [51]. In this study, we made an early observation of the association between the changes of some tRFs and AD progression. As discussed, our study has some limitations, such as the sample size of LOAD and the lack of clinical correlation information. Nonetheless, our finding that the abundance of several tRFs is significantly increased in the hippocampus tissues of EOAD groups. Thus, this study may have implications for disease early-onset mechanisms and novel prevention and therapeutic strategies. Notably, the increase in tRF5-ProAGG expression is age- and stage-dependent, suggesting its implication as a progression biomarker.
Footnotes
ACKNOWLEDGMENTS
We thank the NIH NeuroBioBank for coordinating the following centers: NIH-supported Human Brain and Spinal Fluid Resource Center in California, Department of Veterans Affairs-supported West Los Angeles Medical Center, and Harvard Brain Tissue Resource Center, to provide the human samples for the study. X.F. was supported by the Sealy Distinguished Chair in Alzheimer’s Disease, UTMB. This work was supported by grants from the NIH R01 AI116812, R21 AG069226, and FAMRI Clinical Innovator Award 160020 to X.B. We also thank Mrs. Cynthia Tribble for manuscript editing and Mr. Luke Yi Liu from Friendswood High School and miRcore for data analysis.
