
Abstract
Background:
Mild cognitive impairment (MCI) is considered to be the borderline of cognitive changes associated with aging and very early dementia. Cognitive functions in MCI can improve, remain stable or progress to clinically probable AD. Quantitative electroencephalography (qEEG) can become a useful tool for using the analytical techniques to quantify EEG patterns indicating cognitive impairment.
Objective:
The aim of our study was to assess spectral and connectivity analysis of the EEG resting state activity in amnestic MCI (aMCI) patients in comparison with healthy control group (CogN).
Methods:
30 aMCI patients and 23 CogN group, matched by age and education, underwent equal neuropsychological assessment and EEG recording, according to the same protocol.
Results:
qEEG spectral analysis revealed decrease of global relative beta band power and increase of global relative theta and delta power in aMCI patients. Whereas, decreased coherence in centroparietal right area considered to be an early qEEG biomarker of functional disconnection of the brain network in aMCI patients. In conclusion, the demonstrated changes in qEEG, especially, the coherence patterns are specific biomarkers of cognitive impairment in aMCI.
Conclusions:
Therefore, qEEG measurements appears to be a useful tool that complements neuropsychological diagnostics, assessing the risk of progression and provides a basis for possible interventions designed to improve cognitive functions or even inhibit the progression of the disease.
Keywords
INTRODUCTION
In recent years, patients at risk of developing Alzheimer’s disease (AD) have become the subject of researchers’ special attention. AD is a neurodegenerative disorder characterized by the progressive decline of mental functioning such as loss of memory, cognition, planning, reasoning, abstract thinking, behavioral and mood disorders. The cause of AD is the aggregation of a normal protein, amyloid-β (Aβ) in the neocortex, which consequently leads to synapse loss and neuronal atrophy, mainly in the hippocampus and cerebral cortex [1]. It has been observed that there is a transitional stage between normal aging and AD, termed mild cognitive impairment (MCI). It could be defined as cognitive decline greater than expected for an individual’s age and education level but does not affect daily activities. In 2011, the National Institute on Aging (NIA) and Alzheimer’s Association (AA) Workgroups published the revised diagnostic criteria for dementia, including dementia due to AD, as well as the diagnostic criteria for MCI due to AD [2]. All the diagnostic criteria proposed so far highlight the heterogeneity of this condition in terms of its clinical and etiological presentation. MCI prevalence is from 6.7% for ages 60–64 and increases with age to 25.2% for 80–84 [3]. However, the concept of MCI has evolved over the years. MCI is a very heterogeneous syndrome. Most studies today further differentiate MCI between amnestic (aMCI) and non-amnestic (non-aMCI) depending on whether there is an objectively evident impairment in the memory domain, which is predominant in aMCI [4, 5]. Many researchers also classify these two entities into single-domain and multi-domain MCI, depending on how many cognitive domains are impaired, regarding memory, language, attention, executive function and visuospatial skills [6, 7]. Patients with MCI are at higher risk of developing dementia than age-matched controls [3]. While aMCI appears to be highly associated with progression to AD, other subtypes of MCI show a higher risk to convert to other dementias such as fronto-temporal dementia (FTD), dementia with Lewy bodies (DLB), or vascular dementia (VaD) [8, 9]. Cumulative dementia incidence is estimated to be 14.9% in individuals with MCI older than age 65 years followed for 2 years; however some people with MCI seem to remain stable or return to normal over time [3]. MCI is therefore recognized as suitable for implementing possibly effective interventions [10]. Current diagnostic for the AD continuum includes cerebrospinal fluid (CSF) biomarkers and structural and functional magnetic resonance imaging (MRI and fMRI), fluoro-deoxy-glucose positron emission tomography (FDG-PET), amyloid imaging with positron emission tomography (amyloid-PET) and positron emission tomography with Pittsburgh Compound-B (PiB-PET). Despite the use of these diagnostic methods, it is not always possible to make a clear diagnosis early. Biomarkers such as Aβ, tau, and phospho-tau levels are only standardized for CSF measurements. Lumbar puncture to collect the CSF is an invasive method, costly and the availability of laboratories performing such determinations are limited. Therefore, these tests are performed only in a few highly specialized centers in the country. It is not possible to obtain similar results from blood, saliva or urine. Neuroimaging, despite the fact, that they are less invasive, are very cost-intensive. Therefore, the search for a non-invasive, widely available and easy to perform method of early diagnosis of AD, before clinical symptoms of dementia appear, seems so important.
Electroencephalography (EEG) is one of the non-invasive and widely available additional diagnostic methods commonly used in clinical settings for diagnosing cognitive impairment. In the era of developed mathematical analyses, apart from the qualitative EEG analysis, based on the visual assessment of the electrical activity of the brain, the quantitative EEG (qEEG) analysis is increasingly used. qEEG enables the acquisition of a variety of parameters, ranging from spectral frequency analysis to brain connectivity, signal complexity and analysis of entire neural brain network [11]. That information is processed, transformed, and analyzed using complex mathematical algorithms from the “raw” EEG data [12, 13].
The clinical use of qEEG has broadened its scope and gained in importance over the years. Nowadays it is used in the diagnosis of various disorders, of which neuropsychiatric disorders are most prevalent [14]. Regarding the fact that there is no appropriate biomarker of the onset of cognitive decline due to AD, qEEG patterns might play a significant role as biomarkers of MCI. Many previous studies have shown changes in qEEG analysis in patients with cognitive deterioration. Most of the spectral frequency analyses showed that patients with cognitive decline have an increase in the theta and delta frequency band in background activity and decrease in the alpha and beta frequency band [15–17]. Reduction in the alpha frequency band in patients with mild AD could be used as a diagnostic marker. Moreover, a recent study also reported an increase of delta and decrease of alpha 1 activity in subjective cognitive decline (SCD) due to AD and concluded that qEEG could be a potential tool for predicting amyloid pathology in those patients [18]. What is more, it has been suggested that using the automated statistical pattern recognition (SPR) method in qEEG can be helpful in identifying patients with SCD and MCI that have a high risk of converting to dementia over a 5-year period [19]. This hypothesis was also supported by recent findings, where qEEG slowing, measured by increased theta/alpha ratio was associated with clinical progression from MCI to dementia [20].
Aims of the study: Examination and comparison of EEG spectral and connectivity analysis of patients with aMCI and the control group without cognitive disorders. Identification of the characteristic patterns of spectral and connectivity analysis of the EEG resting state in aMCI patients that could become biomarkers of the earliest changes in cognitive decline due to AD. Analysis of the changes found in the spectral and connectivity analysis in the context of a better understanding and indication of the relationships between the observed changes and the first clinical manifestations of aMCI due to AD.
MATERIALS AND METHODS
Subjects
For the present study, 30 subjects with amnestic MCI (aMCI) aged from 40 to 85 and 23 subjects in the control group without cognitive impairment (CogN) aged from 44 to 83, were recruited from the memory clinic of the Neurology Department. The research was carried out retrospectively based on the analysis of medical data and EEG recordings performed during the routine diagnosis of cognitive disorders. The study was conducted according to the guidelines of the Declaration of Helsinki. Inclusion criteria were: subjects meeting the clinical and neuropsychological criteria for aMCI who obtained in the Mini-Mental State Examination (MMSE) 24–27/30 or 28–30 plus low performance on the Clock Drawing Test (CDT) (2–8 points) or other tests such as Benton Visual Retention Test or complex neuropsychological assessment with educational level≥6 years. The exclusion criteria were: the diagnosis of non-amnestic MCI and dementia (due to either AD, VaD, FTD, or DLB), cognitive decline in the course of any secondary causes such as major stroke history, encephalitis, post-traumatic changes in the course of brain injury, CNS radiotherapy, other neurodegenerative diseases (e.g., Parkinson’s disease), metabolic disorders or other psychiatric diseases such as (e.g., deep depressive disorders, schizophrenic disorders, alcohol dependence) and severe, uncontrolled or complicated systemic diseases and acute life-threatening conditions which may possibly impair cognition (e.g., active cancer). In total, the data from 130 potentially eligible patients with MCI were analyzed, but only 30 subjects were selected and eventually included in the analysis. Figure 1 shows a flow chart of the participants’ recruitment.
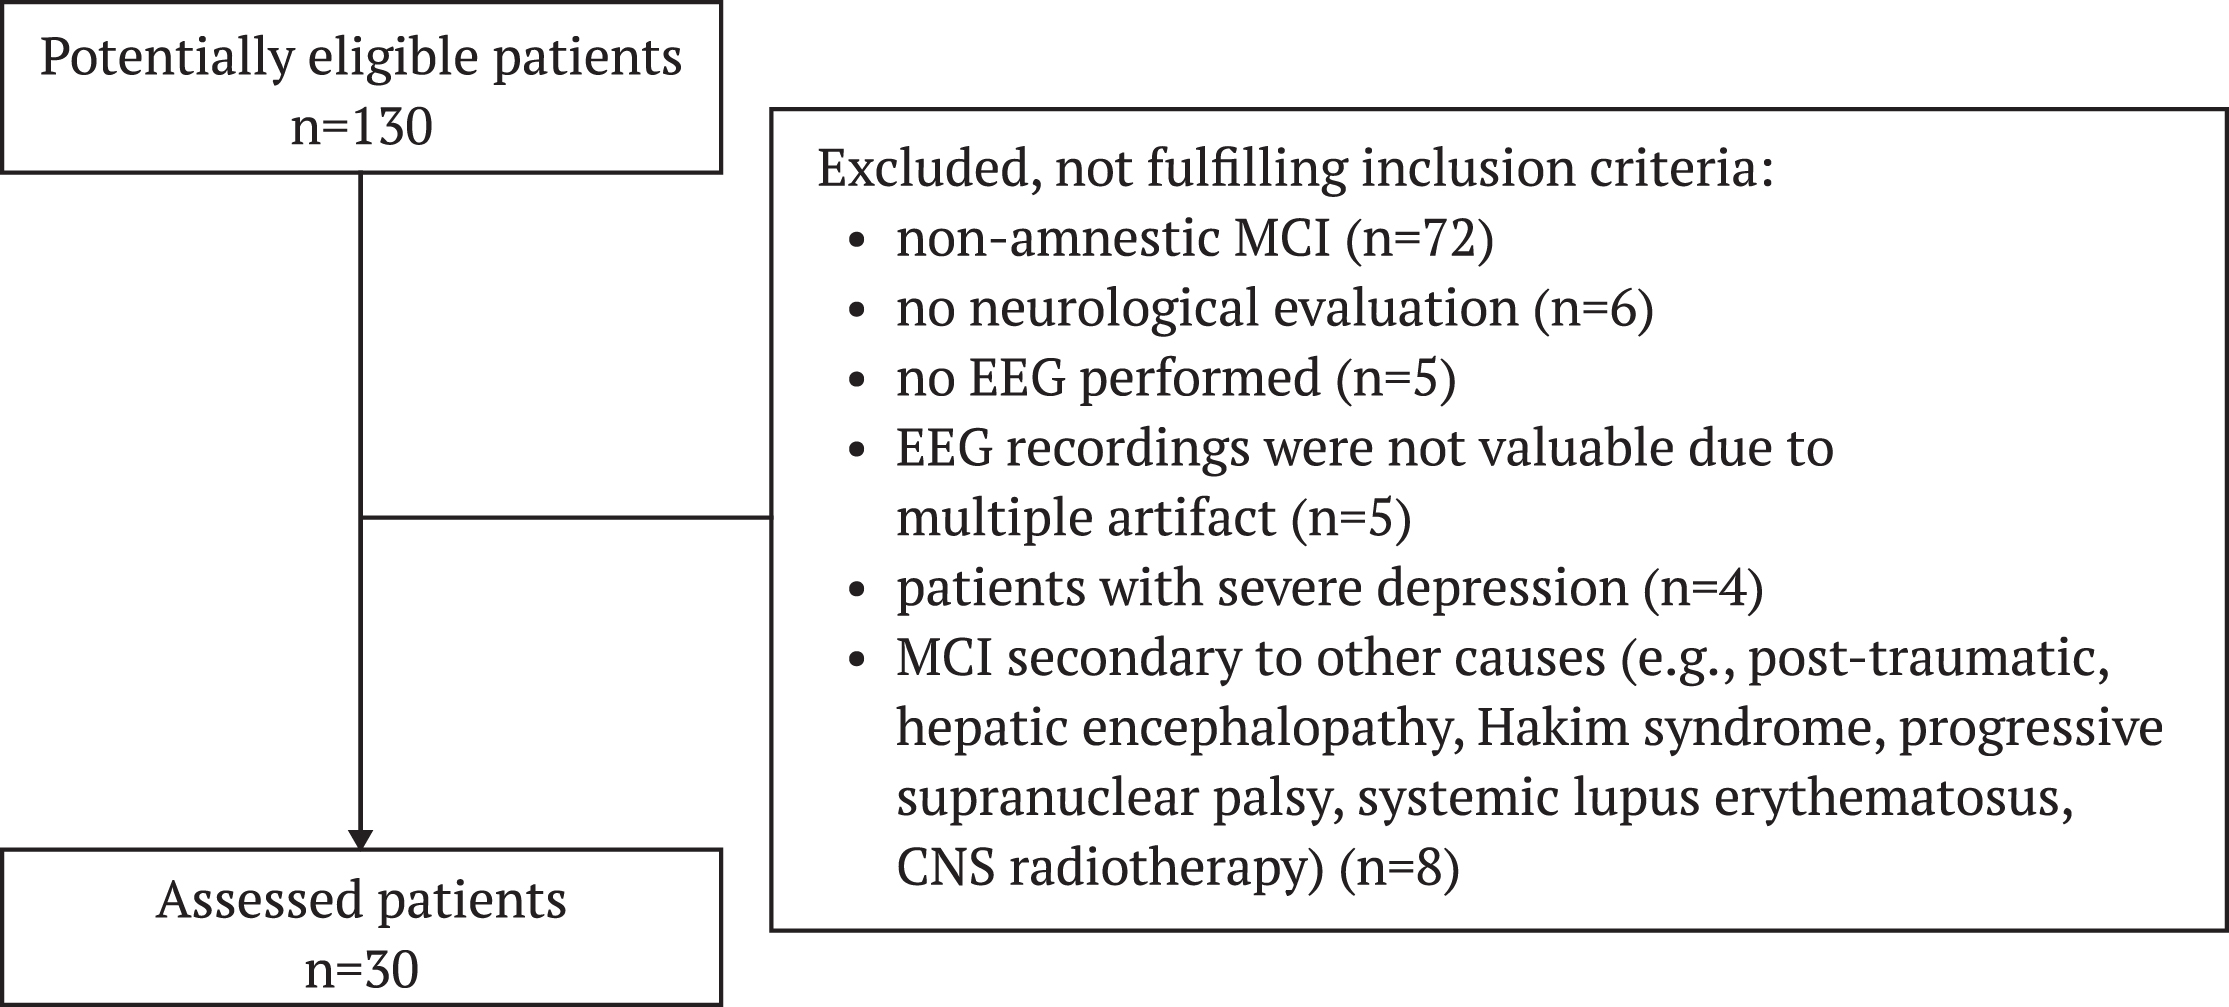
Flow chart of aMCI patients selection.
The control group of 23 subjects was recruited retrospectively from the Neurology Department and matched in terms of age (44–83 years old) and educational level (≥6 years). The inclusion criteria for the control group were no cognitive dysfunction: MMSE 27–30 points, CDT 9-10 points.
Clinical and neuropsychological assessment
An interview with the patient and usually another informant, the patient’s spouse or child, was carried out in all individuals and healthy controls. Then, all subjects underwent physical and neurological examinations as well as magnetic resonance imaging (MRI) or computer tomography (CT) of the brain, to exclude secondary causes of the memory impairment. In addition, patients underwent basic laboratory tests including morphology tests, laboratory parameters of inflammation, glycaemia, electrolytes, assessment of kidney, liver, and thyroid function to rule out other causes of cognitive impairment. Patients and healthy controls were rated with a series of standardized neuropsychological diagnostic. General levels of cognition were assessed by the MMSE, the CDT, the Benton Visual Retention Test, the Beck Depression Scale (BDI) and complex neuropsychological assessment.
EEG recording
All the EEG recordings were performed using the Galileo EEG-EB NEURO MEDTRONIC apparatus, from 19 electrodes positioned according to 10–20 international system (Fp1, Fp2, F3, F4, F7, F8, Fz, C3, C4, Cz, T3, T4, T5, T6, P3, P4, Pz, O1, O2). EEG activity was analyzed from single or multiple leads, grouped to define the following scalp regions: frontal (Fp1, Fp2, F3, F4, Fz), central (C3, C4, Cz), temporal (F7, F8, T3, T4, T5, T6), parietal (P3, P4, Pz), and occipital (O1, O2). The data were recorded with the sampling frequency 128 Hz with a band-pass filter with cutoff frequencies 0.5 and 70 Hz. The EEG recordings were done in a resting awake condition with the eyes closed. The duration of the entire routine EEG examination was about 20 min. A technician present in the recording room controlled for vigilance of the patients.
Quantitative EEG
Signals from each channel were initially filtered with 50 Hz notch filter to reduce the impact of power line noise. The resulting signal was then divided into 5 s nonoverlapping epochs with baseline correction and detrending. The epochs with artifacts were automatically removed using the Auto reject method [21]. The resulting epochs were manually verified by an expert for the further presence of artifacts.
The qEEG parameters were extracted based on the power spectral density (PSD) computed with the multitaper method from 0.5 to 45 Hz. All PSDs from all epochs for one patient were averaged. The relative power in each scalp region was calculated from averaged PSDs from channels inside the region. The PLI and the coherence between each pair of regions were calculated by averaging the values of all pairs of electrodes between the regions. The coherence values between areas in two separate right and left hemispheres were analyzed, which was called inter-hemispheric coherence, and within one and the same hemisphere, which was described as intra-hemispheric. All QEEG parameters were calculated in different frequency bands: delta (0.5–4 Hz), theta (4–8 Hz), alpha (8–13 Hz), beta (13–30 Hz), and gamma (30–45 Hz) [22].
Statistics
The aMCI versus CogN groups were compared in terms of the following variables: age, years of education, MMSE, CDT, BDI, and qEEG features collected in the research process. The normality of the distribution of the compared variables was verified with the Shapiro-Wilk test. The equality of variances was checked with the F-test. If the distribution normality and homogeneity of variance assumptions were met, the Student’s t-test or the Welch test was performed. In addition, the Mann-Whitney U test was performed in each case to maintain the assessment’s consistency. The effect size was verified using Cohen’s d and Glass’s r, respectively. The Cohen’s d magnitude was assessed as follows: |d| < 0.2 “negligible”, |d| < 0.5 “small”, |d| < 0.8 “medium”, |d|≥0.8 “large” [23]. For the Glass rank biserial coefficient rg the interpretation was |rg| < 0.11 “negligible”, |rg| < 0.28 “small”, |rg| < 0.43 “medium”, |rg|≥0.43 “large” [24]. Small effects are not reported as significant as they have no clinical significance. The significance level was set at 0.05.
All calculations were performed in R 4.3.1 using RStudio and libraries caTools, effsize, rcompanion, rstatix, stats, tidyverse, and xlsx.
RESULTS
Clinical characteristics
Both groups, aMCI and CogN, had similar educational levels (p = 0.944). The age of the patients also did not differ between groups (p = 0.067). The patients with aMCI achieved lower scores in neuropsychological examination—MMSE and CDT (both p < 0.001, rg = –0.62 and rg = –0.68 respectively). However, the healthy controls, who came for the tests because of subjective cognitive disorders and who were not diagnosed with aMCI, showed slightly, insignificantly greater depressive disorders (p = 0.921). Descriptive statistics of the study sample are shown in the Table 1 (for more details, see Supplementary Table 1).
Clinical characteristics of CogN and aMCI patients – median (quartile deviation)
Spectral power analysis: Frequency
The study revealed statistically significant differences of the global relative delta, theta, and beta power among the two groups, aMCI and CogN (see Supplementary Table 2).
The global relative delta and theta power of the aMCI group were significantly higher than that of the CogN group (p = 0.046, d = –0.56; p = 0.035, d = –0.61). As for the global relative beta power, it was significantly lower in the aMCI group, than in CogN group (p = 0.007, rg = 0.43).
The global alpha/theta ratio did not show any statistically significant differences; however, the global power spectral ratio, measured as (α+β)/(δ+θ), noted a statistically significant decrease in the aMCI group, comparing to CogN (p = 0.005, rg = 0.45).
Considering the values in each of the regions, there was a significant increase of relative delta power in the central region bilaterally (central left p = 0,012, d = –0.71; central right p = 0,011, d = –0.72), in the parietal region bilaterally (parietal left p = 0.0251, d = –0.63; parietal right p = 0.027, d = –0.62) and in the occipital region bilaterally (occipital left p = 0.034, rg = –0.34; occipital right p = 0.023, rg = –0.36) in the aMCI group, in comparison to CogN (Fig. 2). The relative theta power was higher in the aMCI group only in the frontal region bilaterally (frontal left p = 0.025, d = –0.65; frontal right p = 0.015, d = –0.71) in comparison to CogN (Fig. 3). However, the relative beta power was significantly decreased in all of the brain regions bilaterally: frontal (frontal left p = 0.005, rg = 0.45; frontal right p = 0.004, rg = 0.46), central (central left p = 0.005, rg = 0.45; central right p = 0.002, rg = 0.49), temporal (temporal left p = 0.010, rg = 0.41; temporal right p = 0.026, rg = 0.36), parietal (parietal left p = 0.013, rg = 0.40; parietal right p = 0.009, rg = 0.42) and occipital (occipital left p = 0.039, rg = 0.33; occipital right p = 0.013, rg = 0.40), but the most statistically significant regions were the central right and frontal right (Fig. 4).
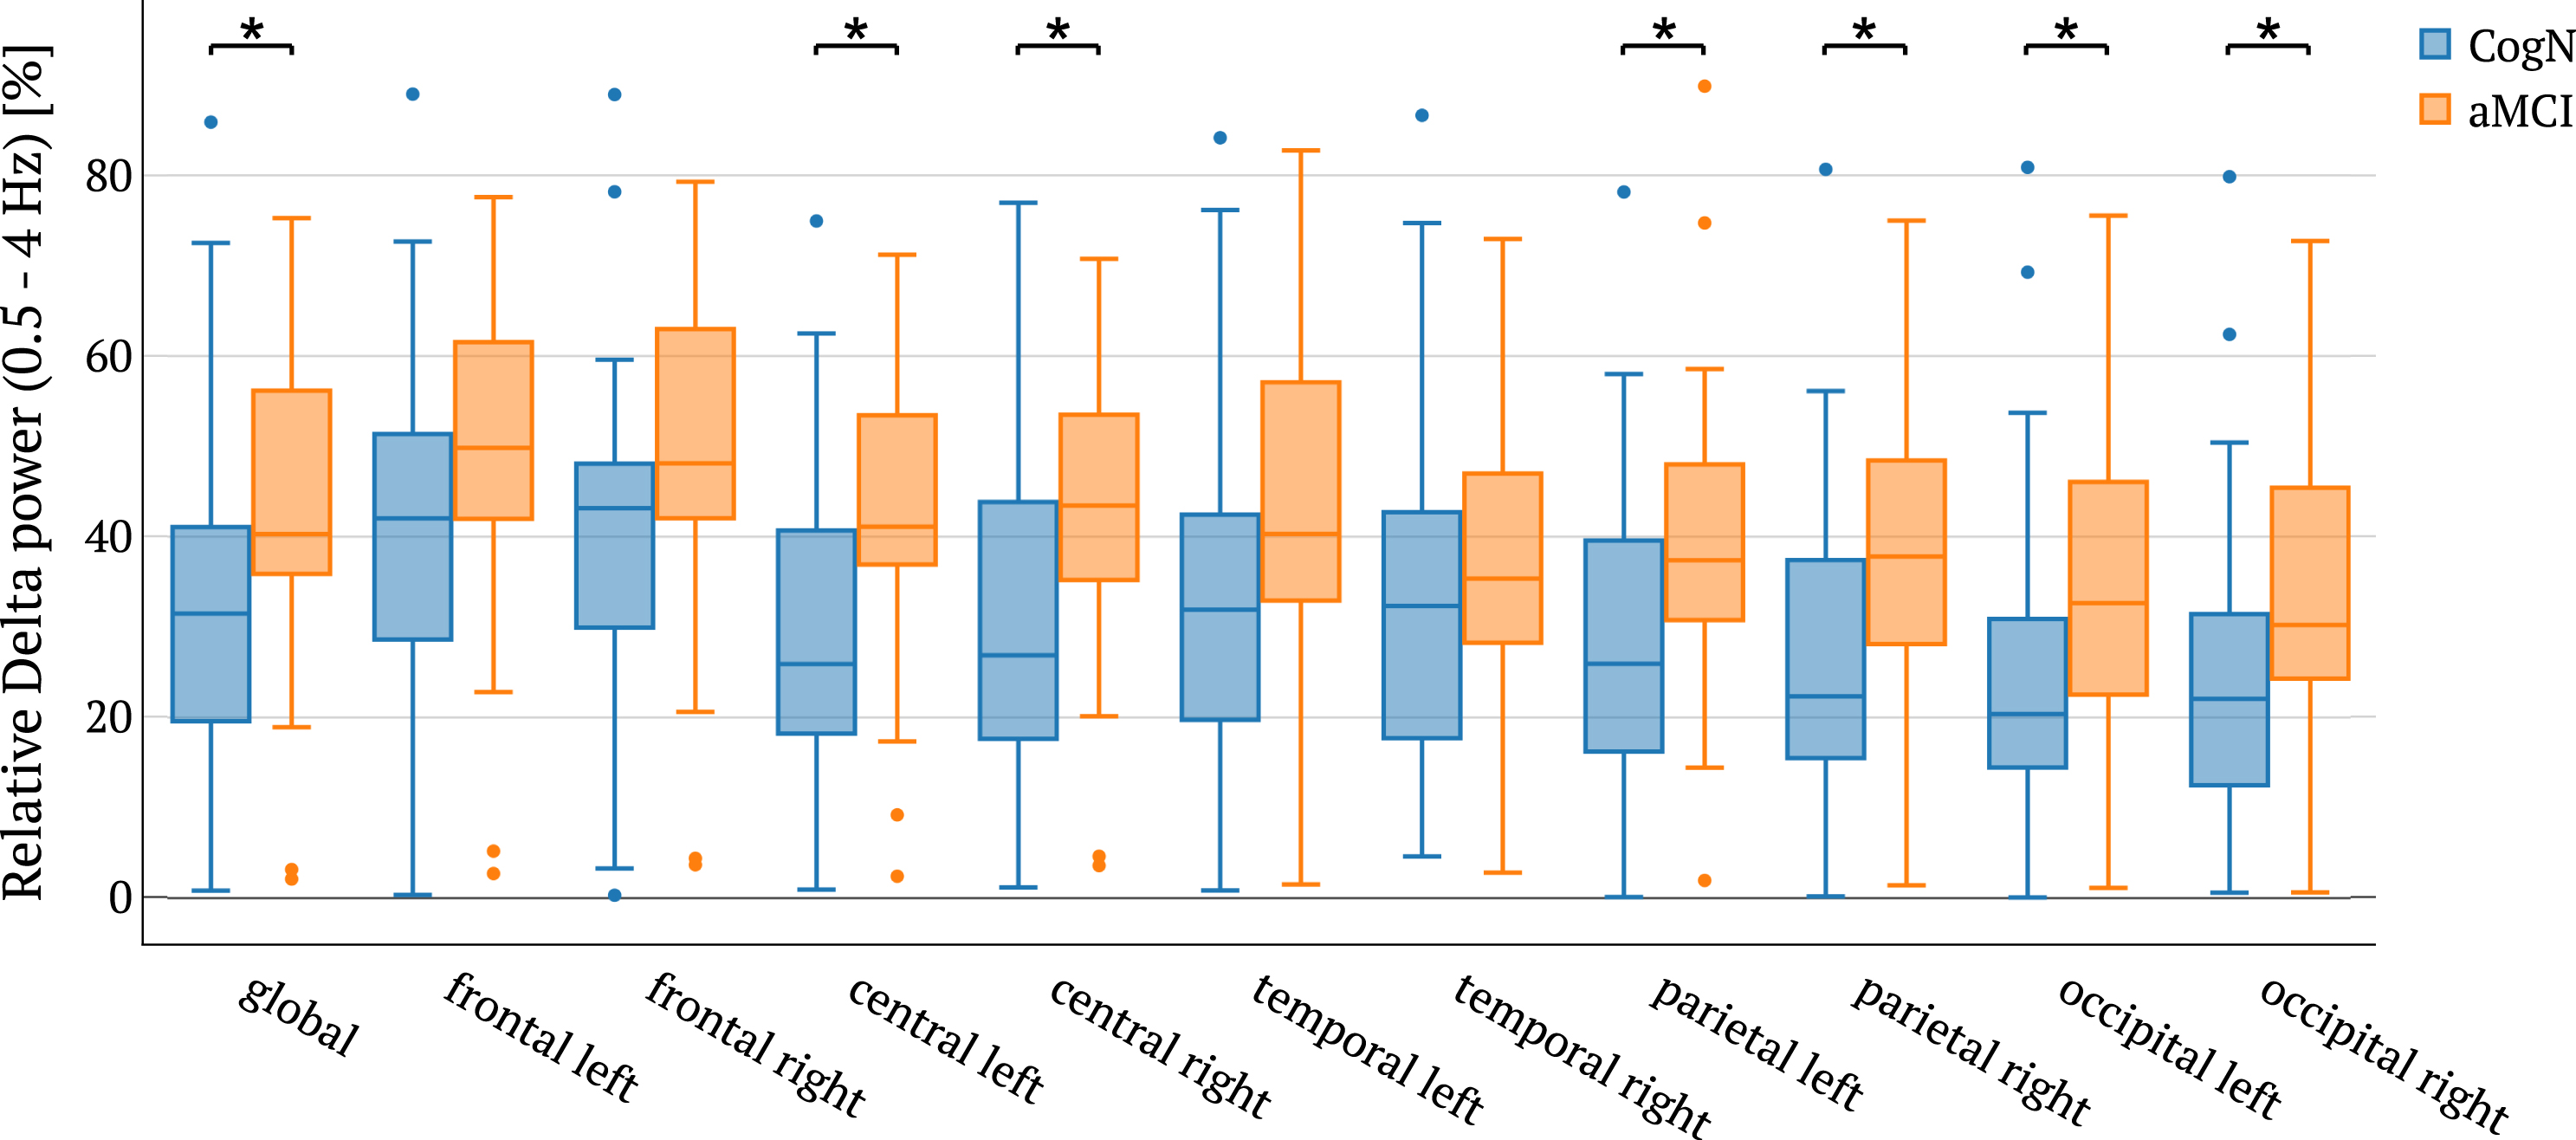
Relative delta power in the different brain regions between CogN and aMCI groups with statistical significance highlighted (*p < 0.05).
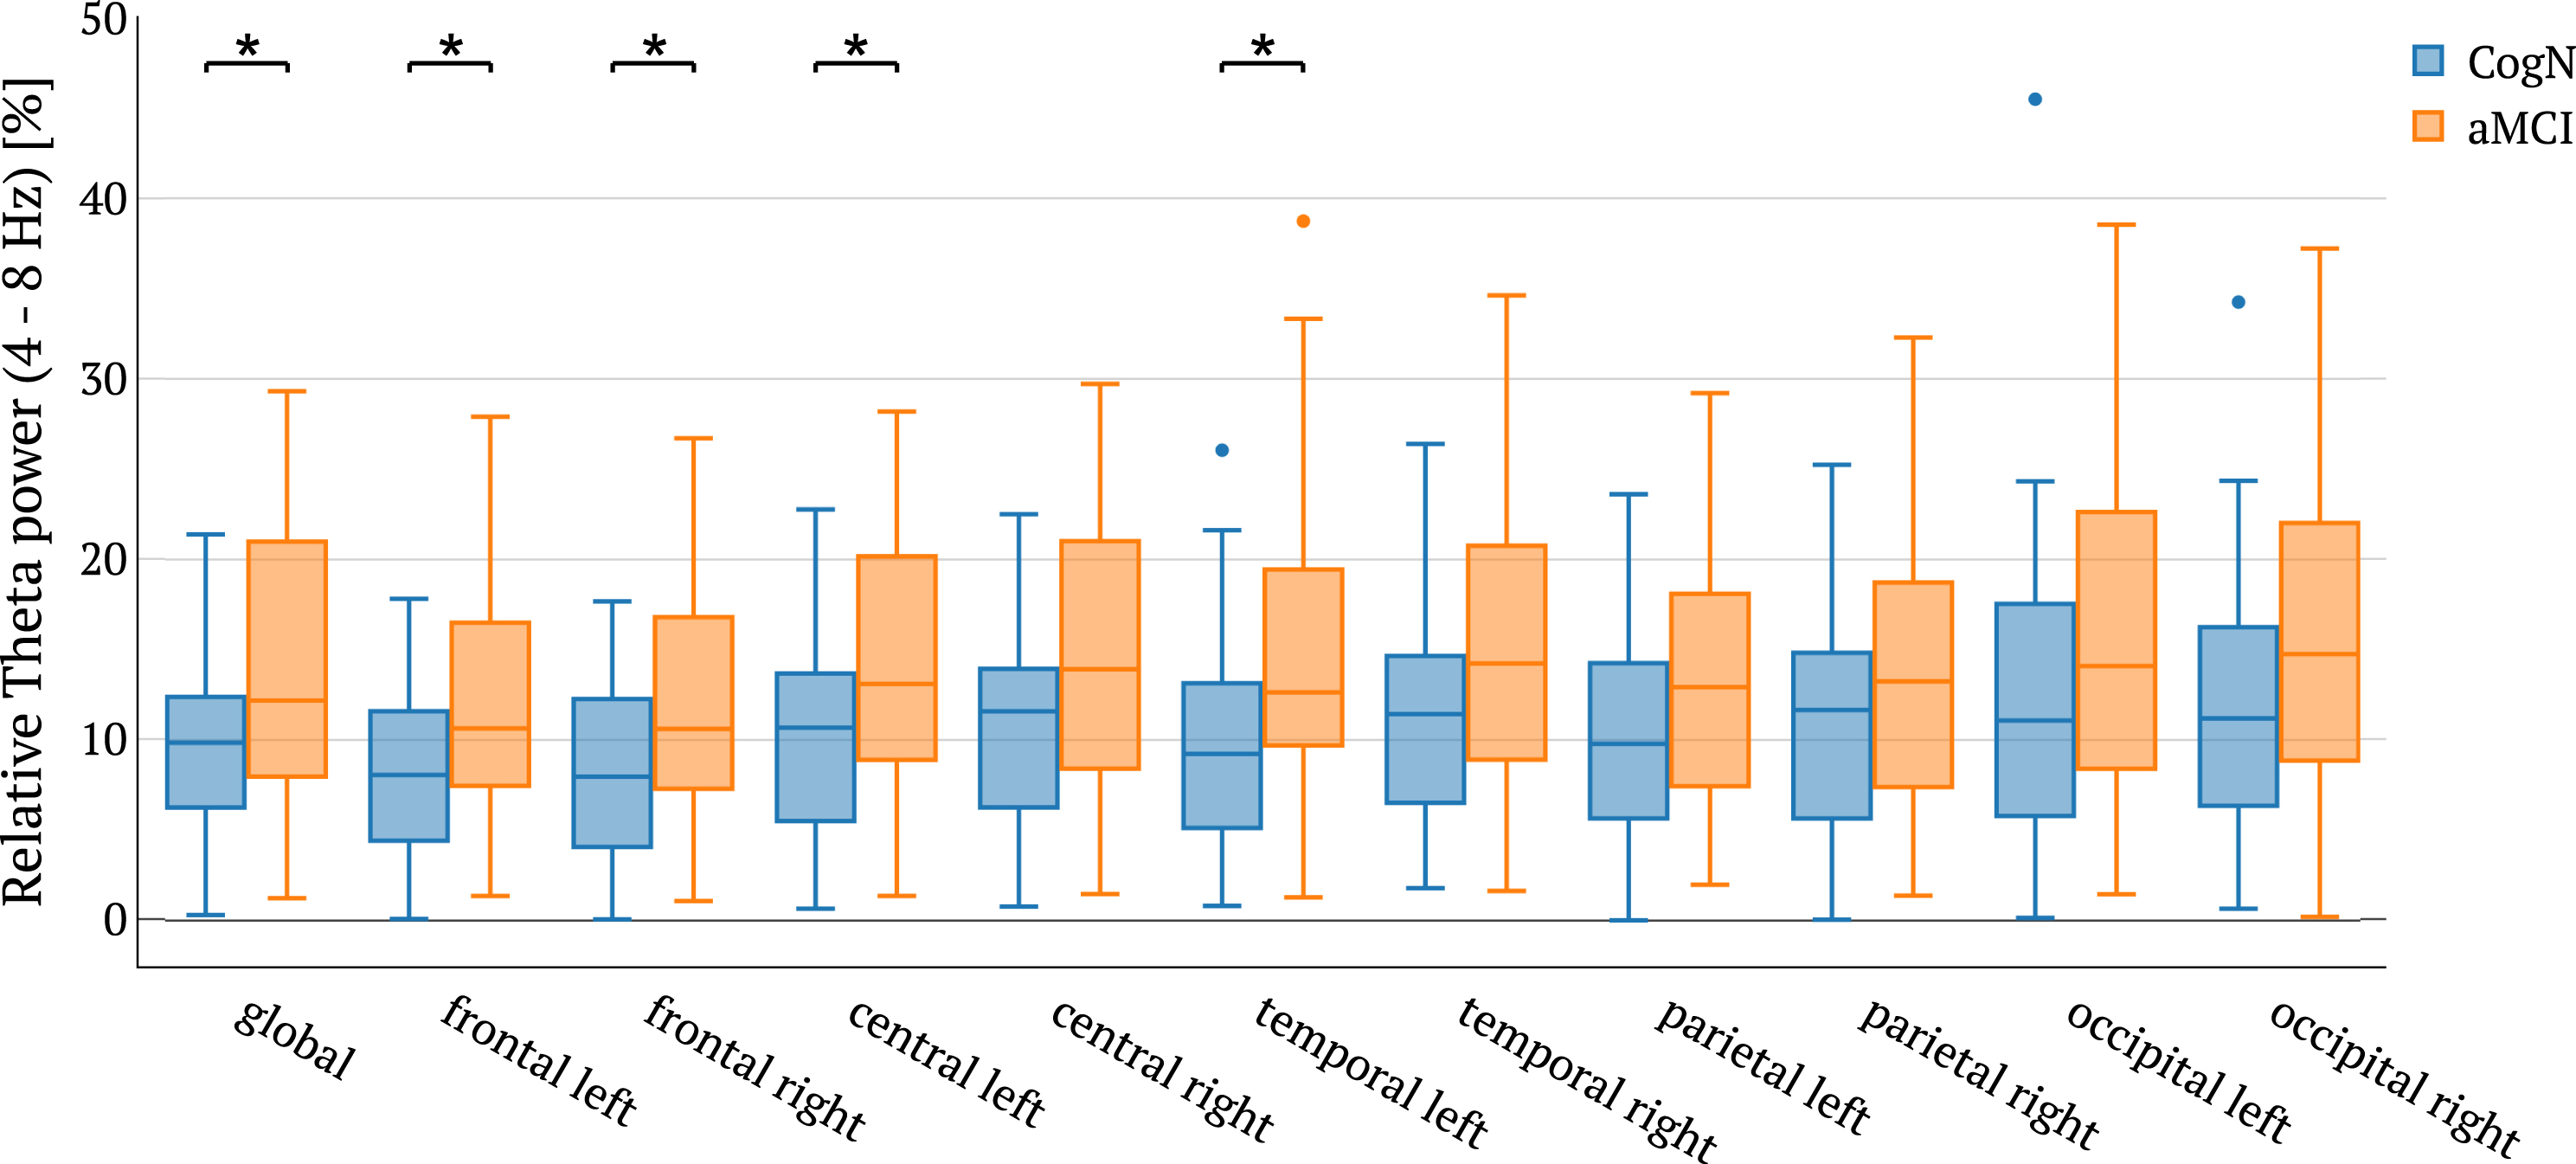
Relative theta power in the different brain regions between CogN and aMCI groups with statistical significance highlighted (*p < 0.05).

Relative beta power in the different brain regions between CogN and aMCI groups with statistical significance highlighted (*p < 0.05, **p < 0.01).
Connectivity analysis: Coherence and phase lag index
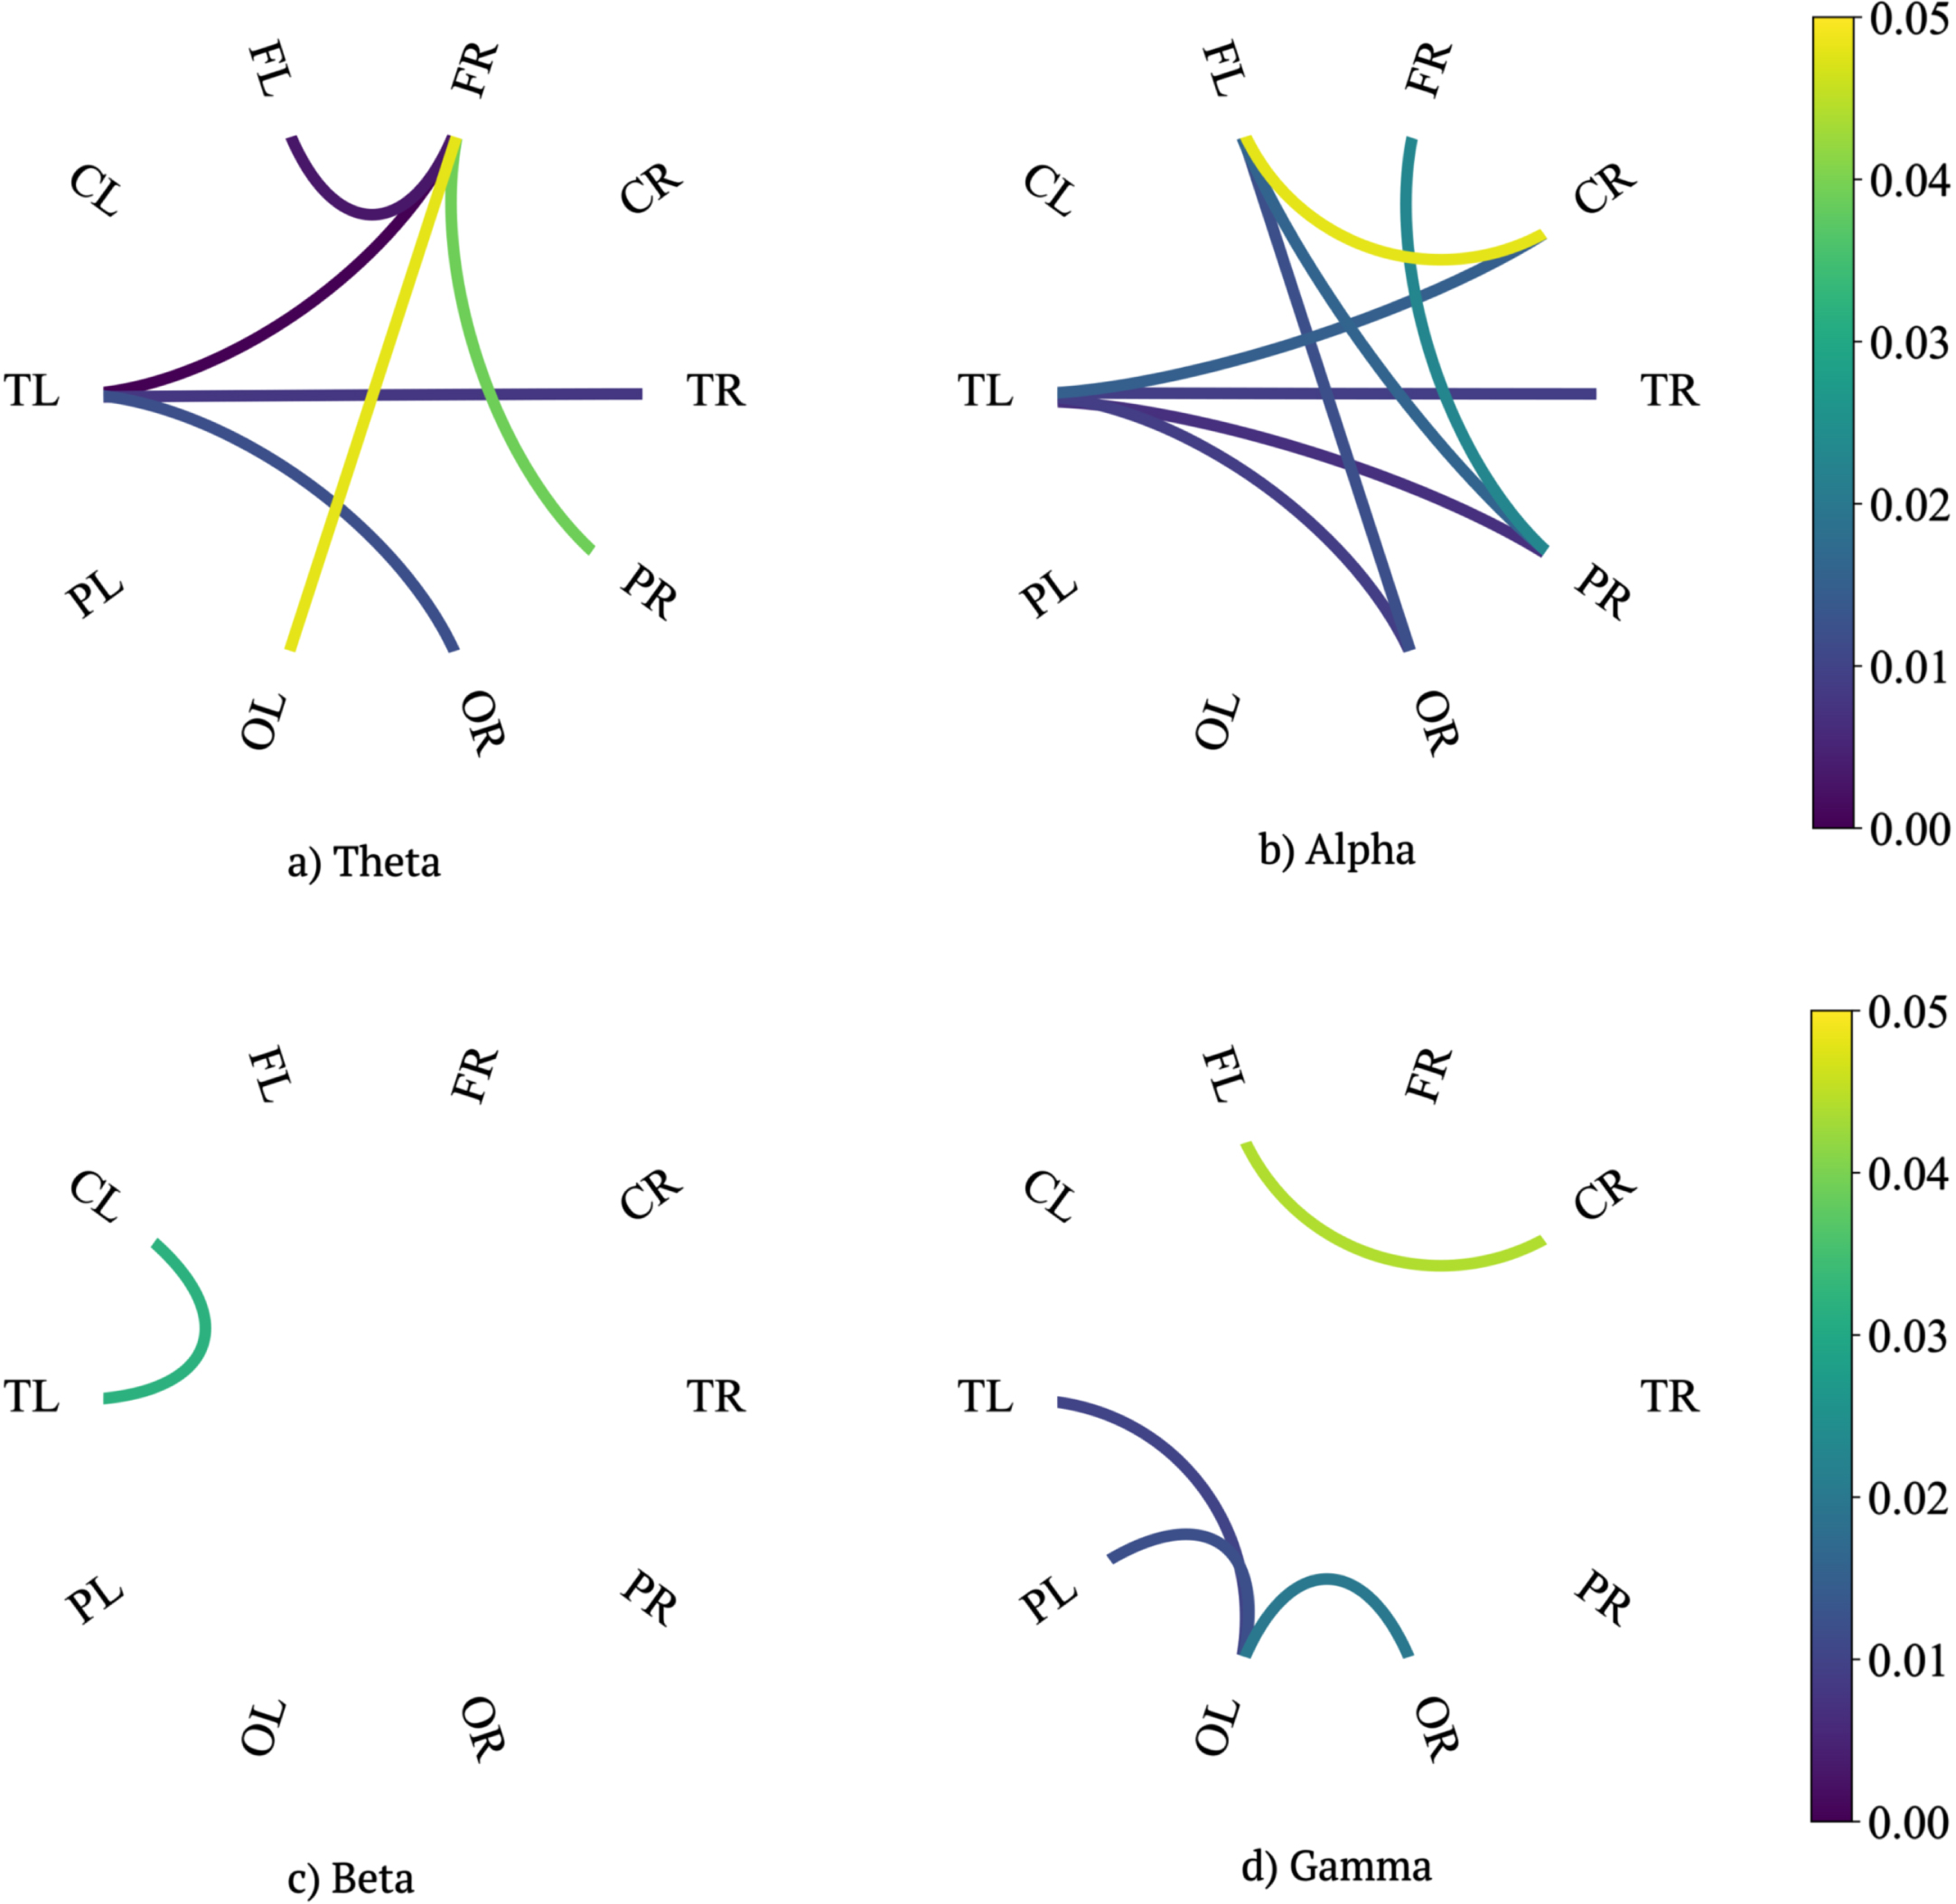
Statistically significant differences of coherence and phase lag index in particular regions in the theta, alpha, beta, and gamma power among the two groups, MCI and CogN, have been explored (see Supplementary Tables 3 and 4). The exact results are shown in Figs. 5 and 6. The most important observations are presented below by intra-hemispheric and inter-hemispheric connections.
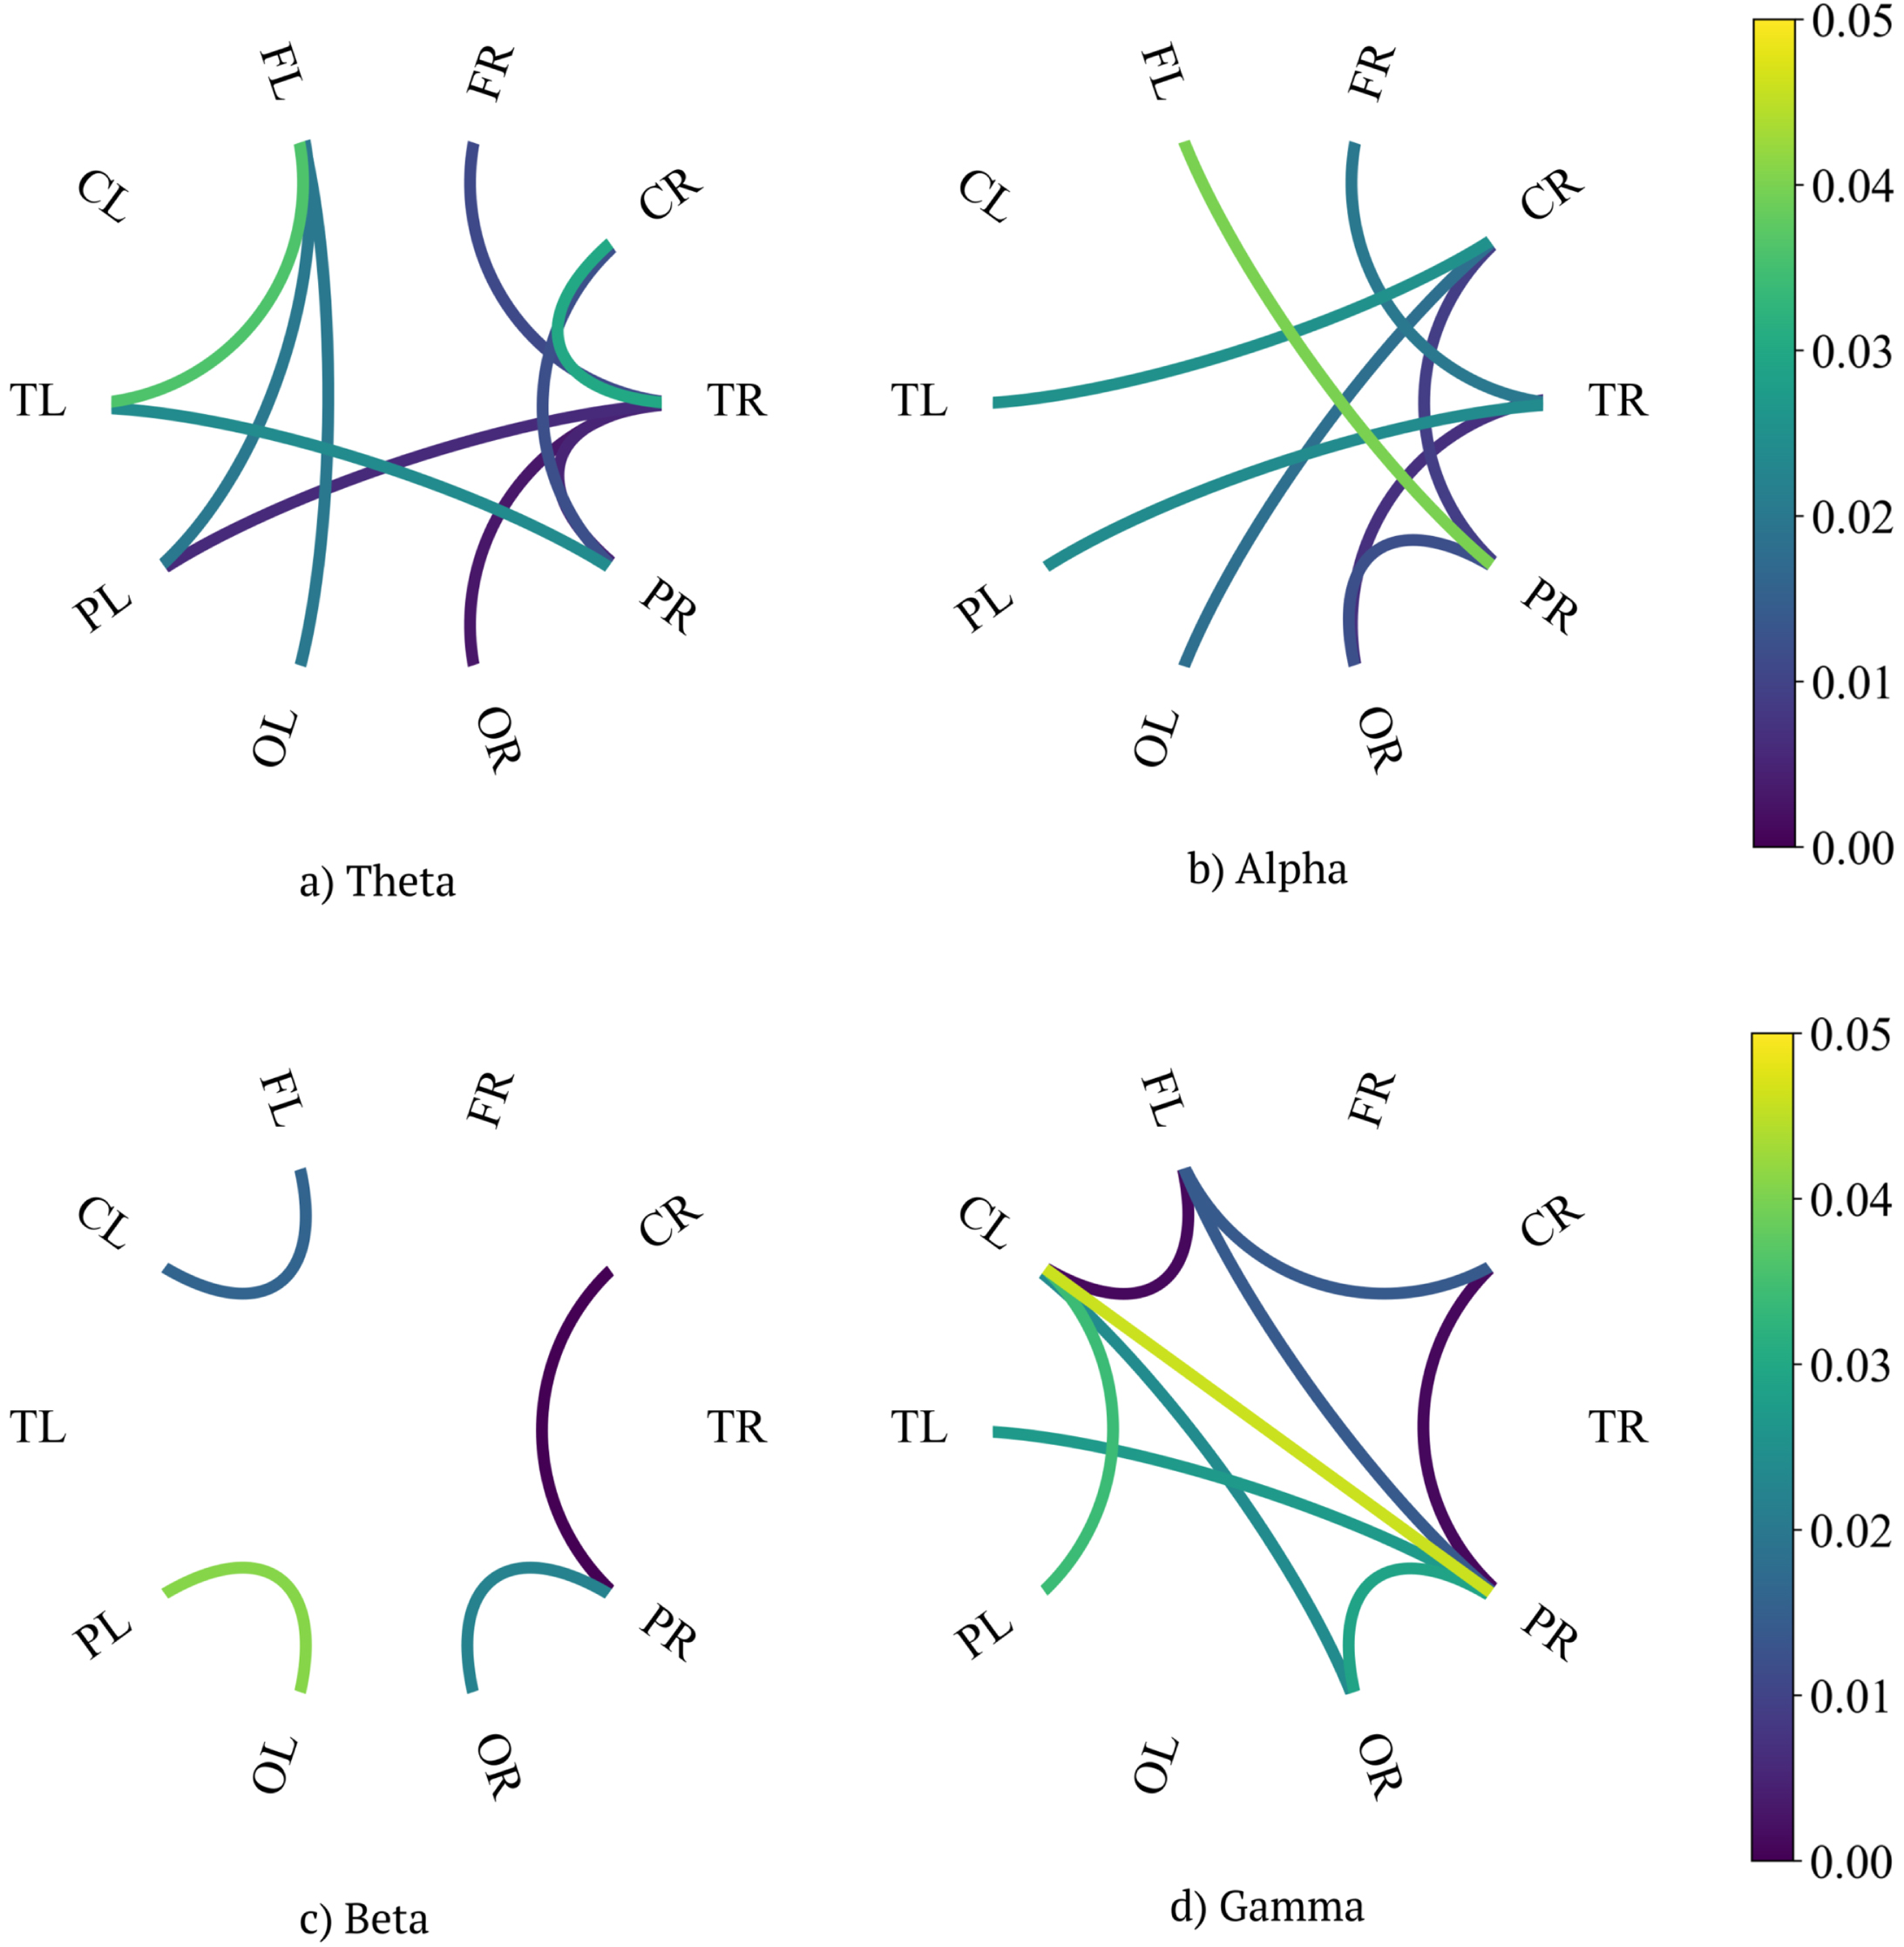
p-values of tests comparing aMCI and CogN groups concerning coherence between regions in different bands.
p-values of tests comparing aMCI and CogN groups concerning PLI between regions in different bands.
Inter-hemispheric coherence
The most statistically important differences between aMCI group and CogN were shown in parietal left – temporal right region (p = 0.006, rg = 0.44) and parietal right - temporal left (p = 0.025, rg = 0.36) in the theta frequency band. There was a decrease of coherence in both of these regions in the aMCI group, in comparison to CogN. In the alpha frequency band, we explored statistically important decrease of coherence in the aMCI group in temporal left-central right (p = 0.026, rg = 0.36) and parietal left-temporal right regions (p = 0.025, rg = 0.36). In the occipital left-central right region there was a statistical increase (p = 0.018, rg = –0.38) in the aMCI group. In the gamma frequency band, there was a statistically lower coherence in the aMCI group, compared to healthy controls, which was shown in frontal left-central right region (p = 0.015, rg = 0.39) and frontal left-parietal right (p = 0.014, rg = 0.39).
Intra-hemispheric coherence
In the theta frequency band, there was a statistically important increase in the temporo-occipital right region (p = 0.004, d = –0.84), fronto-temporal right region (p = 0.011, rg = –0.41), and temporo-parietal right (p = 0.005, d = –0.8) in patients with aMCI. However, in the centro-parietal right region there was a decrease of coherence (p = 0.012, d = 0.73) in this group. In the alpha frequency band we noted statistically important coherence increase in the temporo-occipital right (p = 0.008, rg = –0.43) and fronto-temporal right (p = 0.020, rg = –0.37) regions in aMCI group, in comparison to CogN. However, the coherence disruption was shown in the centro-parietal right region (p = 0.009, d = 0.76) and parieto-occipital right region (p = 0.012, rg = 0.40). In the gamma frequency band, there was a statistically important coherence decrease in centro-parietal right region (p = 0.001, d = 0.94) in the aMCI group, in comparison to CogN. In the gamma range, we also observed a coherence disruption in the left hemisphere of the brain in the fronto-central left region (p = 0.002, rg = 0.49), in aMCI group compared to healthy controls.
Phase lag index (PLI)
In the PLI measurement, we recorded an increase in all frequencies. Regions, in which we revealed the most significant differences in the theta frequency band, in aMCI group, in comparison to healthy controls, were the following ones: temporal left-frontal right (p = 0.001, rg = –0.53), frontal left-frontal right (p = 0.004, rg = –0.46), temporal left-temporal right (p = 0.009, rg = –0.42) and temporal left-occipital right (p = 0.013,rg = –0.40). In the alpha frequency band, a significant increase was shown in temporal left-central right (p = 0.016, rg = –0.39), temporal right-temporal left (p = 0.001, d = –0.75), temporal left-parietal right (p = 0.008, d = –0.79), and temporal left-occipital right (p = 0.010, rg = –0.41) in aMCI group, in comparison to CogN. In the gamma frequency band, we explored significant differences only in two regions: in occipital left-temporal left (p = 0.011, rg = –0.41) and occipital left-parietal left (p = 0.012, rg = –0.4), in the aMCI group, in comparison to CogN.
DISCUSSION
In recent decades, the quantitative EEG analysis has become increasingly important in assessing clinical markers of early AD. Our study revealed mainly a significant decrease of global relative beta power (large effect) and to a lesser extent an increase of relative global delta and theta power (medium effects) in patients with amnestic MCI due to AD in comparison to cognitively normal subjects as previously by Coben et. al., who reported that the earliest changes in the resting EEG in AD are the increased theta and decreased beta power [16]. These results have been confirmed in several subsequent studies [15, 25–33]. The key structure in the generation of the theta rhythm is the amygdalohippocampal network. The atrophy of amygdalohippocampal complex determines increasing memory deficits [34]. Increased delta band power may result from a progressive cortical disconnection due to the slowing of the conduction along cortico-subcortical connecting pathways [34]. The underlying cause which leads to the slowing of EEG rhythms are the cholinergic deficit in AD, which causes the cortical network disruption [15]. Many steps have been taken to use EEG parameters, combining several features, for example, spectral power and coherence, to implement due to AD deterioration recognition systems [35]. Another detection system distinguishing between normal and MCI subjects, based on EEG recordings, was prepared by Alvi et al. [36]. Perez-Valero et al. also declare that AD could be automatically detected through automated processing and commercial EEG systems [37]. This finding stays in line with our study where the global power ratio decreased. The spectral power ratio recognized as (α+β)/(δ+θ) correlated with dementia severity and executive functioning in AD [38]. Poza et al. suggested that the spectral ratios showed even greater correlation with the severity of dementia than individual relative power measures [39]. These findings are consistent with our results where global power ratio decreased significantly with large effect. Chen et al. also proved that global theta and delta to alpha and beta band power ratio showed the best correlation with stages of AD [40].
Previous studies, evaluating regional changes in the spectral power analysis of qEEG patients with MCI and AD, indicated abnormalities in the temporal and frontal scalp regions [41] or temporal and parietal scalp regions [42]. Gianotti et al. confirm this fact in a study with a low resolution brain electromagnetic tomography (LORETA), which showed changes in temporo-parietal regions in AD [43]. More recent research of Ya et al. has shown that the delta wave power of the MCI group was significantly higher than that of the cognitively normal group in the parietal right and temporal left regions. Moreover, the delta power of the AD group was significantly higher than of the control group in the frontal right, parietal right, and temporal left region and also higher than that of the MCI in frontal right and parietal right [17]. These findings support the theory that pathological changes of the brain in MCI patients ranged between that of the normal aging and AD patients [17]. These results reflect those reported by Roh et al., who observed that temporal and parieto-occipital theta band powers were highest in AD [30]. It was also noted that the delta power in the parieto-occipital scalp region in the AD group was higher than that in the control group. These findings stay in line with our results, where delta frequency band increased with medium effects in the central, parietal, and occipital regions bilaterally. Furthermore, our results showed an increased theta power mainly in the frontal region (medium effect). These results are consistent with the main pathological damage in MCI and AD, which is the atrophy of temporal and frontallobes.
In the current study, comparing aMCI and healthy controls, we found a decrease in beta power band in all brain regions. These results suggest that it could be one of the first subtle biomarker of cognitive changes in aMCI patients. In accordance with the present results, previous studies have demonstrated that beta 2 band power decreased in the aMCI and AD subjects in the frontal and temporal scalp regions [30].
Coherence as a measure of functional connectivity evidence the neural disconnection due to aMCI and AD and can be used as a marker in clinical practice. This has been explored by numerous recent analyses dedicated to functional connectivity disruption related to aMCI and AD [44–48]. A proven feature in AD is a decrease of coherence in the alpha and beta bands between both close and distant channels suggesting functional disconnections among cortical regions [48, 49]. The decreased coherence in AD confirms the theory that AD is a neocortical disconnection syndrome [50].
Our current research revealed coherence disruption in the interhemispheric analysis only in the parietal left - temporal right area, in the theta power (large effect). Handayani et al. reported a decrease in coherence in the theta frequency band in the homologous interhemispheric areas: fronto-central left, fronto-central right region and temporal left-temporal right area [51]. Apart from middle temporal lobe which is affected by pathology usually earlier than other areas [52], frontal and central areas in aMCI and AD patients are those regions of the brain that show consistent evidence of disconnection associated with such neurodegenerative disorders [53]. Beta-amyloid deposits and the death of numerous neurons are directly related to AD. This hypothesis was also supported by Chen et. al study, who suggested that decreased centroparietal inter-hemispheric alpha band coherence is strongly correlated with disease progression in AD [40]. However, in our research, the analysis of interhemispheric connections revealed many more variables. Most of them were located in the right hemisphere of the brain. Based on our research, the centro-parietal right region considered to be an early marker of interhemispheric coherence disruption in aMCI. It was the area, where we noted decreased coherence in theta, alpha and gamma power. It was also confirmed by the findings of Sankari and Handayani et al., who also noted a decrease in the right intrahemispheric temporo-parietal coherence in the MCI group compared to the control group for almost all bands, with the exception of the beta band [51, 54]. Hadiyoso et. al. found that the intrahemispheric coherence significantly decreased in frontal-temporoparietal-central-occipital network connectivity [47]. Such changes prove the disconnection of cortico-cortical connectivity which connect the temporoparietal and occipital areas with the frontal and central regions, similar to our results. Wang et. al. reported that the smallest coherence emerged in temporal areas in inter-hemispheric areas and fronto-temporal areas in intra-hemispheric areas [45]. Locatelli et al. showed a significant decrease of alpha band coherence, in particular in temporo-parieto-occipital areas in patient with clinically probable AD [50]. The alpha coherence decrease could be related to alterations in cortico-cortical connections [50]. Fisher et al. in his review reported that alpha coherence was significantly decreased in patients with AD [55]. These finding show the disruption of corticocortical connection in MCI patients. Koenig et al. also confirmed the hypothesized disconnection of neurocognitive networks in MCI and AD patients [44]. The decrease of gamma power coherence which goes together with decreased in theta power coherence in the centro-parietal right region in the aMCI group in comparison to healthy controls, confirms the theory of impaired posterior cingulate cortex (PCC)- parahippocampus activity, which is associated with episodic memory retrieval problems in aMCI [56]. Prior studies of Vanneste et al. demonstrate decrease of gamma power in the posterior cingulate cortex and the left and right parahippocampus in aMCI patients in comparison to control participants and decreased theta power coherence between PCC and parahippocampus as well [57]. These findings support the concept that gamma oscillations have been suggested to cause the parahippocampal reinstatement of the memory representations in the PCC [58]. These results show that it is the impaired theta-gamma coupling, that illustrate the interconnectedness between parahippocampus and PCC, as a potential mechanism for memory decline in aMCI [57].
Interestingly, our research also revealed an area of increased coherence in the temporo-occipital right region in the theta and alpha power (both large effects), in aMCI group, which stays in line with the results of Fide et al., who reported increase of midline fronto-temporal theta coherence in the MCI group as compared to healthy controls [59]. This phenomenon could be regarded as an area where early corrective and compensatory changes occur for cognitive impairments in MCI [48]. Traditionally, hyperactivity was thought to reflect a mechanism that compensates for memory deficits [60]. Dickerson et al. suggested that it may reflect the need to recruit additional neural resources from the hippocampus or other brain regions to compensate for AD pathology. However earlier studies prove, that an increase in the slow band power in AD patients could be associated with a cortical loss of choline acetyltransferase [61]. Handayani et al. reported the maximum distal coherence on all frequency bands was observed at the right temporo-parietal area in the MCI group in comparison to healthy controls. In addition, in the MCI group, the maximum distal coherence in the delta and theta band was observed at the right fronto-central-parietal region. In the frontal and temporal areas, the interhemispheric coherence in the MCI group was greater than in the control group [51]. Moretti et al. showed that MCI subjects have a general decrease of coherence except an increase of interhemispheric coherence on temporo-parietal regions especially in theta frequency [62]. His previous study has demonstrated that this increase is due to hippocampal atrophy [63]. It has been suggested that the increase of coherence between temporal regions is determined by an increase of excitability [64]. Jimenez-Balado et al. declare a dysregulation of inhibitory GABAergic system following the hippocampal atrophy [65]. GABAergic dysfunction plays a key role in the early hippocampal hyperactivity that is associated with episodic memory impairments in people at risk for, and with, AD. It could be inferred that, this activity is emerging as a new default mode of brain activity characterized by hyperactivity of the cerebral cortex, even during resting state.
Another interesting finding of our research was increased PLI in the theta power, especially in frontal and temporal regions in patients with aMCI (large effect). These results are in agreement with those obtained by Briels et al., who showed reproducible effects in the theta frequency band in AD patients. A higher functional connectivity, measured by PLI, in the theta frequency band in AD subjects was observed [66]. Contrary to this report, Toth et al. showed a significant decrease of intra-regional PLI in aMCI patients, mainly within the left and right frontal region. In the inter-regional measurement aMCI patients noted significantly lower PLI between the left frontal and temporal areas and frontal and parietal areas in both hemispheres [67]. The results achieved by Toth et al. reflect those of Youssef et al., who reported decreased values of local and global PLI patterns in the theta band of aMCI patients [68]. The reason for these differences can probably be due to the measurement method used or the heterogeneity of aMCI, in which it is possible that decreased patterns of PLI, as a manifestation of disconnection syndrome, appears later in the course of aMCI, closer to the clinical transition to AD.
The strength of our study is well clinically selected group of patients with amnestic MCI, which can lead directly do AD. A study in such a homogenous group of patients demonstrates changes in the early stages of AD in more detail than in a whole group of MCI patients, which includes amnestic and non-amnestic subtypes that can lead to other dementias or may be reversible in time. This in consequence distorts the inference about the changes typical of the early beginnings of AD. Therefore, our research is of particularly importance in the context of early diagnosis and the implementation of preventive methods. We are aware that our study has certain limitations. Firstly is the number of studied sample. It would be worth confirming our results on a larger group of patients with aMCI. Secondly, follow up would be very useful in the context of several years of prospective observation and confirmation of which EEG changes in the process of cognitive deterioration are the most important and most predictable of the evolution to full-blown AD.
Conclusions
Spectral and connectivity analysis of qEEG recordings of aMCI patients differs from healthy controls. QEEG spectral analysis revealed decrease of global relative beta band power and increase of global relative theta and delta power in aMCI patients. Power spectral ratio can be a good biomarker of cognitive deterioration in aMCI. Decreased coherence in centroparietal right area can be an early qEEG biomarker of functional disconnection of the brain network in aMCI patients. Increased coherence in temporooccipital right region, can be one of the first exponents of the ongoing neurodegenerative process with a hyperactivation of the brain network. Disconnection in the form of disordered PLI appears to occur in the later stages in the clinical progression from aMCI to AD. qEEG analysis, especially in the form of coherence patterns, could become a useful diagnostic tool for the diagnosis of cognitive impairment at an early stage of aMCI.
Footnotes
ACKNOWLEDGMENTS
The authors are grateful and would like to thank mgr Jacek Pradela, Department of Applied Linguistics, Faculty of Organization and Management, Silesian University of Technology, for his help in improving the English in the manuscript.
FUNDING
The authors have no funding to report.
CONFLICT OF INTEREST
The authors have no conflict of interest to report.
DATA AVAILABILITY
The data supporting the findings of this study are available on request from the corresponding author. The data are not publicly available due to privacy or ethical restrictions.