
Abstract
Background:
Alzheimer’s disease (AD) is accompanied with impaired neurovascular coupling. However, its early alteration remains elusive along the AD continuum.
Objective:
This study aimed to investigate the early disruption of neurovascular coupling in cognitively normal (CN) and mild cognitive impairment (MCI) elderly and its association with cognition and AD pathologies.
Methods:
We included 43 amyloid-β-negative CN participants and 38 amyloid-β-positive individuals (18 CN and 20 MCI) from the Alzheimer’s Disease Neuroimaging Initiative dataset. Regional homogeneity (ReHo) map was used to represent neuronal activity and cerebral blood flow (CBF) map was used to represent cerebral blood perfusion. Neurovascular coupling was assessed by CBF/ReHo ratio at the voxel level. Analyses of covariance to detect the between-group differences and to further investigate the relations between CBF/ReHo ratio and AD biomarkers or cognition. In addition, the correlation of cerebral small vessel disease (SVD) burden and neurovascular coupling was assessed as well.
Results:
Related to amyloid-β-negative CN group, amyloid-β-positive groups showed decreased CBF/ReHo ratio mainly in the left medial and inferior temporal gyrus. Furthermore, lower CBF/ReHo ratio was associated with a lower Mini-Mental State Examination score as well as higher AD pathological burden. No association between CBF/ReHo ratio and SVD burden was observed.
Conclusion:
AD pathology is a major correlate of the disturbed neurovascular coupling along the AD continuum, independent of SVD pathology. The CBF/ReHo ratio may be an index for detecting neurovascular coupling abnormalities, which could be used for early diagnosis in the future.
Keywords
INTRODUCTION
Alzheimer’s disease (AD) is the most common cause of dementia characterized by progressive cognitive decline such as memory loss [1]. Its pathological process is typical of amyloid-β (Aβ) and hyperphosphorylated tau [2, 3]. In addition, AD is accompanied by a mismatch between cerebral blood flow and neuronal activity (impaired neurovascular coupling) [4–6]. Recently, this disturbance was usually referred to as an underlying mechanism for cognitive impairment in AD, while improvements in cognitive function can be found in AD mice once the impaired coupling is restored [7, 8]. Besides, accumulating evidence suggested that AD pathologies including Aβ and tau could lead to dysfunction of neurovascular units and then disruption of neurovascular coupling [9–14]. However, these effects were almost observed in animal models with little in vivo study, and more efforts are needed to investigate the condition of neurovascular coupling in AD patients.
Promisingly, with the aid of neuroimaging approaches, brain abnormalities in humans can be evaluated in multiple aspects by multimodal magnetic resonance imaging (MRI). Previous studies have reported alterations in brain function and regional perfusion in AD signature regions such as the hippocampus, amygdala, and medial temporal lobe [15–17], but their relationship in AD patients is still not clear. Liang et al. [18] developed a new approach to achieving the exploration of neurovascular coupling by combining resting-state functional MRI (fMRI) and arterial spin labeling (ASL) MRI. They identified a tight relationship between blood supply and brain functional topology in healthy people [18]. This new method has been successfully used to detect altered neurovascular coupling in patients with neurological disorders such as AD, schizophrenia, and Parkinson’s disease [19–21]. Recently, one study has showed gender differences in neurovascular coupling across AD clinical stages (e.g., cognitive normal [CN], mild cognitive impairment [MCI], dementia) [21]. In addition, this coupling is negatively related to clinical syndromes and cognitive function in females with AD. However, the change of neurovascular coupling remains elusive across the biological stage of AD defined by related pathological biomarkers [22].
Besides, cerebral small vessel disease (SVD) is common both in aging and AD [23–25], and previous studies have shown that it is associated with hypoperfusion and neurovascular dysfunction [26, 27]. Therefore, it is necessary to assess the possible effects of SVD on CBF-related analyses and its contribution to neurovascular coupling along the AD continuum.
Based on the Amyloid/Tau/Neurodegeneration (A/T/N) research framework [28], we aimed to investigate the relationship between regional neuronal activity and cerebral perfusion measured by fMRI and ASL in preclinical and prodromal AD patients. According to previous findings, we hypothesized that neurovascular coupling would be impaired along the AD continuum, which may be in connection with cognitive assessments and AD pathologies including both cerebral amyloidosis and tauopathy, independent of SVD pathology.
MATERIALS AND METHODS
Participants
All data used were obtained from the Alzheimer’s Disease Neuroimaging Initiative (ADNI; recruitment phase III) database (https://ida.loni.usc.edu/), an ongoing longitudinal multi-site study launched in 2003. All participants provided written informed consent. In the present study, we included a sample of 66 CN and 55 MCI elderly with available structural MRI, resting-state fMRI, ASL MRI, and amyloid positron emission tomography (PET) (18F-florbetapir [AV-45] or 18F-florbetaben [FBB]) before April 1, 2021.
Detailed information of enrollment protocols for ADNI have been described previously [29]. The criteria for CN in ADNI included: (1) a Mini-Mental State Examination (MMSE) score ≥24; (2) a global Clinical Dementia Rating (CDR) score of 0; (3) no report of any cognition complaint; (4) no signs of depression (geriatric depression scale, GDS score ≤5). Furthermore, the criteria for MCI in the ADNI protocol were (1) subjective memory complaints; (2) objective memory loss, which was defined as scoring below an education-adjusted cutoff score for delayed recall on the Wechsler Memory Scale-Logical Memory (WMS-LM) test; (3) a CDR score = 0.5; (4) a MMSE score ≥24; (5) the on-site physician could not diagnose dementia at the time of screening; (6) a GDS score ≤5 [29]. The exclusion criteria were (1) serious medical, neurological, or psychiatric illness, (2) history of head trauma, (3) history of using non-AD-related medication known to influence cerebral function, and (4) drug or alcohol abuse [29].
They were further classified as amyloid positive (A+) or amyloid negative (A–) based on previously established cutoff values (A+ was defined by a cerebral-to-whole cerebellar standardized uptake value ratio (SUVR) ≥1.11 for AV-45 [30] or ≥1.08 for FBB [31]). Full methods are available through ADNI. Accordingly, we divided the study population into four groups: 1) A– CN (N = 45); 2) A+ CN (N = 21); 3) A+ MCI (N = 21); and A– MCI (N = 34). In line with Jack et al. [22, 32], all A– MCI participants were excluded because they were considered as non-AD neurodegeneration. The study’s flow chart is shown in Fig. 1. Finally, of 81 participants, 75 had tau PET (18F-flortaucipir [AV-1451]), and 80 had apolipoprotein E (APOE) genotyping.
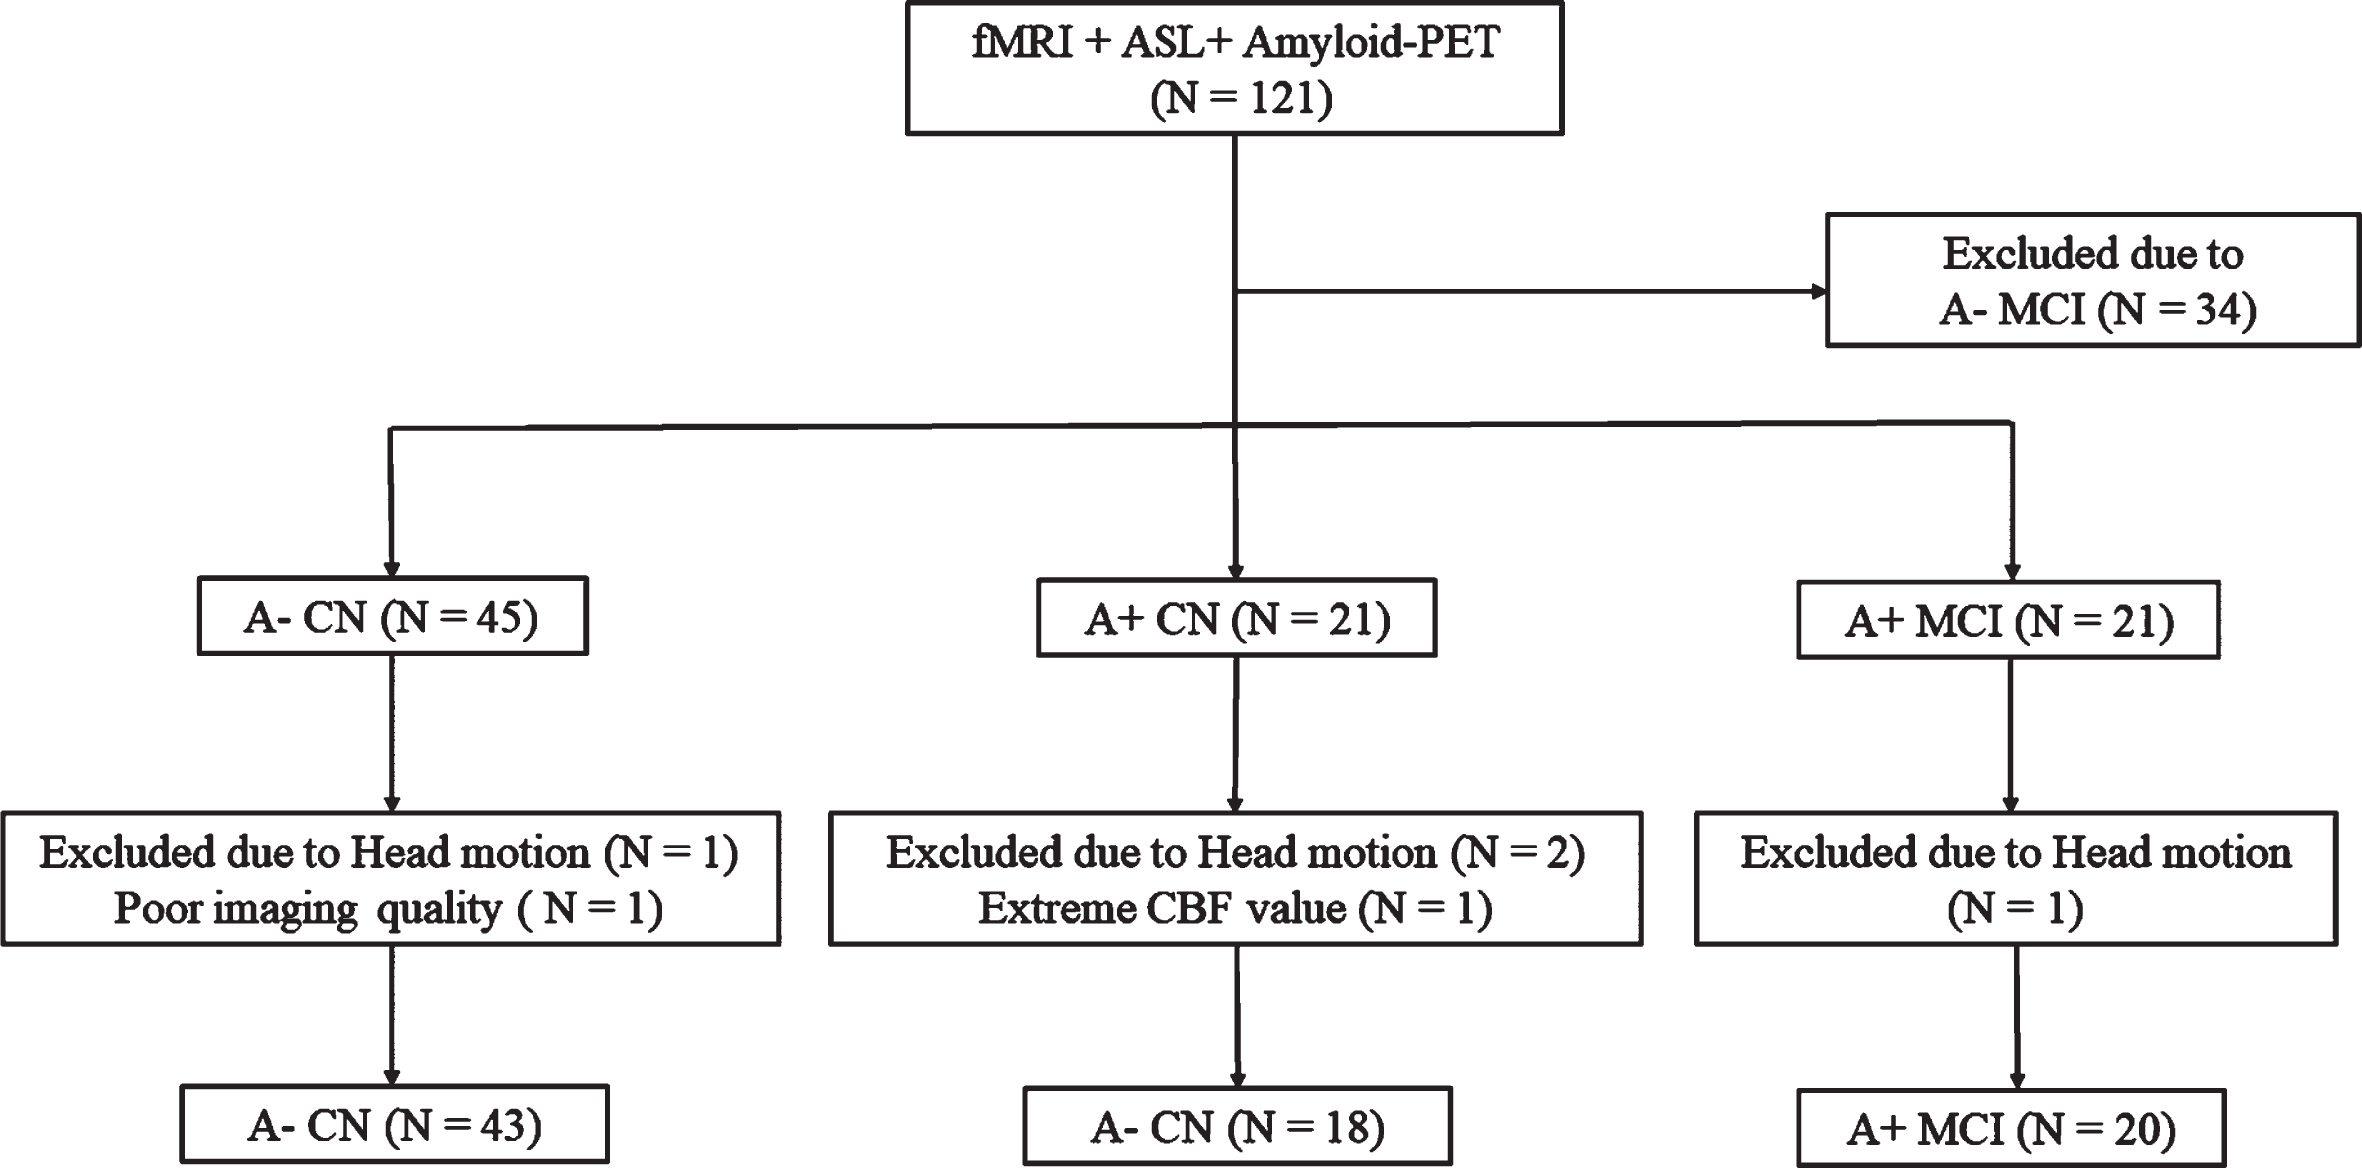
Flow chart of participants inclusion from ADNI database. fMRI, functional magnetic resonance imaging; ASL, arterial spin labeling; PET, Positron Emission Tomography; CN, cognitive normal; MCI, mild cognitive impairment.
Neuropsychological performance
Global cognitive scores were assessed by MMSE. Additionally, a series of cognitive assessments involving multiple cognition domains were completed, including memory (WMS-LM), attention (trail-making test, Part A [TMT-A]), execution (trail-making test, Part B [TMT-B]), and language (animal fluency test [AFT]).
APOE genotyping
APOE genotyping was performed as previously described [33]. Specifically, DNA was extracted from peripheral blood cells. Then, the cells were sent via overnight delivery to the University of Pennsylvania AD Biofluid Bank Laboratory (ApoE-Results, ADNI 3) for analysis.
Amyloid PET and tau PET acquisition processing
Full protocols of PET imaging data acquisition and processing can be found online at adni.loni.ucsd.edu. In sum, amyloid PET imaging was undertaken using AV-45 or FBB, and tau PET was undertaken using AV-1451. Preprocessed PET images were co-registered to the participant’s closest T1 image in native space and FreeSurfer-based anatomical parcellations were applied to extract region-of-interest (ROI)-based values. SUVR scores were obtained by normalizing ROI values to the mean uptake of the whole cerebellum for amyloid PET data, and to the mean uptake of the inferior cerebellar grey matter (GM) region for tau PET data, following previous recommendations [30, 35]. Additionally, for amyloid PET, to obtain comparable quantification of the amyloid burden across tracers, we followed the way of centiloid calculation as recommended for the ADNI pipeline (https://adni.loni.usc.edu/wp-content/themes/freshnews-dev-v2/documents/pet/ADNICentiloidsFinal.pdf). The global Aβ centiloid was used for each participant in our Aβ-related analyses. For tau PET, we restricted tau PET ROI analyses in the early-moderate stage of tau’s deposition predilection areas, that is, Braak stage I ROI (entorhinal ROI) and temporal meta-ROI (entorhinal, amygdala, parahippocampal, fusiform, inferior temporal, and middle-temporal-ROIs).
MRI data acquisition
All MRI data were obtained on 3T General Electric (GE) discovery 750 MRI scanner using an eight-channel phased array head coil according to the imaging protocol of ANDI phase III. In accordance with the human scanning protocol of the ADNI database protocol (https://adni.loni.usc.edu/methods/documents/), all participants kept their eyes open during the entire MRI scan.
The structural MR scans were performed using Magnetization-Prepared Rapid Gradient-Echo (MP-RAGE) sequence with the following parameters: spatial resolution = 1×1×1 mm3; repetition time (TR) = 7.3–7.7 s; echo time (TE) = 2.9–3.1 ms; Flip angle (FA) = 11°; slice thickness = 1 mm without intervals; and FOV = 208×240×256 mm.
The resting-state fMRI data were obtained axially by using echo-planar imaging (EPI) sequence with the following parameters: 200 time points; spatial resolution = 3.4×3.4×3.4 mm3; TR/TE = 3000/30 ms; FA = 90°; slice thickness = 3.4 mm without gap; matrix size = 64×64 mm; FOV = 220×220×163 mm.
ASL MRI scans were collected using a background suppressed 3D pseudo-continuous ASL sequence with the following parameters: spatial resolution = 1.9×1.9×4 mm3; TR/TE = 4885/10.5 ms; FA = 111°; PLD = 2000 ms; slice thickness = 4 mm; matrix size = 128×128 mm; FOV = 240×240×160 mm and units: ml/100 g/min.
Resting-state fMRI analysis and ReHo calculation
The fMRI data were preprocessed by the Data Processing and Analysis of Brain Imaging toolbox (DPABI, Version 4.5, http://rfmri.org/dpabi) [36] on the basis of Statistical Parametric Mapping (SPM, Version 12, https://www.fil.ion.ucl.ac.uk/spm/software/spm12/) implemented in MATLAB R2016a (MathWorks, Natick, MA, USA). Firstly, data were converted to NIFTI format, and the initial 10 volumes were discarded. Slice timing and realignment for head motion correction for the remaining images were then performed. We excluded 4 participants (including 1 A– CN, 2 A+ CN and 1 A+ MCI participants) according to the criteria of head motion more than 3.0 mm or 3.0° in maximum. After that, fMRI images were spatially normalized to the EPI template, resampled into 3×3×3 mm3. Next, we removed linear trends and regressed out covariates, including Friston 24 head motion parameters, white matter (WM) signal, cerebrospinal fluid (CSF) signal, and global signal. Finally, a temporal bandpass filter using a frequency range of 0.01–0.1 Hz was applied to the datasets.
Regional homogeneity (ReHo) was calculated to assess regional signal synchronizations [37]. The generated ReHo map was further standardized into z-scores by subtracting the mean and then dividing by the standard deviation of global values within the gray matter mask. The processed ReHo maps were then smoothed with a of 6×6×6 mm3 full widths at half maximum (FWHM) Gaussian kernel to decrease spatial noise.
ASL preprocessing and CBF calculation
ASL data were preprocessed using ExploreASL version 1.2.0 (https://github.com/ExploreASL/ExploreASL) [38], an automated MATLAB and SPM based toolbox, following the consensus recommendations for the acquisition and quantification of ASL images [39]. The whole processing pipeline can be obtained elsewhere [38]. Briefly, the structural images are segmented into GM, WM, and CSF maps, and normalized to the Montreal Neurological Institute (MNI) standard space. In this step, the deformation field of each participant was generated. The processing procedure of the ASL images included correcting for motion, removing outliers, registering with the structural data, and processing the M0 images. Then, the CBF was quantified based on recommended modeling for clinical applications. Finally, the partial volume effect (PVE) correction was performed. All statistical analyses were computed based on PVE corrected GM-CBF data. During this step, we further excluded participants with poor image quality (1 A– CN participant) and with extreme CBF mapping out of the range of mean CBF±3 standard deviations (1 A+ CN participant) [32].
The normalization and smoothing of CBF maps were using SPM12 software implemented in MATLAB. For each participant, the PVE corrected GM-CBF image was written into the MNI space using the deformation parameter derived from the prior step and was resliced into 3×3×3 mm3. Then, the CBF maps were further z-scored for standardization and standardized CBF maps were spatially smoothed with a 6-mm FWHM Gaussian kernel.
CBF/ReHo ratio calculation
To evaluate the amount of metabolic energy per unit of neuronal activity, we computed the CBF/ReHo ratio (both was standardized value with z-transformation) of each voxel within GM mask, which could reflect the neurovascular coupling for a specific voxel or region. Regions with higher CBF/ReHo ratio tend to have higher metabolic demands to connect them to the rest of the brain [18].
Cerebral small vessel disease visual rating
The presence of SVD markers (white matter hyperintensity [WMH], lacunes, microbleeds and enlarged perivascular spaces) were rated according to the Standards for Reporting Vascular Changes on Neuroimaging (STRIVE) criteria [40], summed to create the SVD total score (0–4; higher score represents higher SVD burden) [41].
Cerebral microbleeds were defined as areas of signal void on T2*-weighted MRI. T2*-weighted scans were acquired with a 3-echo train GRE sequence; spatial resolution = 0.85×0.85×4 mm3; TR/TE = 650/20 ms; slice thickness = 4 mm; FOV = 220×220×176 mm.
WMH was evaluated using Fluid-Attenuated Inversion Recovery (FLAIR) scans. 3D FLAIR scans were acquired with spatial resolution = 1.2×1×1 mm3; TR/TE/TI = 4800/119/1650 ms; FA = 20°.
Statistical analysis
Statistical analyses of demographic data were performed using IBM SPSS Statistics Version 25 (IBM SPSS Statistics for Windows). Results with p < 0.05 were considered statistically significant. Continuous and categorical variables were expressed as mean±standard deviation and percentage respectively. Image analyses of CBF/ReHo ratio differences were conducted by DPABI toolbox. The effect of the group on CBF/ReHo ratio of each group was assessed using analysis of covariance (ANCOVA), controlled for age, gender, and years of education. Comparison of CBF/ReHo ratio was restricted to the gray matter areas and the Gaussian random field (GRF) method was applied to multiple comparisons correction. The statistical threshold was set at p < 0.005 with a cluster-level p < 0.05 (two-tailed).
For each participant, the cluster with significant between-group difference was binarized to yield the mask for extracting mean CBF/ReHo ratio value from the cluster. Then, we performed a post hoc analysis between each group. To better understand what may drive the alteration in CBF/ReHo ratio, we further extracted mean CBF and ReHo values from the cluster using the mask to compare the differences among the three groups. The results were corrected for multiple comparisons by using the Tukey’s Honestly Significant Difference (HSD) method.
Furthermore, to test the clinical significance, we correlated the CBF/ReHo ratio with neuropsychological performance and AD biomarkers by partial correlation analysis. All analyses were controlled for the confounding effects of age, gender, and years of education. Considering the effect of head motion and APOE genotypes, we also repeated the analyses above after taking into mean framework displacement and APOE ɛ4 carrier status as covariates. Bonferroni correction for multiple comparisons was performed.
Lastly, to assess the contribution of SVD pathology to AD neurovascular coupling, we tested the associations between SVD total score and CBF-related imaging measurements (CBF/ReHo ratio and CBF).
RESULTS
Demographic and clinical characteristics
We included 81 participants in the current study, including 43 A– CN, 18 A+ CN, and 20 A+ MCI participants in the overall sample. Table 1 shows the demographic information and clinical characteristics. No difference was registered in demographics (age, gender, and years of education) as well as SVD total score (p > 0.05) among the three groups, while the A+ groups were more likely to carry APOE ɛ4 than the A – group (p < 0.001).
Demographic and clinical characteristics of study population
acompared to A– CN group, p < 0.05, HSD corrected. bcompared to A+ CN group, p < 0.05, HSD corrected. #Available for 80 participants; *Available for 75 participants. †Data is PVE corrected and the unit: mL/100g/min. SVD, small vessel disease; MMSE, Mini-Mental State Examination; WMS-LM, Wechsler Memory Scale-Logical Memory; IR, immediate recall; DR, delayed recall; TMT-A, Trail Making Test Part A; TMT-B, Trail Making Test Part B; AFT, Animal fluency test; GM, grey matter; CBF, cerebral blood flow; PET, Positron Emission Tomography; SUVR, standardized uptake value ratio; ROI, region of interest; HDS, Tukey’s Honestly Significant Difference; PVE, partial volume effect.
Between-group comparison analyses of the CBF/ReHo ratio, CBF and ReHo
The CBF/ReHo ratio of the left medial temporal gyrus (MTG) and the left inferior temporal gyrus (ITG) showed significant difference (GRF-corrected voxel p < 0.005 and cluster p < 0.05, two-tailed) among the three groups (Fig. 2A, Table 2). The cluster was smaller but survived with a stricter statistical threshold (GRF-corrected voxel p < 0.001 and cluster p < 0.05, two-tailed) (Supplementary Figure 1, Supplementary Table 1).
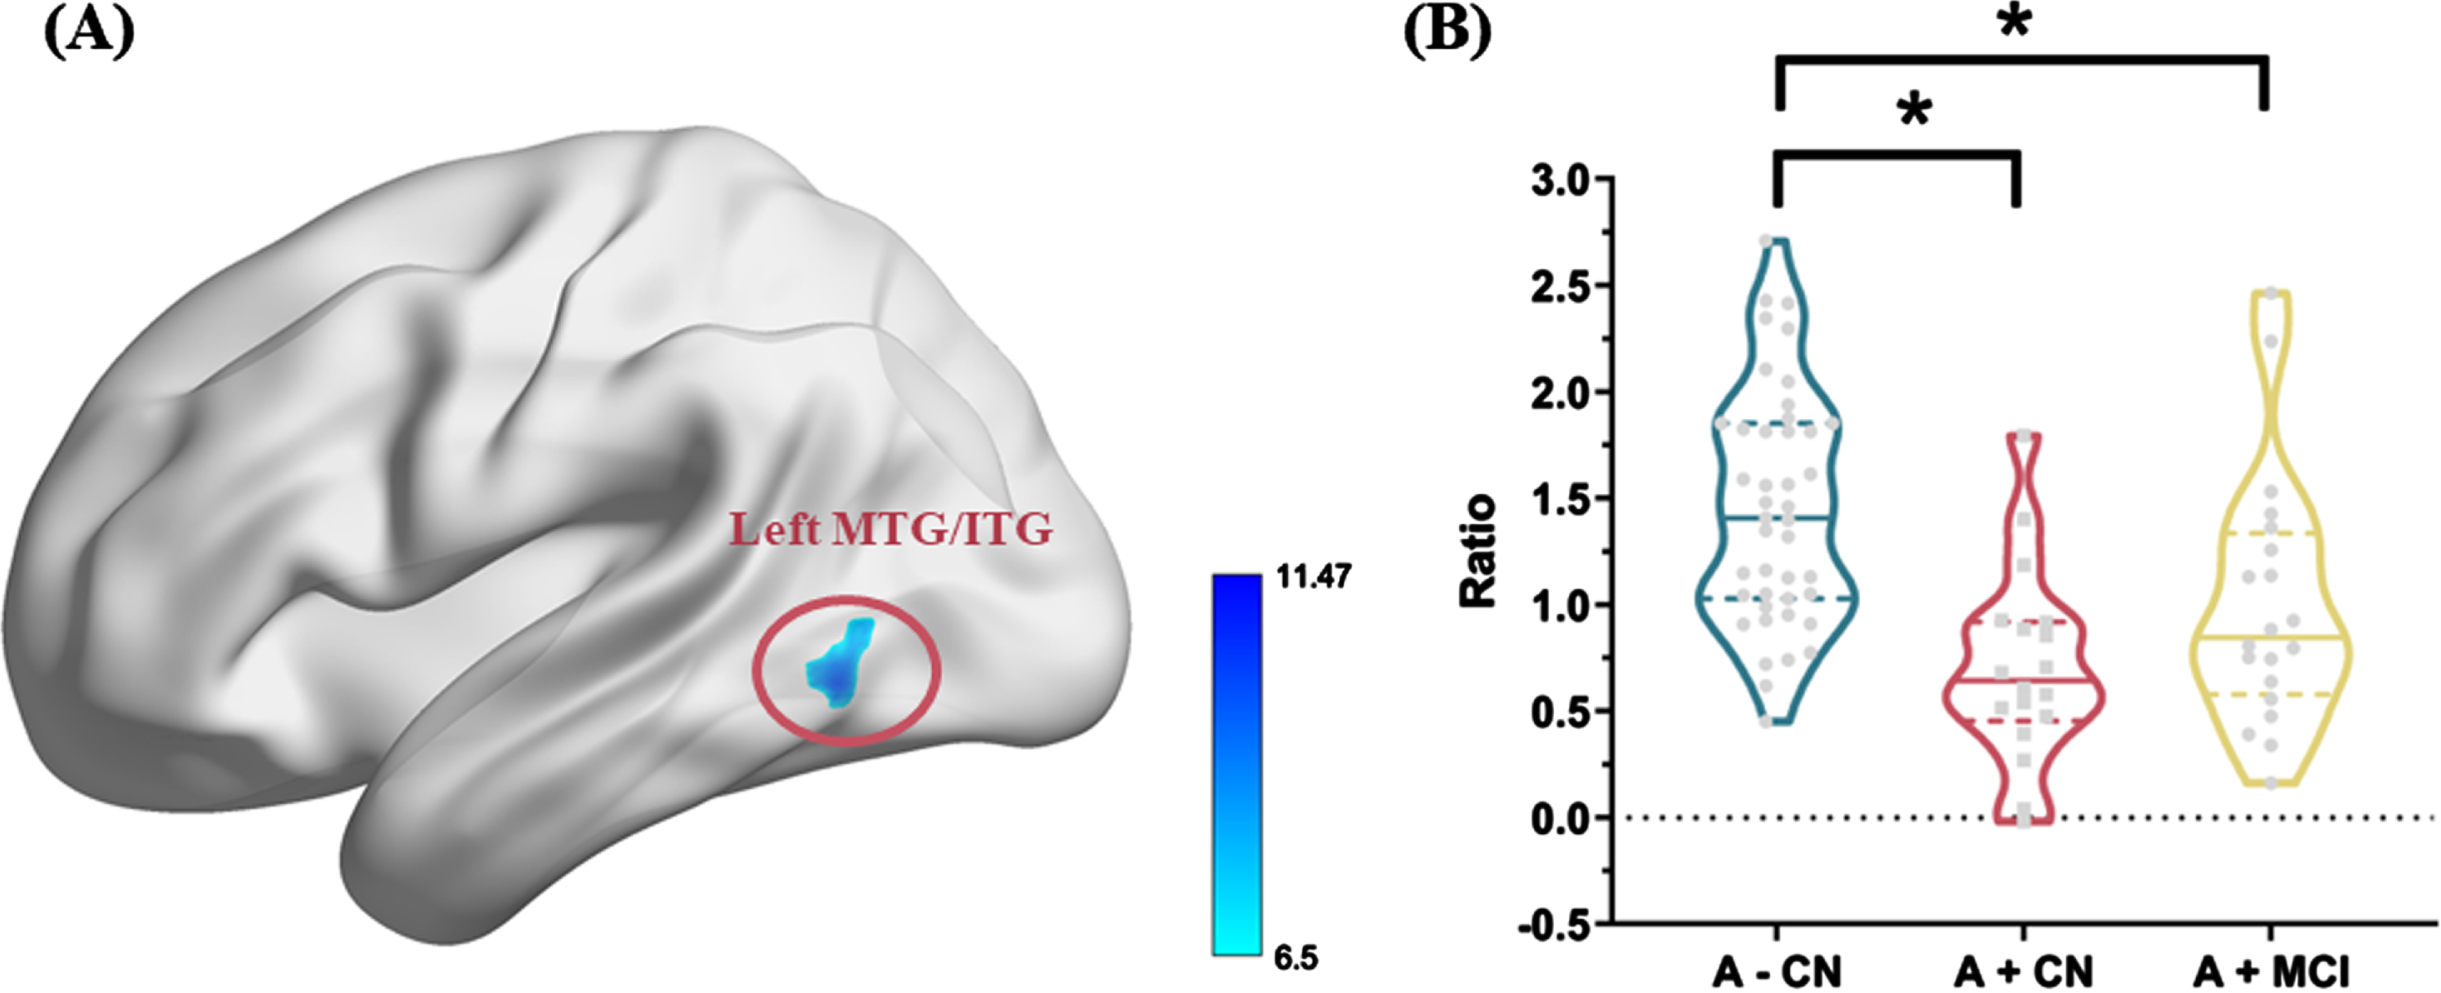
A) The ANCOVA analysis showed that CBF/ReHo ratio showed significant difference in the left MTG and ITG among three groups after controlling for age, gender, and years of education (p < 0.005 with a cluster level p < 0.05, two-tailed, GRF corrected). B) For the CBF/ReHo ratio value of the significant cluster, a post hoc-test of main effect for group. Significant differences are marked by asterisks as shown: *represents significance level of p < 0.05. CN, cognitive normal; MCI, mild cognitive impairment; ANCOVA, analysis of covariance; CBF, cerebral blood flow; ReHo, regional homogeneity; MTG, medial temporal gyrus; ITG, inferior temporal gyrus; GRF, Gaussian random field.
Brain areas showing between-group differences on CBF/ReHo ratio
The statistical threshold was set at p < 0.005 with a cluster level p < 0.05 (two-tailed, GRF corrected). MTG, medial temporal gyrus; ITG, inferior temporal gyrus; MNI, Montreal Neurological Institute; CBF, cerebral blood flow; ReHo, regional homogeneity; GRF, gaussian random field.
After post hoc analyses, A+ individuals showed decreased CBF/ReHo ratio compared to A– individuals (Fig. 2B). Post hoc analyses also illustrated that CBF in the left MTG/ITG was significantly lower in A+ CN individuals than A – cognitively intact controls, while there was no significant difference in ReHo among the three groups (Supplementary Figure 2).
Correlation analyses between cognitive performance with CBF/ReHo ratio, CBF and ReHo
As showed in Table 3, we found a significant positive correlation between the CBF/ReHo ratio and the MMSE score (r = 0.250, p = 0.027), which did not survive after Bonferroni correction (p < 0.05/6). No significant association was established between CBF/ReHo ratio and other cognitive measures. Meanwhile, a similar result was observed between the CBF value of the cluster and the MMSE score (r = 0.237, p = 0.037, uncorrected). The associations became weaker when we repeated analyses after controlling for head motion or both head motion and APOE ɛ4 carrier status (Supplementary Tables 2 and 3). Subgroup correlation analyses were also performed (Supplementary Table 4).
Correlations between the cognitive performance with CBF/ReHo ratio, CBF, and ReHo, after adjusting for age, gender, and years of education
CBF, cerebral blood flow; ReHo, regional homogeneity; MMSE, Mini-Mental State Examination; WMS-LM, Wechsler Memory Scale-Logical Memory; IR, immediate recall; DR, delayed recall; TMT-A, Trail Making Test Part A; TMT-B, Trail Making Test Part B; AFT, Animal fluency test. *p < 0.05, uncorrected. No significant p-value after Bonferroni correction (p < 0.05/6).
Correlation analyses between AD biomarkers with CBF/ReHo ratio, CBF and ReHo
As shown in Table 4, lower CBF/ReHo ratio was significantly related to higher Aβ PET centiloid (r = –0.364, p = 0.001) in a global sample. Results revealed that the CBF/ReHo ratio was also negatively associated with tau PET Braak I SUVR (r = –0.356, p = 0.002) and temporal meta-ROI SUVR (r = –0.299, p = 0.011), after adjusting for age, gender, and years of education. CBF value of the cluster was also negatively correlated to tau PET Braak I SUVR (r = –0.268, p = 0.023) and temporal meta-ROI SUVR (r = –0.328, p = 0.005), neither CBF or ReHo was associated with Aβ burden. The results remained almost unchanged after controlling for head motion or both head motion and APOE ɛ4 carrier status (Supplementary Tables 5 and 6). Subgroup correlation analyses were also performed (Supplementary Table 7).
Correlations between AD biomarkers with CBF/ReHo ratio, CBF, ReHo, after adjusting\\ for age, gender, and years of education
CBF, cerebral blood flow; ReHo, regional homogeneity; PET, Positron Emission Tomography; SUVR, standardized uptake value ratio; ROI, region of interest. *p < 0.05, uncorrected; **p < 0.01, uncorrected.
Correlation analyses between SVD total score with CBF/ReHo ratio and CBF
There was no significant association between SVD total score with either CBF/ReHo ratio or CBF among the three groups (Supplementary Table 8).
DISCUSSION
In the present study, we assessed the alteration of neurovascular coupling (reflected by CBF/ReHo ratio) along AD continuum. A+ participants showed decreased CBF/ReHo ratio in the left MTG and ITG. Notably, our main findings showed that lower CBF/ReHo was associated with worse global cognitive performance and higher AD pathology burden, independent of SVD pathology.
Our result of neurovascular coupling alteration in the left MTG and ITG in the early preclinical stage demonstrated its vulnerability to AD pathology. The temporal cortex is one area that is affected early in AD patients [42]. In MCI individuals, brain structural atrophy on MRI was observed in the left MTG [43]. Anatomically, the ITG is exactly right an early-moderate site of tau spread into the neocortex during Braak stage III [44]. Also, a postmortem study revealed the molecular mechanisms underlying this regional vulnerability [45]. There was a strong relationship between layer-specific differentially expressed genes and AD pathology (both Aβ and tau) in the MTG. Based on amyloid PET, age-associated longitudinal changes of Aβ accumulation were found mainly distributing in the MTG and ITG during cognitively intact healthy aging [46, 47]. Furthermore, our post hoc test implicated that the onset of neurovascular coupling disruption began in asymptomatic individuals with positive Aβ along the AD continuum, with evidence suggesting that neurovascular deficits may serve as an early biomarker of AD [6].
The decrease of CBF/ReHo ratio in our study showed negative correlations with AD pathology accumulation. It has been widely reported that Aβ-mediated vascular oxidative stress and neurovascular unit damage could lead to neurovascular dysfunction [11, 14]. In addition to Aβ deposition, tau pathology also has been shown to contribute to neurovascular uncoupling though the evidence was relatively less. A potential candidate mechanism includes tau pathology to cause cerebrovascular abnormalities and neurovascular unit dysfunction [12, 13]. Therefore, our finding of associations between CBF/ReHo ratio and AD pathology burden supported that both amyloidosis and tauopathy can damage the early neurovascular coupling in AD patients.
Further, our post hoc analyses of CBF and ReHo suggested that the result of decreased CBF/ReHo ratio was mainly driven by reduced CBF, which implied early vascular changes in this physiological process. Cerebrovascular dysregulation as detected by ASL has been identified as one of the first pathological events that occur in the preclinical phase of AD [48]. MCI individuals due to AD exist MTG hypoperfusion and hypometabolism [49, 50], which were also associated with AD pathology. In the presence of Aβ deposition, regional CBF showed reductions in the healthy brain, and metabolic disturbances were observed in brain regions including MTG and ITG [51, 52]. Specially, the significant association was not found between Aβ burden and either CBF or ReHo separately when we correlated amyloid PET with the measurements, but only between Aβ burden and CBF/ReHo ratio. According to the amyloid cascade hypothesis, Aβ abnormalities precede other pathological processes such as tau hyperphosphorylation, hypoperfusion, and hypometabolism in AD [53, 54]. Our result may support the early impact of Aβ on neurovascular decoupling. Along the disease progression, we also observed negative relevance between regional CBF and tau PET SUVR. Similarly, Rubinski et al. reported that higher tau burden was associated with lower CBF in the entorhinal cortex (Braak stage I) by combining tau PET and ASL MRI [55]. Moreover, our findings are consistent with a previous work [56], which showed a significantly negative correlation between meta-temporal CBF and meta-temporal tau PET but not Aβ PET within cognitively intact individuals. Taken together, we speculated that CBF/ReHo ratio may serve as a more sensitive and comprehensive measurement and could provide more information on the mismatch of regional perfusion and neuronal activity in the early stageof AD.
We noted a weak but measurable correlation between lower CBF/ReHo ratio and worse cognitive performance. The reason may be that the individuals we enrolled were at the relatively early stage with not much difference in condition of cognitive impairment. Extending these findings to AD dementia samples with more extensive range of cognitive decline may yield more significant correlation. Additionally, after adjusting for APOE ɛ4 carrier status, the association between CBF/ReHo ratio with MMSE score became weaker. It is well known that APOE ɛ4 allele is a strong genetic risk factor for AD [57]. Previous studies have shown that APOE ɛ4 allele is consistently associated with greater Aβ deposition and less Aβ clearance in the brains [58]. Besides, Wang et al. found that APOE ɛ4 allele was related to cognition through a CBF-mediated pathway and regional CBF of MTG showed the strongest mediating effects [59]. Overall, the APOE ɛ4 allele may lead to a dysregulation of the vascular structure and function with reduced cerebral perfusion, which in turn leads to cognitive impairment [59]. Therefore, we considered that APOE ɛ4 allele could influence neurovascular coupling in AD, which needs to study in the future work with a larger sample.
To our knowledge, this is the first neuroimaging study to investigate the relationship between impaired neurovascular coupling and AD pathology. However, there are still some limitations to the study. First, the sample size was relatively small, which may influence the statistic power of our study since several significant correlations failed to survive after Bonferroni correction. Future studies with large data set are warranted to validate our findings. Second, some individuals did not have tau PET data, which reduced the statistical power. Third, our study design was cross-sectional and not longitudinal, therefore we could not determine the temporal relationships between CBF/ReHo ratio and AD pathology. We speculate that the neurovascular decoupling first occurs with Aβ accumulation and goes a worse step further with the progression of tau formation. Future longitudinal studies combining both Aβ and tau can help follow the time course of the neurovascular coupling changes to reveal the earliest difference in the AD continuum, especially in participants with biomarker profile A– T– to A+ T– or A+ T– to A+ T+(T+ refers to tau positivity defined by established cutoff). Finally, CBF/ReHo ratio is an indirect measure of neurovascular coupling and does not allow accurate evaluations of the neurovascular unit or determination of the pathophysiological mechanisms underlying the altered neurovascular coupling, whereas more advanced approaches (deep learning, unsupervised learning) at the individual level are still needed.
CONCLUSION
In conclusion, AD patients at an early-stage exhibit disrupted neurovascular coupling before the onset of global cognitive impairment. This condition can be observed not only in an Aβ manner but also tau dependent, independent of SVD pathology. With the integrated fMRI and ASL approaches, the feature of CBF/ReHo may be a method for detecting neurovascular coupling abnormalities, which could serve as a noninvasive neuroimaging biomarker for the early detection of AD.
Footnotes
ACKNOWLEDGMENTS
Data collection and sharing for this study was funded by the Alzheimer’s Disease Neuroimaging Initiative (ADNI) (National Institutes of Health Grant U01 AG024904) and DOD ADNI (Department of Defense award number W81XWH-12-2-0012). ADNI is funded by the National Institute on Aging, the National Institute of Biomedical Imaging and Bioengineering, and through generous contributions from the following: Alzheimer’s Association; Alzheimer’s Drug Discovery Foundation; BioClinica, Inc.; Biogen Idec Inc.; BristolMyers Squibb Company; Eisai Inc.; Elan Pharmaceuticals, Inc.; Eli Lilly and Company; F. Hoffmann-La Roche Ltd and its affiliated company Genentech, Inc.; GE Healthcare; Innogenetics, N.V.; IXICO Ltd.; Janssen Alzheimer Immunotherapy Research & Development, LLC.; Johnson & Johnson Pharmaceutical Research & Development LLC.; Medpace, Inc.; Merck & Co., Inc.; Meso Scale Diagnostics, LLC.; NeuroRx Research; Novartis Pharmaceuticals Corporation; Pfzer Inc.; Piramal Imaging; Servier; Synarc Inc.; and Takeda Pharmaceutical Company. The Canadian Institutes of Health Research is providing funds to support ADNI clinical sites in Canada. Private sector contributions are facilitated by the Foundation for the National Institutes of Health (![]() ). The grantee organization is the Northern California Institute for Research and Education, and the study is coordinated by the Alzheimer’s Disease Cooperative Study at the University of California, San Diego. ADNI data are disseminated by the Laboratory for Neuro Imaging at the University of California, Los Angeles.
). The grantee organization is the Northern California Institute for Research and Education, and the study is coordinated by the Alzheimer’s Disease Cooperative Study at the University of California, San Diego. ADNI data are disseminated by the Laboratory for Neuro Imaging at the University of California, Los Angeles.
FUNDING
The National Natural Science Foundation of China funded this study, project No. 81971577 grant to Minming Zhang, project No. 82271936 grant to Xiao Luo, project No. 82202090 grant to Kaicheng Li, and project No. 81870826 grant to Yanxing Chen.
CONFLICT OF INTEREST
The authors have no conflict of interest to report.