
Abstract
Background:
Alzheimer’s disease (AD), a major dementia cause, lacks effective treatment. MRI-based hippocampal volume measurement using artificial intelligence offers new insights into early diagnosis and intervention in AD progression.
Objective:
This study, involving 483 AD patients, 756 patients with mild cognitive impairment (MCI), and 968 normal controls (NC), investigated the predictive capability of MRI-based hippocampus volume measurements for AD risk using artificial intelligence and evidence-based medicine.
Methods:
Utilizing data from ADNI and OASIS-brains databases, three convolutional neural networks (InceptionResNetv2, Densenet169, and SEResNet50) were employed for automated AD classification based on structural MRI imaging. A multitask deep learning model and a densely connected 3D convolutional network were utilized. Additionally, a systematic meta-analysis explored the value of MRI-based hippocampal volume measurement in predicting AD occurrence and progression, drawing on 23 eligible articles from PubMed and Embase databases.
Results:
InceptionResNetv2 outperformed other networks, achieving 99.75% accuracy and 100% AUC for AD-NC classification and 99.16% accuracy and 100% AUC for MCI-NC classification. Notably, at a 512×512 size, InceptionResNetv2 demonstrated a classification accuracy of 94.29% and an AUC of 98% for AD-NC and 97.31% accuracy and 98% AUC for MCI-NC.
Conclusions:
The study concludes that MRI-based hippocampal volume changes effectively predict AD onset and progression, facilitating early intervention and prevention.
Keywords
INTRODUCTION
Alzheimer’s disease (AD) is a neurodegenerative disorder characterized by memory loss and cognitive impairment, and it is the leading cause of dementia among the elderly globally [1]. According to the World Health Organization, approximately 50 million people worldwide are affected by dementia, with 60% to 70% of cases attributed to AD [2]. However, due to the complexity of the underlying mechanisms, there are currently no effective treatments available for AD [3]. Therefore, early diagnosis and prevention of AD are of utmost importance to facilitate early care, intervention, disease progression mitigation, and improved quality of life for patients [4]. Nevertheless, early diagnosis of AD still faces numerous challenges, particularly in the asymptomatic or early symptomatic stages where accurate diagnosis is often difficult to achieve [5].
Magnetic resonance imaging (MRI) is a non-invasive method that can detect high-resolution structural changes in the brain caused by brain atrophy, such as changes in thickness, volume, shape, and texture [6]. MRI has demonstrated great potential in the diagnosis of AD [7]. Specifically, measuring hippocampal volume through MRI allows for direct reflection of pathological changes in the brain [8]. The hippocampus is a crucial brain region involved in important functions like memory formation and spatial orientation [9]. In the course of AD, the hippocampus often experiences atrophy, which serves as an important biomarker and clinical diagnostic criterion for AD [10]. Therefore, measuring hippocampal volume changes through MRI can aid in accurate identification and even prediction of AD development before symptoms manifest [8].
In recent years, the application of artificial intelligence (AI) and deep learning techniques in medical image analysis has become increasingly prevalent, particularly in medical image classification, diagnosis, and prediction [11]. Deep learning can automatically learn and extract useful features from large amounts of medical image data, enabling disease diagnosis and prediction [12–14]. Furthermore, deep learning techniques possess the ability to handle big data, allowing for the processing of large quantities of medical image data in a short time, greatly improving diagnostic efficiency and accuracy [12, 16]. Consequently, the application of deep learning techniques in measuring hippocampal volume through MRI holds promise for enhancing the accuracy of early diagnosis and prediction of AD [17].
This study adopts three deep learning frameworks of convolutional neural networks (CNN): InceptionResNetv2, Densenet169, and SEResNet50. These deep learning frameworks have advantages and can effectively extract valuable features from MRI images to diagnose and predict AD. Meanwhile, we also adopted the method of evidence-based medicine Meta-analysis, which systematically evaluates and synthesizes existing studies. It can enhance research effectiveness and accurately assess interventions’ effects. It is of great value for understanding and solving complex medical problems.
This study aims to examine the value of using artificial intelligence techniques and evidence-based medicine meta-analysis methods to predict the occurrence and progression of AD based on MRI measurements of hippocampal volume (Fig. 1). We aim to investigate if the accurate prediction of AD using MRI measurements of hippocampal volume would significantly impact early diagnosis and treatment of AD, as well as provide new insights and approaches for future research.
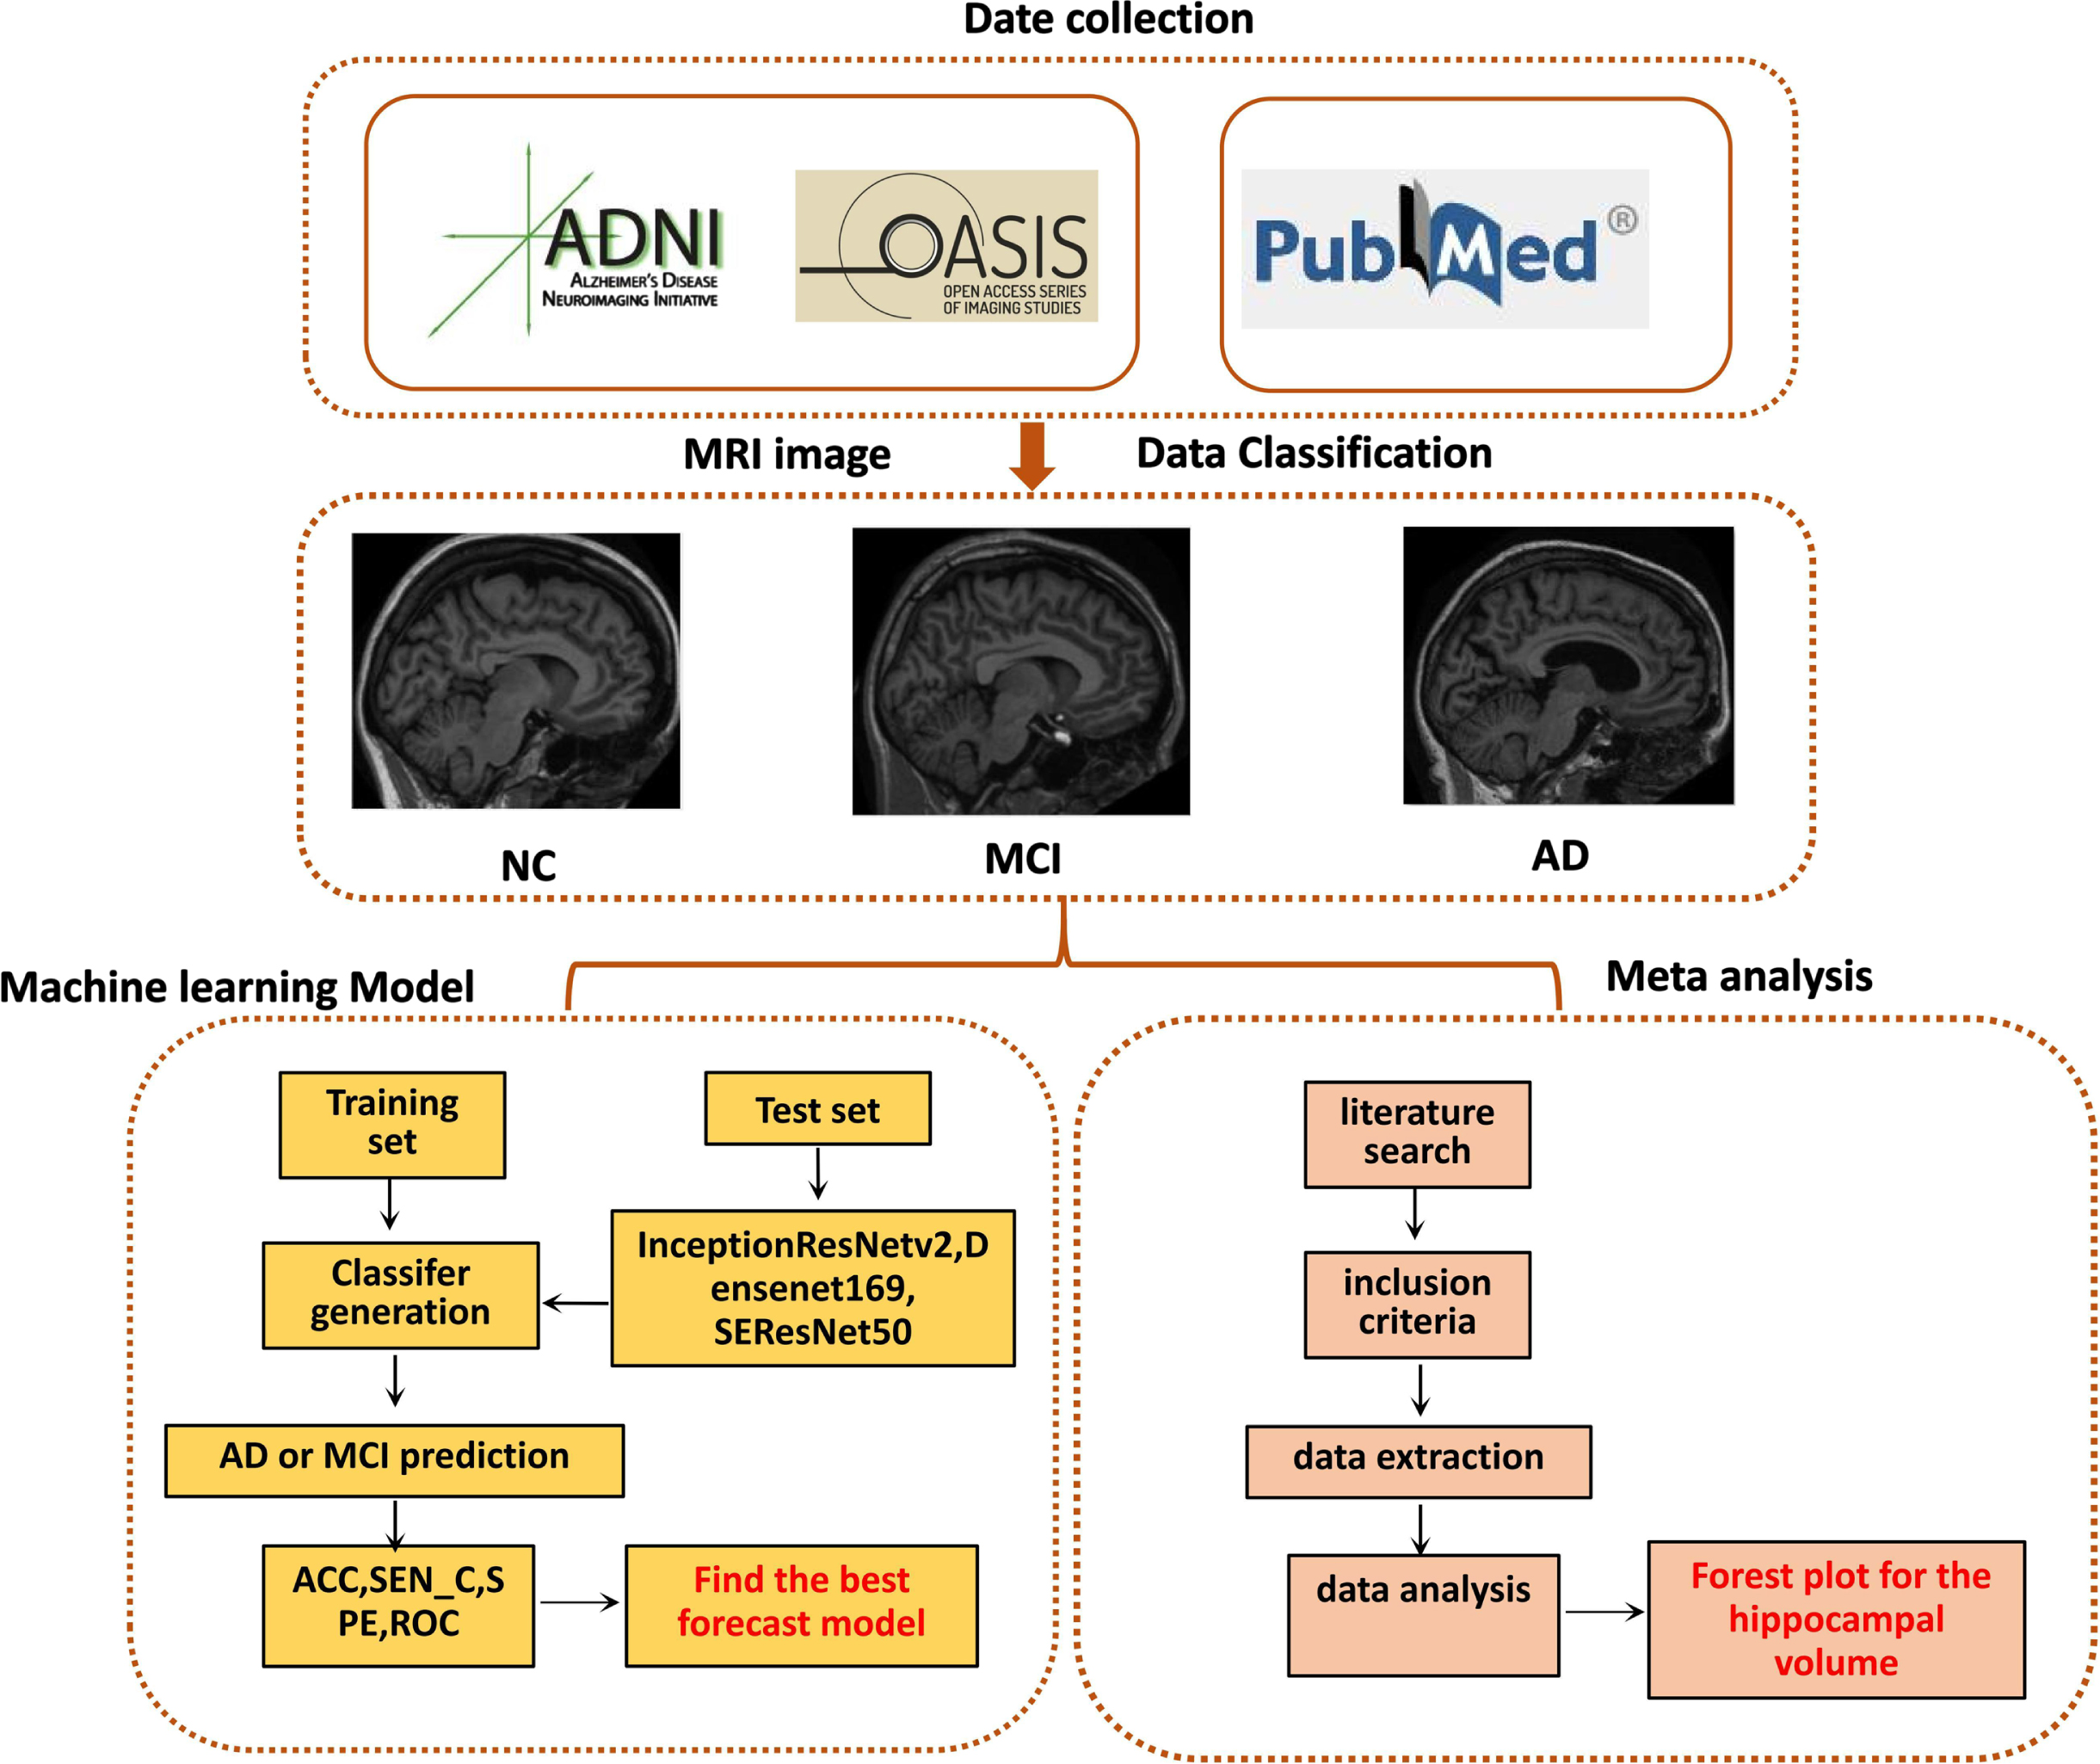
Process of artificial intelligence technology and meta-analysis in evidence-based medicine.
METHODS
Experimental data and grouping
The data used in this study were obtained from the Alzheimer’s Disease Neuroimaging Initiative (ADNI) database (http://adni.loni.usc.edu). ADNI, initiated in 2003 as a public-private partnership, is led by the principal investigator Michael W. Weiner, MD. The main goal of ADNI is to examine the feasibility of combining longitudinal MRI, positron emission tomography, other biomarkers, clinical, and neuropsychological assessments to measure the progression of mild cognitive impairment (MCI) and early AD. We selected participants with MRI images from the Alzheimer’s Disease Neuroimaging Initiative (ADNI) database (https://adni.loni.usc.edu/data-samples/access-data/) and the OASIS-brains database (http://www.oasis-brains.org) for our study. The participants were divided into three groups based on the Mini-Mental State Examination (MMSE) score, Clinical Dementia Rating (CDR) score, and the diagnostic criteria from the Diagnostic and Statistical Manual of Mental Disorders: Normal Control group (NC), MCI group, and AD group. A total of 2,057 subjects from the ADNI database and 150 subjects from the OASIS dataset were randomly selected, including 968 regular control participants, 756 individuals with MCI, and 483 patients with AD. For subjects present in multiple ADNI datasets, we retained only one. The OASIS dataset was classified based on the ADNI standards. The inclusion criteria for each group were as follows: 1) NC group: age, gender, and education level matched; no memory decline; MMSE score of 24 to 30; CDR score of 0; normal cognitive functioning and no impairment in basic daily activities. 2) MCI group: MMSE score of 24 to 30; CDR of 0.5 with no other cognitive impairments; no impairment in basic daily activities. 3) AD group: MMSE score of 17 to 23; CDR of 0.5 or 1.0; diagnosed with AD according to the NINCDS/ADRDA criteria.
Data preprocessing for experiments
Before performing feature extraction and classification on MRI images, preprocessing is required. The preprocessing steps for MRI images mainly include the following: 1) motion correction and format adjustment, 2) non-uniform intensity normalization using the N3 algorithm, 3) computation of Talairach transformation, 4) intensity normalization, 5) skull stripping and affine registration using FreeSurfer 3.4.0 software (https://fsl.fmrib.ox.ac.uk/), and then 6) spatial normalization of the data to the Montreal Neurological Institute (MNI) space using the Statistical Parametric Mapping (SPM) toolbox, 7) followed by 8 mm Gaussian smoothing using MATLAB 2020a.
The construction of deep learning prediction models and the analysis of image data
In this study, we employed three deep-learning prediction models: InceptionResNetv2, Densenet169, and SEResNet50 deep-learning prediction models, which served as pre-trained weights for our work [18, 19]. We retrain the InceptionResNet v2 model, fine-tuning all its layers, replacing the top layer with global average pooling, a fully connected layer, and finally, a softmax layer for classifying two diagnostic categories. DenseNet169 solves the problem of vanishing gradients by using a simple connectivity pattern that ensures the maximum flow of information between layers in both forward and backward computations. These layers are connected so that the input from all previous layers is passed through its feature map to all subsequent layers. SEResNet50 uses identity mapping to map the input. This identity mapping has no parameters and adds the output from the previous layer to the front layer. Skip connections between layers and add the previous layer’s output to the stacked layer’s output. This study enables them to train deeper networks than before.
We use the CUDA 10 parallel computing platform and CUDNN 7.3 deep neural network GPU acceleration library to build the experimental environment, and we use Python to write relevant functional modules. We use PyTorch 1. x as our deep learning framework, with an NVIDIA RTX 2080TI GPU configured with 11 GB of VRAM. We import MRI preprocessed data and perform standardization on the MRI data. We divide the dataset into training and test sets, using 80% and 20% of the images. We train and classify data to build predictive models. In the test set, we calculated the prediction accuracy, sensitivity, and specificity parameters of the prediction model.
Dataset and process implementation
To address the diagnostic challenges in AD, we integrated multiple task-based deep learning models to classify AD disease using MRI data. The deep learning framework was evaluated on structural MRI data from 968 NC, 756 MCI, and 483 AD participants obtained from the ADNI and OASIS-brains databases.
Test the classification tasks, with binary classification tasks used to distinguish AD from NC and MCI from NC. To adjust the parameter of the number of iterations in the deep learning model, randomly select 20% of the training data as an independent test set and use the remaining training data to train the model. Regarding pre-training parameter settings, weights are initialized based on the pre-trained network, the custom score threshold is set to 0.5, and the initial number of iterations is set to 100. The decision to continue checkpoint retraining is based on test results to converge the loss value further. The batch processing parameters are initially set to 42 based on the experiment graphics card model to prevent overflow of video memory. The stride coefficient is kept at 10, and the padding is kept at 1. The parameter settings are shown in Table 1.
Data analysis parameter setting
To evaluate the performance of the classification model, we calculated four performance metrics, including classification accuracy (ACC), sensitivity (SEN_C), specificity (SPE), and the Area under the receiver operating characteristic curve (AUC). ACC is the proportion of correctly classified participants in the entire population, SEN_C is the classification accuracy for AD and MCI patients, SPE is the classification accuracy for NC, and the ROC curve is the plot of the actual positive rate (TPR) against the false positive rate at different threshold settings of the predicted results.
Literature retrieval and screening
Search strategy: We conducted a meta-analysis based on the PRISMA (Preferred Reporting Items for Systematic Reviews and Meta-Analyses) 2009 guidelines [20]. We searched the PubMed and EMBASE databases for English literature published until March 2023. We searched the following terms in the title, abstract, or descriptor: Alzheimer’s disease, AD, cognitive dysfunction, mild cognitive impairment, MCI, magnetic resonance imaging, MRI, and hippocampal volume. Our study is limited to human studies.
Inclusion criteria: 1) Peer review; 2) Original research; 3) English literature; 4) Study population of at least 10 individuals; 5) Mild cognitive impairment (MCI), AD (based on clinical diagnosis according to the criteria of the National Institute of Neurological and Communication Disorders and Stroke-Alzheimer’s Disease and Related Disorders Association) or healthy controls; 6) Structural MRI for selecting hippocampal volume.
The exclusion criteria are as follows: 1) non-original research (such as methodological studies, reviews, meta-analyses, or case reports); 2) animal or postmortem studies or studies using imaging modalities other than magnetic resonance imaging; 3) studies conducted using the same sample in different publications. If studying the use of partially overlapping samples, we classify studies with smaller sample sizes as outliers and exclude them from the network meta-analysis but include them in the systematic review. In addition, we manually screened the list of references included in the study to obtain articles that met other criteria.
The literature screening was conducted using the reference management program EndNote (Clarivate Analytics, USA). Two independent researchers reviewed the titles and abstracts of the literature, screened the articles, extracted data, and cross-checked them based on preset inclusion and exclusion criteria. In case of any disagreement between the two researchers, it was resolved through discussion or with the assistance of a third researcher.
As shown in Supplementary Table 1, we extracted the following baseline data: 1) first author’s name; 2) publication year; 3) age; 4) female proportion; 5) MMSE score; 6) years of education; 7) participants with hippocampal volume measurements; 8) MRI type.
Risk assessment of publication bias
When evaluating the risk of bias in clinical randomized controlled trials, we used the assessment tool recommended by the Cochrane Handbook. Specifically, we evaluated the following aspects: 1) whether random methods were used and if these random methods were applied correctly; 2) whether allocation concealment methods were implemented correctly; 3) whether each participant or operator correctly adopted blinding; 4) whether the result data was complete; 5) whether there was selective reporting of research findings; 6) other potential sources of bias. We conducted a biased risk assessment independently with two assessors and cross-checked the results. If there are differences, discussions should be held to resolve the issue, or a third-party evaluator should decide.
Statistical methods
Meta-analysis was performed on the collected data using the “meta” package in R software. For continuous variables, the standardized mean difference (SMD) is used as the effect measure and is represented with a 95% confidence interval (CI). We used the chi-squared test to analyze the heterogeneity among the included studies and combined it with the I2 statistic to evaluate the magnitude of heterogeneity. Heterogeneity is significant if I2 is greater than or equal to 50%. To assess the robustness of the results, we conducted a sensitivity analysis using the leave-one-out method. Quantify publication bias using Egger’s test and visualize it with a funnel plot. If the funnel plot is asymmetric, the “trim and fill” method determines whether the asymmetry is due to publication bias. Meta-regression and publication bias analyses were only performed when the number of included studies was greater than 10. Building on a sufficient research foundation, we further analyzed to examine the predictive role of hippocampal volume measurement in converting from MCI to AD. To examine significant differences between groups using MRI feature data, we employed an independent two-sample t-test. We compared F1 scores of different models and calculated t-statistics and p-values. A p-value less than 0.05 was considered statistically significant, indicating a significant difference between the two models [21].
RESULTS
Disease classification result
We compared the performance of three different deep network models, namely InceptionResNetv2, Densenet169, and SEResNet50, for disease classification. These networks were implemented using publicly available code. Table 2 presents a comparison of the classification results for AD versus NC and MCI versus NC using different deep network models. It can be observed that InceptionResNetv2 outperformed Densenet169 and SEResNet50, with an accuracy (ACC) of 86.87% for AD classification and an area under the ROC curve (AUC) of 95.64% (95% confidence interval: 95.49–95.70). For MCI classification, the accuracy (ACC) reached 91.78% with an AUC of 94.08% (95% CI: 93.83–94.32). In the second classification experiment, we evaluated the performance difference of the InceptionResNetv2 model using various patch sizes. The best performance was achieved with a patch size of 512×512, as shown in Table 3, with classification accuracies (ACC) of 81.04% and 91.9% for AD and MCI, respectively, and corresponding AUCs of 87% and 94%.
Comparison of different deep network models on AD versus NC and MCI versus NC classification
aIndicates that when comparing Densenet169, p < 0.05; CI, confidence interval.
Classification results of InceptionResNetv2 model with different patch sizes
aIndicates that when comparing 256×256, p < 0.05; ‘aa\prime indicates that when comparing 256×256, p < 0.01.
The third experiment is to separately test the classification performance of the multi-task deep models InceptionResNetv2, Densenet169, and SEResNet50. Figure 2 shows the classification results ROC curves of the three models for AD, MCI, and NC. The training and testing accuracy of the three algorithm models changes with the increase in training times. The training accuracy of the models gradually improves, and the testing accuracy also increases. The InceptionResNetv2 algorithm model can achieve higher accuracy. It further confirmed that the InceptionResNetv2 model is significantly superior to the Densenet169 and SEResNet50 models regarding disease classification.
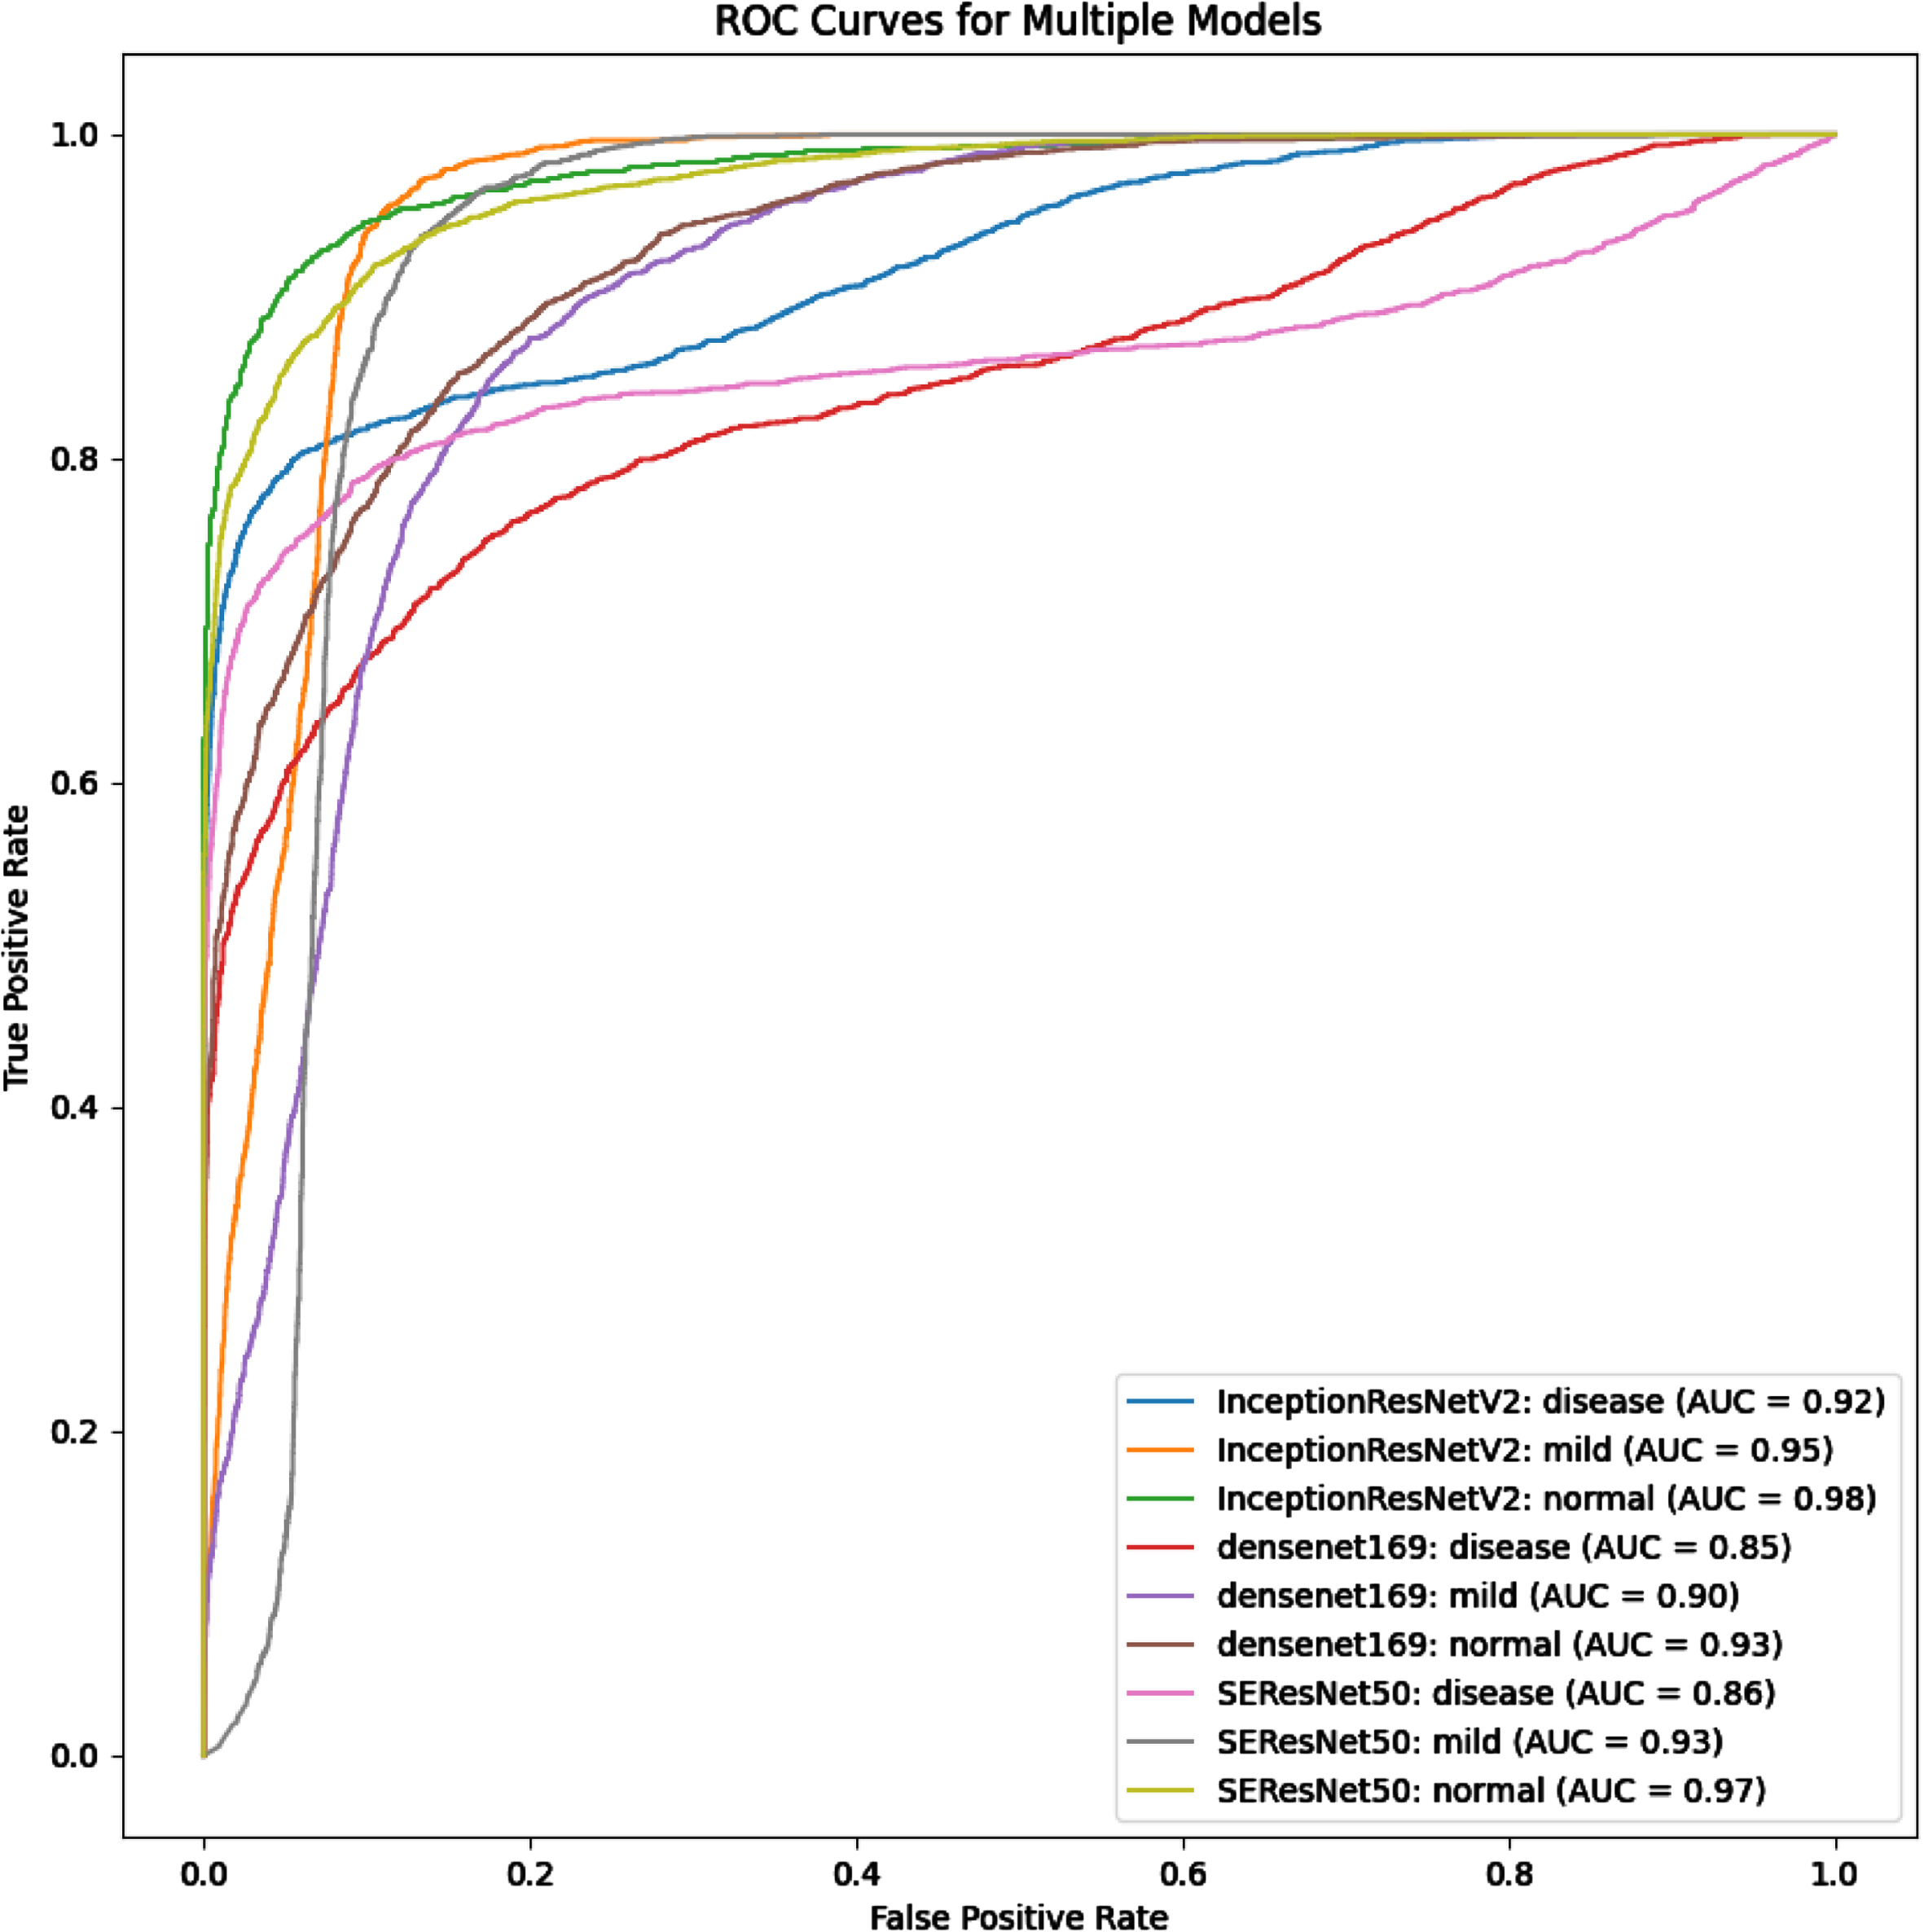
Comparison of ROC curves for different deep neural network models in AD versus NC and MCI versus NC. Alzheimer’s disease, AD; Mild cognitive impairment, MCI; Normal control, NC.
Basic information about the included literature in meta-analysis
Studies have shown that patients with AD exhibit diffuse symmetric atrophy in both cerebral hemispheres, with the volume reduction in the bilateral hippocampus and anterior and posterior cingulate gyri being predominant. Therefore, there is a significant correlation between changes in hippocampal volume and the clinical symptoms of cognitive impairment in AD patients. We further utilized the evidence-based medicine approach to search the PubMed database for literature on the relationship between MRI and cognitive impairment in AD. Data extraction was conducted to assess the accuracy of MRI measurement of hippocampal volume in predicting the onset and progression of AD.
Based on the retrieval method, 1,465 articles were preliminarily screened. After reading the titles and abstracts, 654 papers, including reviews, anecdotes, animal experiments, and non-randomized controlled trials, were excluded, resulting in 811 remaining papers. By reading the full literature texts and excluding articles not meeting the inclusion and exclusion criteria, 23 articles were included in the meta-analysis (Fig. 3).

Literature screening process diagram.
The 23 included studies were conducted in the United States and China, with an average age ranging from 60 to 81 years. The participants were primarily older adults, with female representation varying from 20% to 80%. The average years of education were mainly above 10 years. The MMSE scores for the AD and MCI groups were significantly lower than those of the standard control groups (Supplementary Table 1).
Meta-analysis of MRI measurements of hippocampal volume changes associated with the progression of AD
We included 23 studies in Our study. Among them, 6 studies compared the hippocampal volume changes between MCI and normal control groups, 5 studies compared the hippocampal volume changes between AD and regular control groups, and 2 studies compared the hippocampal volume changes between MCI and AD groups. In addition, 10 studies simultaneously compared the hippocampal volume changes between AD, MCI, and regular control groups. To evaluate the accuracy of MRI measurements in predicting the occurrence and progression of AD, we first conducted a meta-analysis including 15 studies on hippocampal volume changes in AD patients compared to a healthy control group. We initially observed significant statistical heterogeneity among the studies (I2 = 95%, p < 0.01), which led us to use a random effects model. Meta-analysis results showed that the total hippocampal volume measured by MRI in AD patients was lower than that in the control group (SMD = –3.93, 95% CI –5.25 to –2.61, p < 0.01) (Fig. 4A). In addition, we used the trim-and-fill method to draw a funnel plot for assessing publication bias. The results showed that the funnel plot was asymmetrical, indicating a certain amount of publication bias or significant small-study effects in these 15 articles (Fig. 4B).
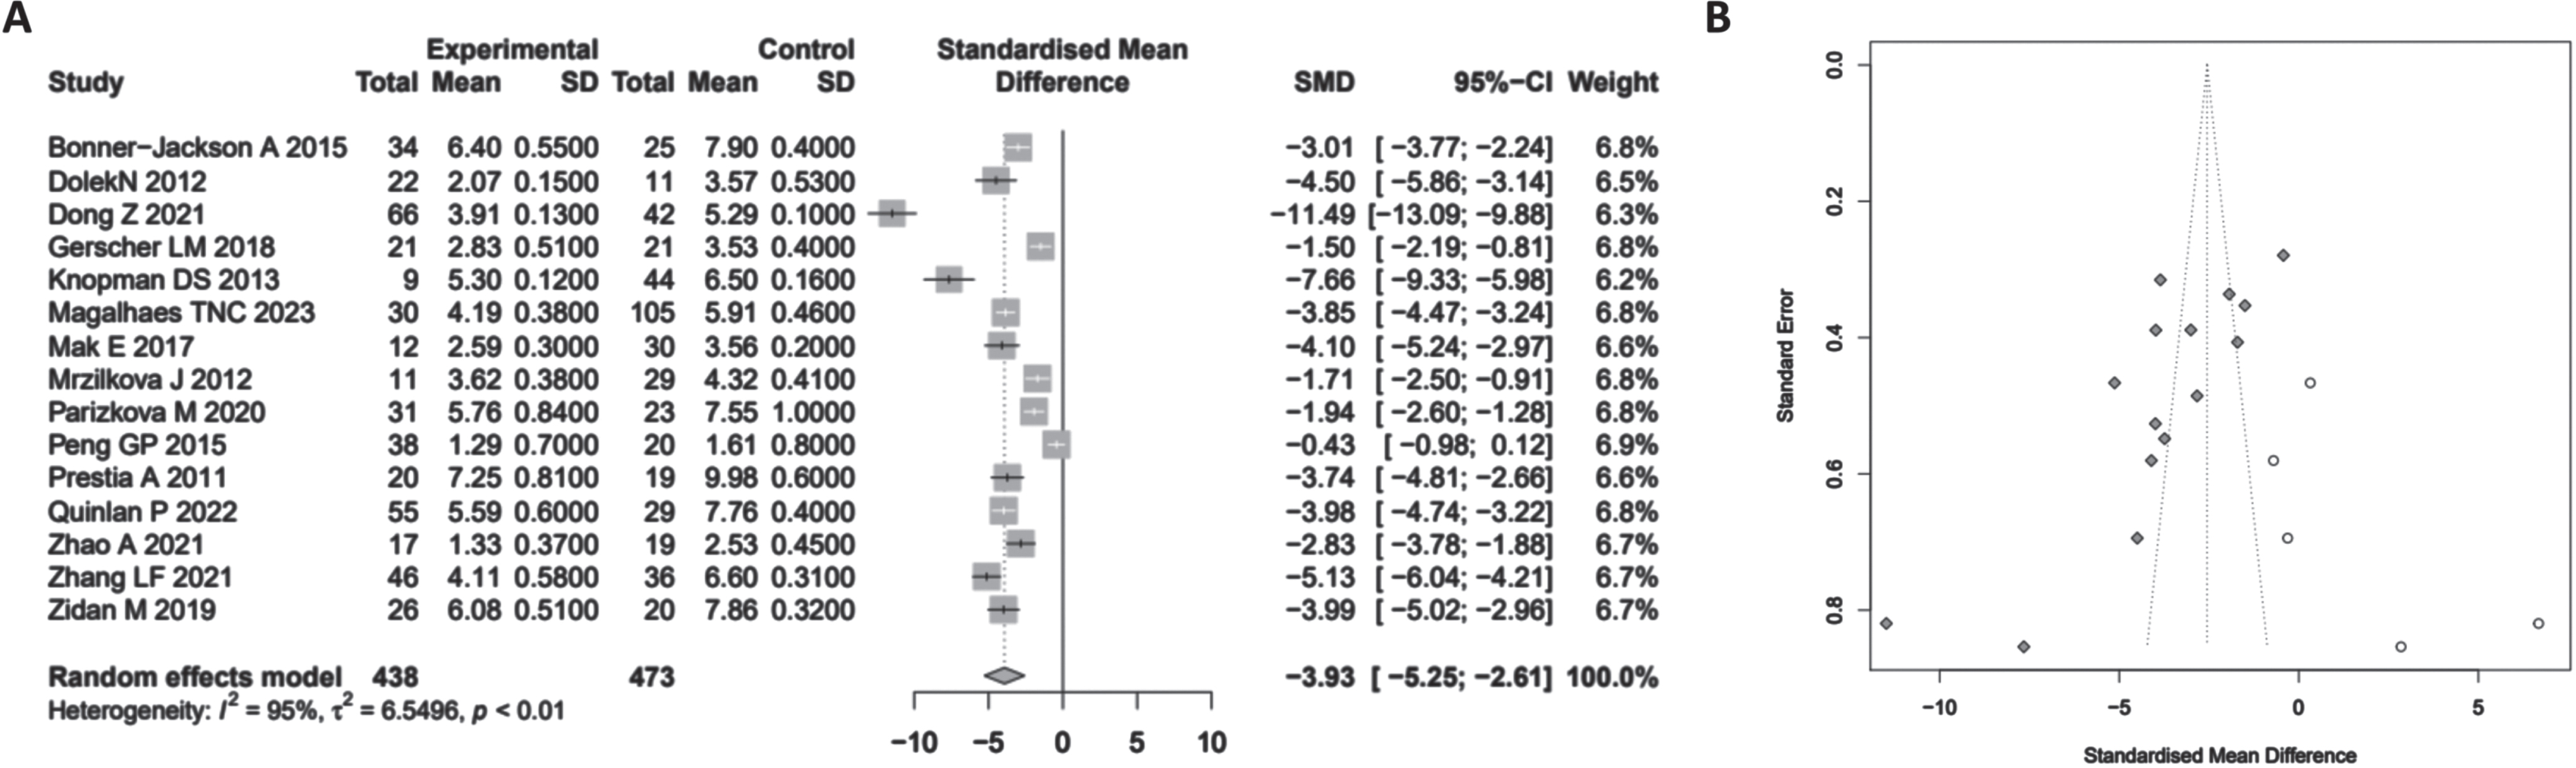
Meta-analysis of MRI measurements of hippocampal volume changes in Alzheimer’s disease. A Forest plot of hippocampal volume changes in AD; B) Funnel plot evaluating publication bias. SMD, standardized mean difference; CI, confidence interval.
In addition, among the 15 studies we included, 9 measured changes in the volume of the left and right hippocampus. We further compared the left and right hippocampus volume changes between patients with AD and the standard control group. The meta-analysis results showed that the volumes of the left and right hippocampus measured by MRI were both lower in AD patients compared to the control group (SMD = –1.99, 95% CI –3.00∼ –0.99, p < 0.01; SMD = –2.02, 95% CI –3.00∼ –1.04, p < 0.01). There was no significant difference in the comparison between the left and right sides (Fig. 5, p = 0.64).

Forest plot showing the volume changes of the left and right hippocampus in patients with Alzheimer’s disease compared to healthy controls, as measured by MRI. CI, confidence interval; L, left; R, right.
AD is a progressive and irreversible neurodegenerative disease, and so far, there is no effective medication available for treating AD. Therefore, it is essential to intervene and prevent it in the early or preclinical stages of AD; for example, intervening at MCI can effectively delay AD progression. Therefore, we further divided the 23 literature into AD versus regular control group hippocampal volume comparison, MCI versus standard control group hippocampal volume comparison, and MCI versus AD group hippocampal volume comparison for further investigation. The results showed (Fig. 6) that the total hippocampal volume measured by MRI in AD and MCI patients was lower than that in the standard control group (SMD = –3.93, 95% CI –5.25∼–2.61, p < 0.01, p < 0.01; SMD = –1.11, 95% CI –1.43∼–0.79, p < 0.01). However, one study showed no significant difference in the total hippocampal volume measured by MRI between MCI patients and the standard control group. There are also changes in hippocampal volume between MCI and AD patients, with the total hippocampal volume measured by MRI in AD patients being lower than that in MCI patients (SMD = –1.25, 95% CI –1.73∼–0.78, p < 0.01).

Forest plot of hippocampal total volume changes between AD patients, MCI patients, and healthy controls as measured by MRI. CI, confidence interval; AD, Alzheimer’s disease; HC, healthy control; MCI, mild cognitive impairment.
DISCUSSION
Structural MRI is widely employed in the early diagnosis of AD due to its non-invasiveness and widespread availability. In recent years, with the advancement of scientific technology, a large amount of medical image data combined with machine learning has been utilized for AD classification prediction [22]. The selection of feature selection algorithms is crucial for disease prediction. Common approaches in AD imaging studies for dimensionality reduction include principal component analysis and partial least squares [23]. Various classification models such as support vector machine (SVM), logistic regression (LR), and random forest (RF) have been employed to validate and evaluate the extracted features for their classification performance [24–26]. These studies have demonstrated the clinical utility of disease classification techniques based on structural information. However, the high dimensionality of raw MRI images, subtle structural changes in early AD stages, and limitations in sample size restrain the development of early assessment and diagnosis of AD. Moreover, the variation in experimental conditions has resulted in diverse research findings, making it challenging to establish efficient and accurate algorithms for clinical application.
Furthermore, Chen et al. [27] utilized multiple patch-level and subject-level subnetworks to extract slice-level and global structural features from sMRI, disregarding complex spatial information. Liu et al. [17, 25] proposed a joint learning multi-task network for hippocampal segmentation and subsequent feature extraction for classification. This manual extraction of regional features reduces the number of learnable parameters in the network but overlooks global information, such as subtle brain atrophy throughout the entire brain. Our study employed three deep learning prediction models, InceptionResNetv2, Densenet169, and SEResNet50 deep learning prediction models, to classify NC, MCI, and AD, achieving higher accuracy. By comparing the three deep learning frameworks, we found that InceptionResNetv2 outperformed Densenet169 and SEResNet50 in both AD and NC classification tasks, with an accuracy of 86.87% and an AUC of 92% for AD classification and an accuracy of 91.78% and an AUC of 95% for MCI classification. These results strongly indicate the immense potential of deep learning techniques in MRI image processing and AD prediction.
Compared to existing research [28], our findings further highlight the importance of MRI measurements of hippocampal volume in predicting AD and demonstrate the tremendous potential of artificial intelligence technology in the early diagnosis of AD. Previous studies have primarily relied on manual analysis of MRI images and statistical methods to assess the relationship between hippocampal volume and AD development, but this approach is time-consuming and may introduce human errors [29–32]. Our study utilizes artificial intelligence techniques intense learning, to automatically extract and learn features from many MRI images, significantly improving analysis efficiency and accuracy. This study also contributes to improving AD classification, which can benefit existing innovation and technology transfer literature in the real world and biotechnology research.
The artificial intelligence deep learning framework and evidence-based medicine meta-analysis methods used in this study have unique strengths and limitations. Deep learning techniques can automatically and efficiently process large amounts of medical imaging data, extracting valuable features and then applying these features for disease diagnosis and prediction. It has significant advantages for analyzing and processing large-scale medical imaging data [33–35]. However, training deep learning models requires a large amount of annotated data, and the interpretability of the models could be better, which may limit their application in clinical practice [36–38]. The evidence-based medicine meta-analysis method can improve the effectiveness of research, accurately assess the predictive effects, and contribute to a deeper understanding and resolution of complex medical issues [39]. However, the results of meta-analysis may be influenced by factors such as study quality, study design, data extraction, and processing. Therefore, they should be interpreted and applied cautiously [40].
If MRI measurement of hippocampal volume can accurately predict the occurrence and progression of AD, it would significantly impact the early diagnosis and prevention of AD [41]. Early diagnosis and treatment are crucial to preventing further deterioration of AD. Our study findings provide important references for clinical practice and contribute to the early diagnosis and personalized treatment of AD. In addition, artificial intelligence deep learning techniques and evidence-based medicine Meta-analysis methods can also be applied to similar medical problems, such as predicting and diagnosing other types of neurodegenerative diseases, with broad application value [42].
In conclusion, this study using artificial intelligence deep learning models and meta-analytic methods of evidence-based medicine verifies that measuring hippocampal volume through MRI can effectively predict the occurrence and progression of AD. Among multiple deep learning framework models, InceptionResNetv2 performs the best, with a classification accuracy of up to 99.75% in AD and NC classification tasks and an area under the ROC curve of 100%. The accuracy of MCI and NC classification tasks is 99.16%, with an AUC of 100%. The research findings indicate that the total hippocampal volume measured by MRI is lower in patients with AD and MCI compared to the standard control group. The total hippocampal volume is lower in AD patients than in MCI patients, and both the left and right hippocampal volumes are lower in AD patients than in the standard control group. These findings indicate that the hippocampal volume changes measured by MRI can serve as important indicators for predicting the occurrence and progression of AD.
The scientific value of this study lies in the first systematic use of deep learning techniques and meta-analysis methods in evidence-based medicine, revealing the value of MRI measurements of hippocampal volume in predicting the occurrence and development of AD. This study not only provides new ideas for the early diagnosis and prevention of AD but also opens up new possibilities for applying artificial intelligence technology in neuroscience. In clinical practice, this approach helps achieve early detection and intervention of AD, thus preventing or delaying its progression.
However, this study also has some limitations. First, all the data are from the ADNI and OASIS-brains databases, which may have sample selection bias. Secondly, this study primarily relies on deep learning models for predicting hippocampal volume. Still, this approach may be influenced by the training and optimization of the models, and further validation is needed to assess its stability and reproducibility. Finally, despite the analysis using a large amount of data, more comprehensive and in-depth research is needed to support this finding due to AD being a complex neurodegenerative disorder that multiple factors may influence.
Despite the abovementioned limitations, this study still provides new methods and ideas for predicting and diagnosing AD. Future research can further improve and optimize deep learning models to enhance the accuracy and reliability of predictions. In addition, it is also possible to increase the sample size and consider more factors that may affect the onset of AD to obtain a more comprehensive and accurate prediction. In conclusion, the findings of this study provide new possibilities for the early prevention and treatment of AD, offering valuable references for clinical practice and research.
Footnotes
ACKNOWLEDGMENTS
The artificial intelligence deep learning MRI data used in this study were obtained from the Alzheimer’s Disease Neuroimaging Initiative (ADNI) database (![]() ) and the OASIS database.
) and the OASIS database.
Data collection and sharing for this project was funded by the Alzheimer’s Disease Neuroimaging Initiative (ADNI) (National Institutes of Health Grant U01 AG024904) and DOD ADNI (Department of Defense award number W81XWH-12-2-0012). ADNI is funded by the National Institute on Aging, the National Institute of Biomedical Imaging and Bioengineering, and through generous contributions from the following: AbbVie, Alzheimer’s Association; Alzheimer’s Drug Discovery Foundation; Araclon Biotech; BioClinica, Inc.; Biogen; Bristol-Myers Squibb Company; CereSpir, Inc.; Cogstate; Eisai Inc.; Elan Pharmaceuticals, Inc.; Eli Lilly and Company; EuroImmun; F. Hoffmann-La Roche Ltd and its affiliated company Genentech, Inc.; Fujirebio; GE Healthcare; IXICO Ltd.; Janssen Alzheimer Immunotherapy Research & Development, LLC.; Johnson & Johnson Pharmaceutical Research & Development LLC.; Lumosity; Lundbeck; Merck & Co., Inc.; Meso Scale Diagnostics, LLC.; NeuroRx Research; Neurotrack Technologies; Novartis Pharmaceuticals Corporation; Pfizer Inc.; Piramal Imaging; Servier; Takeda Pharmaceutical Company; and Transition Therapeutics. The Canadian Institutes of Health Research is providing funds to support ADNI clinical sites in Canada. Private sector contributions are facilitated by the Foundation for the National Institutes of Health (![]() ). The grantee organization is the Northern California Institute for Research and Education, and the study is coordinated by the Alzheimer’s Therapeutic Research Institute at the University of Southern California. ADNI data are disseminated by the Laboratory for Neuro Imaging at the University of Southern California.
). The grantee organization is the Northern California Institute for Research and Education, and the study is coordinated by the Alzheimer’s Therapeutic Research Institute at the University of Southern California. ADNI data are disseminated by the Laboratory for Neuro Imaging at the University of Southern California.
FUNDING
This study was supported by Lianyungang aging health research project in 2021 (L202108).
CONFLICT OF INTEREST
The authors have no conflict of interest to report.
DATA AVAILABILITY
The datasets generated and/or analyzed during the current study are available in the manuscript and supplementary materials.