
Abstract
Background:
Neuropsychiatric symptoms (NPS) are a common aspect of Alzheimer’s disease (AD). Multiple studies have investigated its brain correlates, but it still remains unclear how they relate with brain atrophy in mild cognitive impairment (MCI).
Objective:
Our objective was to investigate brain volume in MCI patients as a function of NPS.
Methods:
We measured grey matter volume, neuropsychological status and NPS (Neuropsychiatric Inventory, NPI), in a sample of 81 MCI patients (43 females). Participants were divided in groups depending on presence (NPS+) or absence (NPS–) of NPS and on type of NPS.
Results:
We found lower volume of left temporal pole in patients with depression compared to NPS– (p = 0.012), and in patients with agitation compared to NPS– in the right middle occipital gyrus (p = 0.003). We also found a significant correlation between volume of left temporal pole and MMSE (r (78) = 0.232, p = 0.019). Finally, NPS+ presented lower cross-sectional cognitive level than NPS– (t (79) = 1.79, p = 0.038), and faster cognitive decline (t (48) = –1.74, p = 0.044).
Conclusions:
Our results support the colocalization of structural damage as a possible mechanism underlying the relationship between MCI and depression and provide novel evidence regarding agitation. Moreover, our longitudinal evidence highlights the relevance of an adequate identification of NPS in MCI patients to identify those at risk of faster cognitive decline.
Keywords
INTRODUCTION
Alzheimer’s disease (AD) is a progressive neurological disorder characterized by the accumulation of abnormal protein deposits in the brain, including amyloid plaques and tau tangles, which lead to the degeneration and death of brain cells. This pathological process results in a gradual decline in memory and other cognitive abilities, ultimately impairing a person’s ability to carry out daily tasks. The progressive nature of AD has led to its conceptualization as a continuum, typically divided into three clinical stages: cognitively unimpaired, mild cognitive impairment (MCI), and dementia. Usually, the diagnosis of AD is based on clinical criteria [1] and involves the dementia phase of the AD continuum (i.e., dementia due to AD; henceforth referred to as AD dementia). Nevertheless, recent diagnostic criteria based on biomarkers have emerged, suggesting that the presence of amyloid-β deposition and pathologic tau would be enough to define AD as a pathology [2]. However, this perspective has been challenged by other researchers who propose that an AD diagnosis should be restricted to individuals exhibiting both biomarkers and an ADphenotype [3].
Neuropsychiatric symptoms (NPS) are increasingly identified as a common aspect of MCI and AD. Frequency of NPS is reported to be more than 80% in AD dementia [4] and 35–85% in MCI [5–7]. Specifically, depression seems to be the most common NPS in MCI [6], and apathy in AD [6, 8]. Anxiety [9], irritability and apathy [10], hyperactivity and mood symptoms [11], and apathy and depression [12] have all been found to be predictors of conversion to AD dementia, with depression also being associated to higher rates of conversion [13], severity of longitudinal cognitive decline [14], and faster progression [14–17]. The relationship between NPS and AD dementia has recently become so evident and relevant that a new diagnostic construct emerged, i.e., mild behavioral impairment (MBI), with diagnostic criteria focused on the presentation of NPS—not necessarily associated to cognitive impairment—and aimed at identifying patients at risk of developing dementia [18]. MBI has been proposed as a non-cognitive marker of neurodegenerative disease with a potential role in early identification and prognosis [19]. However, the use of MBI as a diagnostic entity is currently limited to the research field, and further studies are still needed to determine its applicability in the clinical setting. Several studies have attempted to elucidate the mechanisms behind the relationship between NPS and AD by investigating its brain correlates. A review found that the majority of investigations showed an association between frontal lobe structural and/or metabolic changes and the most common NPS in AD dementia (e.g., delusions, apathy, depression), especially in the anterior cingulate cortex, but also including other brain areas such as the insula, temporal, subcortical, and parietal regions [4]. More recently, a systematic review based on lesion studies proposed three brain circuits for apathy, depression, and anxiety [20]. Specifically, they propose the anterior cingulate-subcortical circuit for apathy, the frontal-limbic circuit for depression, extending to the insula and temporal lobe, and the amygdala circuit for anxiety, also involving thalamus, hippocampus, and midcingulate and orbitofrontal cortices. Most of that research is based on individuals with dementia or mixed samples of dementia and MCI individuals. However, previous structural MRI studies have shown different results for MCI and AD dementia, such as different associations between depression and thickness of the banks of the left superior temporal sulcus—positive in MCI and negative in AD dementia [21]—and a longitudinal relationship between agitation/aggression and atrophy in different frontolimbic regions of the salience network [22]. Thus, it is still unclear how NPS relate with brain atrophy across the AD continuum, especially in stages before dementia. Other studies have provided evidence exclusively based on MCI patients. Two studies using the Alzheimer’s Disease Neuroimaging Initiative (ADNI) database related depression in MCI with reduced volume in bilateral fusiform gyrus [23] and entorhinal cortex [24]. Furthermore, depression was associated with accelerated cortical atrophy in the anterior cingulate cortex [24]. Another study using this database found that anxiety in MCI was related with conversion to AD and with increased rate of atrophy within the entorhinal cortex [9]. However, another study using ADNI found no associations of apathy and hallucinations with brain atrophy in MCI individuals that progressed to AD [25]. Studies using alternative samples to ADNI are scarce. A pilot study investigated patients suffering from late-life depression, and amnestic MCI patients with and without depressive symptomatology (6 participants per group), as measured by the Geriatric Depression Scale, and focusing on hippocampal and entorhinal cortex volumes [26]. They found larger hippocampus in patients with depression, and slightly lower entorhinal volumes in amnestic MCI patients with depressive symptoms compared to the other groups, although these results were descriptive and not statistically significant using inferential tests. Another study used voxel-based morphometry to compare healthy controls, cognitively normal participants with late-life depression, non-depressed amnestic MCI patients and MCI with depressive symptoms, using a clinically significant depression on the Structured Clinical Interview of DSM-IV as criterion for inclusion to the depression groups [27]. They found interaction effects between depression and MCI in volumes of multiple brain areas, such as cuneus, cingulate, amygdala/hippocampus, and prefrontal cortices. The authors argue that these regions are early targets of AD neuropathology, and suggest that the co-existence of depressive symptomatology and amnestic MCI might be a potential marker of AD. Finally, some studies have explored the relationship between NPS as measured by the Neuropsychiatric Inventory (NPI) [28], dividing them in subgroups with relative consistency [29,30, 29,30]. A recent investigation tried to overcome the limitations of previous studies, such as the lack of inclusion of MCI and AD patients of varying severity, and used a large sample of MCI and AD dementia patients to identify three subgroups of NPS, which corresponded to “depression”, “agitation”, and “psychosis” [6]. However, the possible neural signatures of these factors have not been investigatedyet.
The main aim of our study was to investigate grey matter (GM) patterns in MCI patients as a function of NPS. Following up on previous evidence [22–24, 26], we hypothesized that patients with depressive symptoms would show lower GM volumes in temporal regions, including hippocampus, entorhinal cortex, superior temporal cortex, and fusiform gyri, and that patients with agitation symptoms would present lower volume in frontolimbic regions such as amygdala, anterior and posterior cingulate gyri, insula, middle frontal cortex, medial orbitofrontal cortex and superior frontal gyri. Furthermore, we also explored the relationship between NPS and cognitive decline. We expected that cross-sectionally, patients with any NPS would present lower cognitive level than those without NPS, and longitudinally, they would show faster cognitive decline, following up on previous evidence [14, 31]. Moreover, we expected to find a relationship between volume in regions related to presence of NPS in our results and cognitivelevel.
METHODS
Participants
The study included 81 amnestic MCI patients, all born in Spain and recruited from dementia units of the Valencian community public healthcare system after the first clinical appointment in which they expressed subjective memory complaints. MCI diagnose was determined by experienced neurologists, based on clinical and neuropsychological evidence. More details on recruitment protocol, medication, and inclusion and exclusion criteria can be found in the Supplementary Material.
Neuropsychological measurements
All participants were administered a neuropsychological assessment, which included a short form of the Boston Naming Test [32], a short-term and long-term Word List Recall test (WLRT), two fluency tests (semantic and phonetic), a remote memory test, and the clock drawing test [33]. Results of these measures were transformed into z-scores and averaged, in order to obtain a composite measure of the global cognitive level. Participants also completed the Mini-Mental State Examination (MMSE) [34] and the Functional Activities Questionnaire (FAQ) [35].
Neuropsychiatric measurements
Neuropsychiatric status was measured using the NPI [28], which is one of the most used instruments to evaluate NPS in dementia. It consists of an informant-based interview that evaluates the frequency and severity of 12 neuropsychiatric disturbances common in AD. It has been translated to more than 40 languages, including European Spanish [36], and has shown good validity and reliability [37]. NPI scores were combined into different factors. We did not conduct a factor analysis in this study, but instead used symptom groups as found in the factorial structure reported in Siafarikas et al. (2018) [6]. We multiplied frequency and severity scores of each symptom, and then these scores were summed up by factors. Factor 1 contained depression, anxiety, disturbances in appetite, apathy, motor disturbance, night-time disturbance; factor 2 included euphoria, disinhibition, irritability, and agitation; and factor 3 contained hallucinations and delusions. Therefore, factor 1 was labelled as “depression”, factor 2 as “agitation” and factor 3 as “psychosis”. We divided our sample in groups based on this factorial structure, including a group of participants without NPS (NPS–).
MRI acquisition
MRI data acquisition was performed on a 3T MRI scanner (Siemens Magnetom Trio, Erlangen, Germany) using a 12-channel head coil. Participants were placed inside the scanner in the supine position, and their heads were immobilized with cushions. Whole-brain 3D images were collected using sagittal T1-weighted images (MPRAGE sequence, 176 slices, 256×256 matrix, TR = 2300 ms, TE = 2.98 ms, flip angle = 9°, spatial resolution 1×1×1 mm).
Image preprocessing and statistical analyses
Image preprocessing was performed using CAT12 (Computational Anatomy Toolbox; C. Gaser, Jena University Hospital, Jena, Germany; http://dbm.neuro.uni-jena.de/cat/) as implemented in SPM12 (Statistical Parametric Mapping 12; Wellcome Trust Centre for Neuroimaging, University College, London, UK; http://www.fil.ion.ucl.ac.uk/spm/). Before data processing, a first quality check was conducted to detect images affected by important inhomogeneity or movement artifacts. Then, standard CAT12 preprocessing for voxel-based morphometry and region of interest (ROI) analysis was performed. For voxel-based morphometry, the preprocessing steps were: 1) spatial adaptive non-local means (SANLM) denoising; 2) bias correction and affine registration; 3) segmentation of the images into GM, white matter (WM), and cerebrospinal fluid (CSF); 4) registration to a standard template provided by the International Consortium of Brain Mapping (ICBM); 5) DARTEL normalization to the Montreal Neurological Institute (MNI) template; and 6) modulation by the “affine + nonlinear” components derived from spatial normalization. After these steps, the total intracranial volume (TIV) was estimated as the sum of the GM, WM, and CSF volumes to correct for different head sizes and volumes across participants. Finally, brain images were spatially smoothed using an 8 mm full width at half maximum Gaussian kernel. For ROI analysis, the Neuromorphometrics atlas was used (http://www.neuromorphometrics.com/) as reference. This atlas was transformed to the native space of each participant and the sum of the local GM inside the atlas’ pre-defined ROIs was estimated. Based on our a priori hypothesis, this analysis was focused on the following ROIs of both hemispheres: hippocampus, entorhinal, fusiform and superior temporal gyri, amygdala, anterior and posterior cingulate gyri, insula, middle frontal, medial orbitofrontal and superior frontal gyri.
Statistical analyses involved group comparisons between the NPS- group and each factorial derived group. To test for ROI volume differences, SPSS Statistics v28 (IBM Corp.) was used. Specifically, General linear models were performed with regional volumes as dependent variable, group as fixed factor, and TIV, age and score in the other factor as covariates of no interest. SPM12 package was used to test for voxel-wise anatomical differences related with NPS. Specifically, lineal models similar to the one previously described were performed to study volumetric differences between NPS– and each factorial derived group at the whole-brain. Statistical significance was determined combining an uncorrected voxel-level threshold of p < 0.001 with a family-wise error (FWE) rate corrected cluster-level threshold of p < 0.05.
Finally, we carried out post-hoc correlations in SPSS to explore the relationship between GM in regions that showed to be relevant for neuropsychiatric status and cognitive level (neuropsychological measures), including TIV as a covariate of no interest.
Longitudinal follow-up
53 participants (19 males and 26 females) participated in a follow-up carried out between 6 and 12 months after the initial examination (mean = 7.12, SD = 1.757). MRI images were obtained using the same sequence that was used for cross-sectional MRI acquisition, previously described in the MRI acquisition section. Participants also underwent a follow-up neuropsychological examination, identical to the one described in the Neuropsychological measurements section, allowing for acquisition of a second composite measure of their global cognitive level. We carried out between-groups comparisons using a repeated measures models, with 1) neuropsychological scores as dependent variables, time as within-subject factor and group as between-subject factor, and 2) GM volumes as dependent variables, TIV and score in the other factor as covariates, time as a within-subject factor, and group as a between-subject factor. 3 participants did not complete the second MRI session and another 3 did not complete the second neuropsychological examination, so statistical analyses involved 50 participantseach.
RESULTS
Cross-sectional NPS and neuropsychological measurements
Twenty-four of the MCI patients presented no NPS (NPS–), while 57 did present symptoms (NPS+). Thus, the criterion for assignation to one group or the other was based on presence or absence of any NPS. We found no significant differences between the groups in age, sex, or most of the neuropsychological measures, but we did find significant differences between the groups in long- and short-term WLRT, and in global cognitive level (Table 1). Forty-six patients presented symptoms belonging to the first factor (NPS depression; mean score = 4,22; range = 1–18; SD = 4,10), and 38 to the second (NPS agitation; mean score = 2,13; range = 1–6; SD = 1,58). Nineteen participants presented symptoms exclusively of the first factor, 11 of the second, and 27 of both the first and second. Only one participant presented psychotic symptomatology (third factor), with the lowest score possible (only one symptom with mild severity), so we did not consider this as a potentially relevant confounding factor for our analyses and third factor was not analyzed. Patients were assigned to the depression subgroup if they presented any NPS belonging to the first factor, and to the agitation subgroup if they presented any NPS of the second factor.
Demographic, clinical, and neuropsychological data of all participants. Significant differences between groups appear in bold
Mean and standard deviation (in parentheses) are shown for quantitative variables. NPS–, participants that presented no neuropsychiatric symptoms; NPS+, participants that did present neuropsychiatric symptoms; N, number of participants in the group; M/F, males/females; MMSE, Mini-Mental State Examination; FAQ, Functional Activities Questionnaire; WLRT, Word List and Recall Test. *Undirected tests.
NPS– showed significantly higher scores in the short- and long-term WLRT and a higher global cognitive level than NPS+ (see Table 1). Moreover, we found significant differences between NPS– and NPS depression groups in short (F (1,67) = 4,20; p = 0.044) and long-term WLRT (F (1,67) = 5.43; p = 0.23; see Supplementary Table 1). No other significant differences were found between the groups in any of the neuropsychological measurements.
Cross-sectional ROI and whole-brain voxel-based analyses
We found no significant differences between the groups in any of the ROIs (see Supplementary Table 2 for details). However, we did find significant differences in the whole-brain voxel-based analysis between the NPS– and NPS depression groups in volume of the left temporal pole (p = 0.012, cluster FWE-corrected, cluster size = 1451 voxels, Brodmann area 38; see Fig. 1). The MNI coordinates for the voxel with the maximum difference were x = –50, y = 15, and z = –15. NPS– and NPS agitation groups also presented significant differences in the occipitotemporal junction (p = 0.003, cluster FWE-corrected, cluster size = 1996 voxels, Brodmann areas 19, 39 and 37; see Fig. 1), with the maximum peak in the right middle occipital gyrus (MNI coordinates: x = 34, y = –78, z = 30).
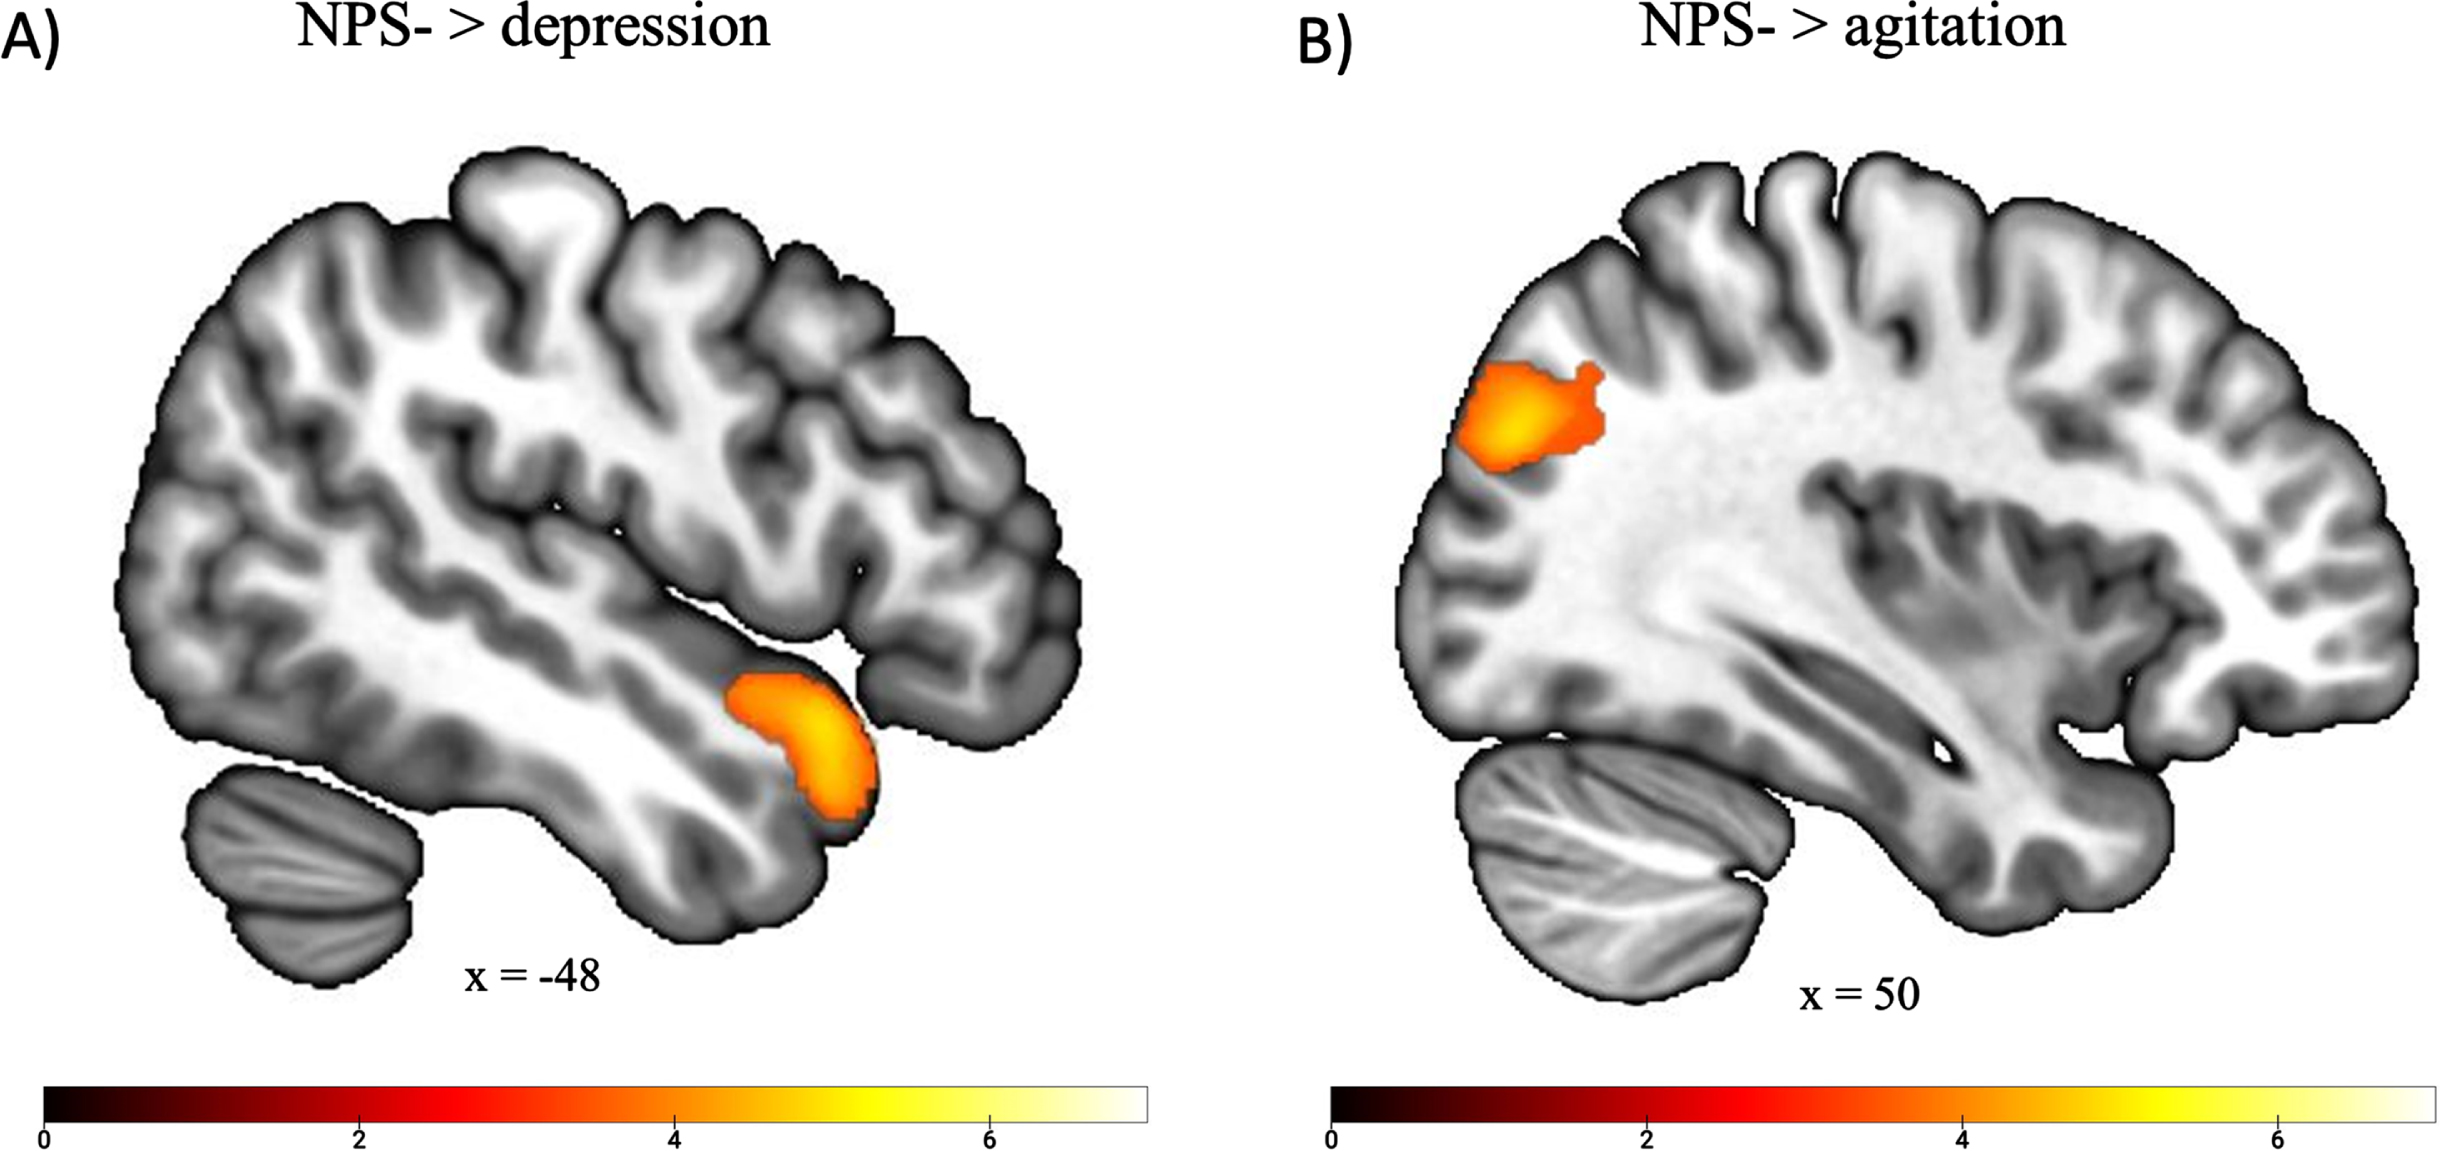
Clusters of significant differences between the groups (p < 0.05 FWE-corrected at cluster level, with a threshold of p < 0.001 at the uncorrected voxel level). A) patients without NPS versus patients with depressive symptoms; B) patients without NPS versus agitation symptoms.
Furthermore, we found a significant correlation between GM in the left temporal pole and MMSE in all our participants (r (78) = 0.232, p = 0.019). We found no further significant correlations in any other of the measures or in groups separately.
Longitudinal follow-up
Of the longitudinal sample, 15 participants did not present NPS (NPS–), while 36 did (31 with depression and 23 with agitation). We found no longitudinal differences between NPS– and NPS+, or between NPS– and depression or agitation groups, neither in regional nor in whole-brain volumes. However, we found a significant interaction between group and time’s effect on global cognitive level, with a faster global cognitive decline in NPS+compared to NPS– (t (48) = –1.74, p = 0.044; Fig. 2). Two outliers were identified in the NPS– group for global cognitive level in the follow-up assessment (time 2). The interaction between group and time’s effect on global cognitive level remained significant when the two outliers were excluded from the analysis (t (46) = –2.83, p = 0.003). When testing specific neuropsychological measures, we found a significant interaction between group and time on semantic fluency (t (48) = –2.25, p = 0.015; Supplementary Fig. 1). One outlier was identified in the NPS– group for semantic fluency both in the baseline and follow-up assessments, but the interaction between group and time’s effect on semantic fluency remained significant when this participant was excluded from the analysis (t (47) = 2.18, p = 0.017).

Mean and standard error bars for global cognitive level at first and second neuropsychological assessment for NPS– and NPS+.
DISCUSSION
In this study, we investigated the association between NPS and brain regional GM volumes in a sample of amnestic MCI patients. We divided our sample in patients who did (NPS+) or did not (NPS–) show NPS. NPS+ were further subdivided in depression and agitation groups following a recent investigation [6]. We compared brain volumes between the groups and found significant differences between NPS– and NPS depression in GM volume of left temporal pole, and between NPS– and NPS agitation in the right middle occipital gyrus. We also found a significant correlation between volume of the left temporal pole and MMSE in all participants. Finally, patients with any NPS presented lower cross-sectional global cognitive level than NPS–, and faster longitudinal cognitive decline. Thus, NPS may be considered an indicator of faster cognitive decline and a crucial factor to understand GM volume alterations in MCI.
Our first hypothesis was that the depression group would show lower GM volumes than NPS– in hippocampus, parahippocampus, entorhinal and superior temporal and fusiform gyri, as previous evidence had shown [21, 27]. Our ROI analyses did not show significant differences in those brain regions, but in our whole brain analyses, we did find lower GM volumes in the left superior temporal pole in the NPS depression group compared to the NPS–. This result goes in line with previous studies in samples that mixed MCI and AD dementia that found negative correlations between NPI-Q depression and GM volume of the left temporal pole [38], and a negative correlation between thickness of left temporal pole and the Modified Apathy Estimation Scale score [39]. Our results also correspond to the recently proposed circuit for depression in AD dementia and MCI, that includes the temporal pole area [20]. Crucially, high conceptual overgeneralization and emotional intensity are related to lower anterior temporal lobe connectivity during guilt processing in major depressive disorder [40]. Moreover, this region has been shown to be useful for blame-rebalance neurofeedback interventions [41]. Therefore, our result further strengthens the relationship between left temporal pole atrophy and depression in AD dementia and MCI.
We also hypothesized that MCI individuals with agitation NPS would present lower volume than NPS– in frontolimbic regions. Specifically, we expected to find differences in amygdala, anterior and posterior cingulate gyri, insula, middle frontal, medial orbitofrontal and superior frontal gyri, following up on a previous study [22]. However, our ROI analyses showed no significant differences in these brain areas. We only found significant differences between NPS– and NPS agitation groups in our whole brain analysis, in volume of the right middle occipital gyrus. The scarcity of previous literature investigating the effects of agitation on brain volumes in MCI patients, with only one study that found a relationship between agitation and aggression and greater atrophy in frontolimbic regions [22], makes our interpretation tentative but also provides special relevance and novelty to our results. Right hemisphere abnormalities are commonly associated with disinhibition and irritability [4], and although occipital abnormalities in AD have been most commonly found in the presence of hallucinations and delusions [20], they have also been associated to acute agitation in other populations [42]. Moreover, occipital bending – a brain defect where one of the occipital lobes crosses the antero-posterior axis - has been shown to be more prevalent in schizophrenia patients, who frequently show not only delusions and hallucinations, but also agitation [43]. Thus, our results suggest that a region typically associated to NPS of the psychosis subtype in AD might also be relevant for agitation in MCI.
Regarding neuropsychological scores, we hypothesized that NPS+ would show both lower cross-sectional global cognitive level and faster global cognitive decline than NPS–, and that we would find a relationship between atrophy in regions that were significantly different between groups and cognitive level. All hypotheses were confirmed. First, NPS+, in average, showed lower global cognitive score than NPS–. When investigating neuropsychological measures separately, we found NPS– showed better short- and long-term memory than NPS+, which seems to be the source of global cognitive level differences between the groups. Second, NPS+also showed faster longitudinal cognitive decline than NPS–, in agreement with previous evidence [14, 31], suggesting that co-existence of NPS and amnestic MCI might be a potential marker of faster longitudinal cognitive deterioration that leads to AD dementia [27]. However, our low longitudinal sample size, especially in the NPS– group, limits the interpretation our results. In fact, low sample size could also be related to the lack of significant longitudinal brain volume differences between our groups. Thus, these results should be interpreted with caution. Third, we also found a significant positive correlation between GM volume of the left temporal pole, the region that differentiated between NPS– and NPS depression, and MMSE score, which coincides with previous studies that found effects of NPS on MMSE scores [31]. These results go in line with previous evidence showing an association between NPS and severity of cognitive impairment [44]. As for the mechanisms that could be behind this relationship, our results further support the previously formulated hypothesis of colocalization of structural damage [27]—left temporal pole structural abnormalities are a common characteristic of AD [45–47], and a recent meta-analysis showed that patients with major depressive disorder and MCI shared volumetric reductions in a number of regions including the insula, superior temporal gyrus, inferior frontal gyrus, amygdala, hippocampus, and thalamus [48]. Nevertheless, the causality of this association, i.e., if a shared risk factor causes NPS and AD, or one produces another [49], still remains unknown. Alternatively, there could be other factors mediating this relationship. Current evidence on anosognosia suggests that the awareness of cognitive deficits might interact with NPS in AD [50]. In this context, anosognosia has been associated with changes in the occipitotemporal cortex and the temporal pole in AD and frontotemporal dementia, respectively [51, 52]. Moreover, the awareness of cognitive deficits exhibits a negative correlation with both MMSE and episodic memory scores in MCI [53]. Consequently, the potential impact of anosognosia on our study’s findings should not be dismissed. Finally, studies that have found opposite results—no association between depressive symptoms and hippocampal and temporal atrophy in AD—discuss alternative mechanisms that should also be considered, i.e., depressive symptoms driving lower cognitive performance, and producing less need for AD-type pathology in order to reach the same degree of cognitive impairment [54, 55]. Our results, however, are in contrast to that hypothesis.
The pathophysiological mechanisms underlying the development of NPS in AD remain poorly understood. However, there is compelling evidence suggesting that alterations in the monoaminergic system may play a pivotal role in the manifestation of some NPS during the course of AD, including disturbances in appetite, sleep-wake cycle, confusion, agitation, and depression [56]. Moreover, a variety of NPS has been related with the presence of neurofibrillary tangle pathology in the early stages of the disease (Braak stages I and II), suggesting that the accumulation of subcortical neurofibrillary tangles, even with minimal cortical involvement, may be sufficient to trigger the manifestation of NPS [57]. Within this context, it has been postulated that tau pathology in AD may initiate within monoaminergic nuclei (locus coeruleus and dorsal raphe nucleus) before spreading to the transentorhinal/entorhinal cortex and subsequently disseminating into cortical regions [56]. In support of the hypothesis of a monoaminergic degeneration in AD, a recent study revealed that MCI individuals, when compared to matched controls, exhibited reduced serotonin transporter (5-HTT) availability in various cortical and subcortical regions, including the temporal pole and the middle occipital gyrus showed in our study [58]. Thus, the possible neuropathological mechanism underlying our current findings might involve the degeneration of the serotonergic system. This hypothesis should be validated in future studies.
One limitation of our study is the use of a clinical diagnosis of MCI without obtaining biomarker measurements of amyloid-β and tau pathology, which have been recently recommended by the National Institute on Aging and Alzheimer’s Association (NIA-AA) [2]. Nevertheless, the subtype of MCI used in our study (amnestic) is the most associated with progression to AD [59, 60], and a previous study showed that 94.1% of patients with a clinical diagnosis of AD were in the AD-continuum following NIA-AA’s criteria [61]. Based on this evidence, our results might be extrapolated to classifications that use biomarkers. However, this should be confirmed in future studies.
In summary, in this study we explored differences in GM volume in a sample of MCI patients depending on presence of NPS. In agreement with previous evidence, we found that NPS– group showed more volume in the left temporal pole than NPS depression group. NPS– also showed more volume in the right middle occipital gyrus compared to NPS agitation group, which might be related to previous results in healthy elderly samples. We also found a significant correlation between volume of the left temporal pole and MMSE, which supports the coincidence of localization of structural damage as a possible mechanism underlying the relationship between MCI and depression. Finally, NPS+ presented lower cross-sectional global cognitive level than NPS–, and faster longitudinal cognitive decline, further supporting the relationship between NPS and cognitive impairment. The novel evidence we provide in this investigation can help elucidate differences between specific NPS and their effects on the brain, serving as basis for future studies focusing on MCI and AD dementia. Moreover, it could have relevant implications for clinical practice, emphasizing the relevance of an adequate identification of NPS in MCI patients and encouraging follow-ups directed to those at risk of faster cognitive decline.
Footnotes
ACKNOWLEDGMENTS
The authors have no acknowledgments to report.
FUNDING
This work was supported by the project PID2019-105077RJ-I00 funded by the MCIN/AEI /10.13039/501100011033 and by the Ramón y Cajal fellowship (RYC2021-033809-I) funded by MCIN/AEI /10.13039/501100011033 and the NextGenerationEU/PRTR, awarded to VC. LM-M was supported by an FPU grant from the Spanish Ministry of Education, Culture and Sports (FPU 17/00698) and a Marie Curie Postdoctoral Fellowship funded by UKRI (EP/Y014367/1).
CONFLICT OF INTEREST
V.C. is an Associate Editor of this journal but was not involved in the peer-review process nor had access to any information regarding its peer-review. The authors have no other conflict of interest to report.
DATA AVAILABILITY
The data supporting the findings of this study are available on request from the corresponding author. The data are not publicly available due to privacy or ethical restrictions.