
Abstract
Background:
Disturbed metabolism has been proposed as being involved in the pathogenesis of Alzheimer’s disease (AD), and more evidence from human AD brains is required.
Objective:
In this study, we attempted to identify or confirm modulations in the levels of metabolites associated with AD in postmortem AD brains.
Methods:
We performed metabolomics analyses using a gas chromatography mass spectrometry system in postmortem brains of patients with confirmed AD, patients with CERAD score B, and control subjects.
Results:
Impaired phosphorylation of glucose and elevation of several tricarboxylic acid (TCA) metabolites, except citrate, were observed and the degree of impaired phosphorylation and elevation in the levels of the TCA cycle metabolites were negatively and positively correlated, respectively, with the clinical phenotypes of AD. The levels of uronic acid pathway metabolites were modulated in AD and correlated positively with the amyloid-β content. The associations of nucleic acid synthesis and amino acid metabolites with AD depended on the kinds of metabolites; in particular, the contents of ribose 5-phosphate, serine and glycine were negatively correlated, while those of ureidosuccinic acid and indole-3-acetic acid were positively modulated in AD. Comprehensive statistical analyses suggested that alterations in the inositol pathway were most closely associated with AD.
Conclusions:
The present study revealed many novel associations between metabolites and AD, suggesting that some of these might serve as novel potential therapeutic targets for AD.
Keywords
INTRODUCTION
Alzheimer’s disease (AD) is the most prevalent form of dementia worldwide, and there remain substantial unmet needs, particularly in relation to its treatment. Therefore, identification of therapeutic targets for AD, especially based on analyses of human brains, is desired. Recently, we demonstrated dynamic modulations of sphingolipids and glycerophospholipids in the brains of subjects with AD using comprehensive lipidomics techniques [1]. Besides disturbances in lipid homeostasis, numerous studies have suggested overall metabolic impairments in the brains of AD patients [2, 3]. For example, substantial alterations in metabolites of the glucose metabolic pathway, the urea cycle, and amino-acid metabolism have been reported in human brain [4]. Regarding the glucose metabolic pathway, glucose uptake in the brain has been reported to decrease from the early stages of AD [5, 6]. The association of AD with the glycolysis pathway remains controversial; some studies have demonstrated reduced glycolysis in the brains of aged rats [7] and contended that this leads to age-related neurodegeneration [8], whereas other studies have shown increased glycolytic activity in aged human brains [9]. Impaired tricarboxylic acid (TCA) cycle activity, potentially resulting in the accumulation of oxidative stress, has been demonstrated in murine aged or AD brains [10] and also in the brains of AD subjects [11]. Low influx of glucose into the pentose phosphate pathway, which is important for oxidative stress resistance, accelerates the damage induced by oxidative stress. Although it remains uncertain, some studies have suggested impaired activity of the pentose phosphate pathway in AD [12]. With regard to other metabolic pathways involved in AD, involvement of lysine degradation and also fatty acid metabolism [13] and dysregulation of the mitochondrial aspartate metabolism [14] has been demonstrated.
Although these elegant studies suggest the existence of metabolic impairments in the AD brains, there is still insufficient direct evidence of impairments in metabolic pathways, especially based on observation of alterations of the metabolite contents in the brain by comprehensive metabolomics analyses of postmortem human brains. Considering these backgrounds, in the present study, we investigated the modulations in the levels of metabolites in the postmortem brains of patients with confirmed AD, patients with CERAD score B (Cerad-b), which corresponds to intermediate probability of AD [15], and control subjects, in order to understand the involvement of impaired metabolic pathways in the pathogenesis of AD and facilitate future translational research to develop novel treatments targeting the impaired metabolic pathways.
METHODS
Samples
We conducted this study using 19 autopsied cerebral cortex specimens, obtained from 6 AD patients, 7 Cerad-b patients, and 6 normal control subjects who showed no evidence of other central nervous system disorders in Tokyo Metropolitan Geriatric Medical Center. Frozen postmortem cerebral cortex specimens were used for the measurements. All specimens were obtained from the Brain Bank for Aging Research (https://www.tmig.or.jp/eresearch/a23.html). The clinical phenotypes, including the diagnostic group (control, Cerad-b, or AD), senile plaque (SP) score, and Braak tangle stage were evaluated based on histopathological examination of the specimens. The amyloid-β (Aβ) contents were measured using a Human β Amyloid(1-42) ELISA kit (298-62401, WAKO Pure Chemical Industries, Osaka, Japan), and adjusted to the brain protein levels. These samples are the same samples that we used for a previous study by us [1], and the characteristics of the subjects are described in Table 1. Although the postmortem interval tended to be shorter in the control subjects, no significant difference was observed among three groups. The conditions of the brain samples seem not to be quite different, considering that the RNA integrity number (RIN) was not so different among samples. The RIN values are higher than 7, indicating the good quality of the brain tissues.
Characteristics of the subjects
RIN, RNA integrity number; PMI, postmortem interval. The Kruskal-Wallis test, followed by the Steel-Dwass test as a post-hoc test, was used for statistical evaluation of the differences. No significant differences were observed. Average shows mean±SD except sex.
The current cross-sectional study was performed in accordance with the ethical guidelines laid down in the Declaration of Helsinki. Written informed consent was obtained in advance from the brain donors and/or the next of kin. The study design was approved by the Tokyo Metropolitan Geriatric Medical Center and The University of Tokyo Medical Research Center Ethics Committee (2018088NI).
Comprehensive metabolomics analysis using a gas chromatography mass spectrometry (GC-MS) method
The comprehensive metabolomics analyses were performed as described previously [16–18]. In brief, each brain sample was homogenized on ice in PBS and 300μL of each sample was mixed with 10μg of 2-isopropylmalic acid (internal standard) and 700μL of a solvent mixture (MeOH:H2O:CHCl3 2.5 : 1:1), and the solution was shaken at 1200 rpm for 30 min at 37°C and then centrifuged at 16,000×g for 5 min at 4°C. Next, 675μL of the resultant supernatant was transferred to a clean tube, and 600μL of distilled water was added; the solution was further centrifuged at 16,000×g for 5 min at 4°C. Then, 750μL of the resultant supernatant was transferred to a clean tube and lyophilized. For oximation, 80μL of 20-mg/mL methoxyamine hydrochloride (Sigma-Aldrich) dissolved in pyridine was mixed with a lyophilized sample, and the mixture was shaken at 1200 rpm for 90 min at 30°C. Next, 40μL of N-methyl-N-trimethylsilyl-trifluoroacetamide (Sigma-Aldrich) was added for derivatization, and the mixture was incubated at 1200 rpm for 30 min at 37°C. The mixture was then centrifuged at 16,000×g for 5 min, and the resultant supernatant was subjected to measurement using a GC-MS system (QP2020; SHIMAZU). The levels of metabolites were measured using the Smart Metabolite Database (SHIMAZU) and adjusted to the brain protein levels. The protein levels were measured by a colorimetric assay for protein concentration (DC protein assay, 500-0116, Bio-Rad Laboratories, Inc. Hercules, CA).
When we validated this method with murine brains. Both the intra-day and inter-day coefficients of variation for the metabolites were below 20%, as shown in Supplementary Table 1. The animal experiments were conducted in accordance with the guidelines for animal care and with the approval of the Animal Care Committee of the University of Tokyo (P22-046). The intra-day and inter-day coefficients of variation were calculated by measuring the metabolites five times with three brain samples.
Reverse-transcriptase PCR
Total RNA extracted from murine tissues or cells using the GenElute Mammalian Total RNA Miniprep kit was subjected to reverse transcription with the ReverTra Ace qPCR RT Master Mix. Quantitative PCR was performed using an ABI 7300 Real-Time PCR System (Applied Biosystems), using commercially available primers listed in Supplementary Table 2. The expression levels of the genes of interest were normalized to those of the endogenous control 18s mRNA.
Statistical analysis
The data were analyzed using SPSS (Chicago, IL) or MetaboAnalyst 5.0 (https://www.metaboanalyst.ca/). The workflow of the statistical analyses is shown in Supplementary Figure 1. To examine the statistical significances of differences in the levels of the metabolites among the control brains, Cerad-b brains, and AD brains, we used the Kruskal-Wallis test, followed by the Steel-Dwass test as a post-hoc test, using SPSS. For the correlation studies, we used the Kendall rank correlation to examine the associations of the levels of the metabolites with the clinical phenotypes (diagnostic group, SP score, and Braak stage) and the Spearman rank correlation was used to examine the association of the metabolites with the Aβ content, considering age and sex as covariates of interest, using SPSS. The independent effects of the metabolites on the clinical phenotypes (diagnostic group, SP score, Braak stage, and Aβ content) were investigated by a stepwise multiple regression analysis, using these clinical phenotypes as objective variables and the metabolites, age, and sex as possible explanatory factors, using SPSS. The enrichment analysis was performed with MetaboAnalyst 5.0 using the pathway based on SMPDB. A sparse OPLS-DA was performed by MetaboAnalyst using three components to which a maximum of 10 variables can contribute, with the results of the metabolite levels together with the age, sex, SP score, Braak stage, and Aβ content, to explore the characteristics of the three diagnostic groups. To investigate the latent association of the metabolites with AD, we constructed a machine learning model of neural network, with SPSS modeler ver. 18 : 2 (Chicago, IL) and identified the important metabolites in the model.
The graphic figures were prepared using GraphPad Prism 9 (GraphPad Software, San Diego, CA) or MetaboAnalyst. p values of less than 0.05 were deemed as denoting statistical significance in all the analyses.
RESULTS
Figures 1–4 show a comparison of the brain levels of the significantly modulated metabolites among the control, Cerad-b, and AD brains. The levels of non-significant metabolites in the related metabolic pathways that were modulated are also shown.
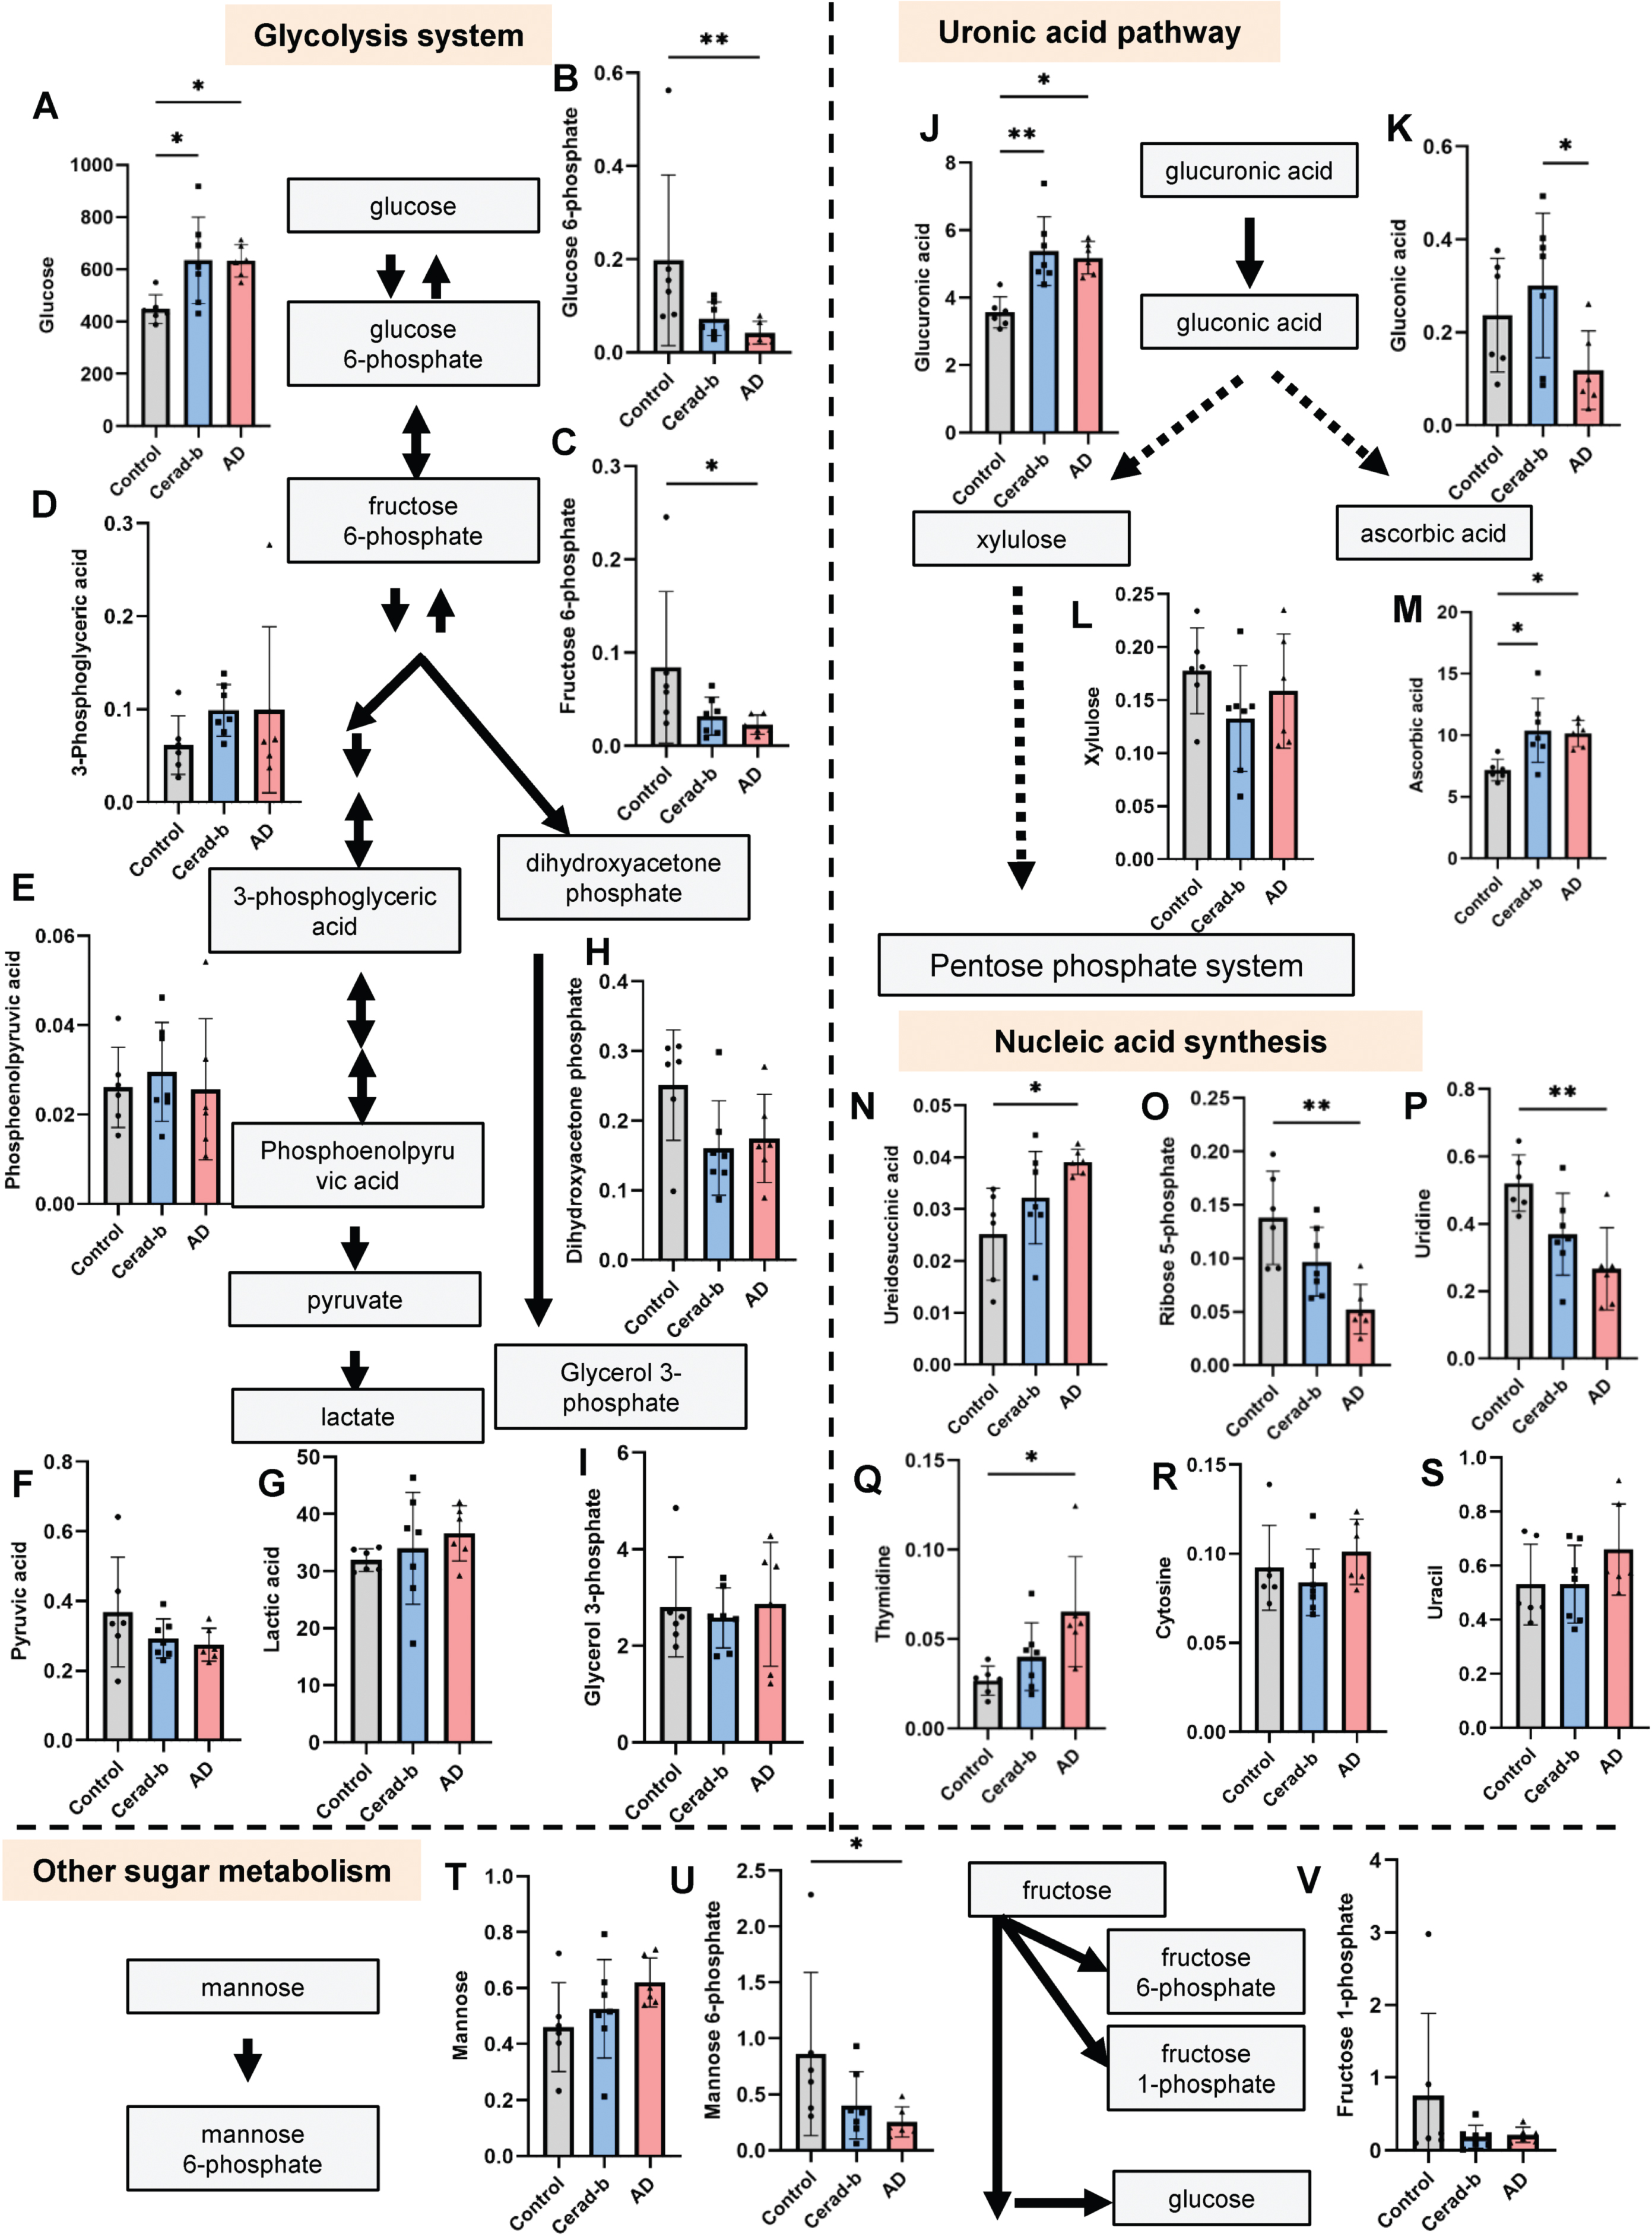
Modulation of the levels of metabolites related to the glycolysis pathway, uronic acid pathway, and nucleic acid synthesis pathways in the AD and Cerad-b brains. The brain levels of metabolites related to the glycolysis system, uronic acid pathway, and nucleic acid synthesis pathways were measured in the postmortem brains of control subjects (n = 6), patients with Cerad score b (n = 7), and patients with AD (n = 6). The levels of the metabolites were adjusted for the brain protein levels. The Kruskal-Wallis test, followed by the Steel-Dwass test as a post-hoc test, was used for statistical evaluation of the differences. *p<0.05; **p<0.01. The units of the Y-axis are mg/g protein. The box bars represent the median and the error bars represent S.D.
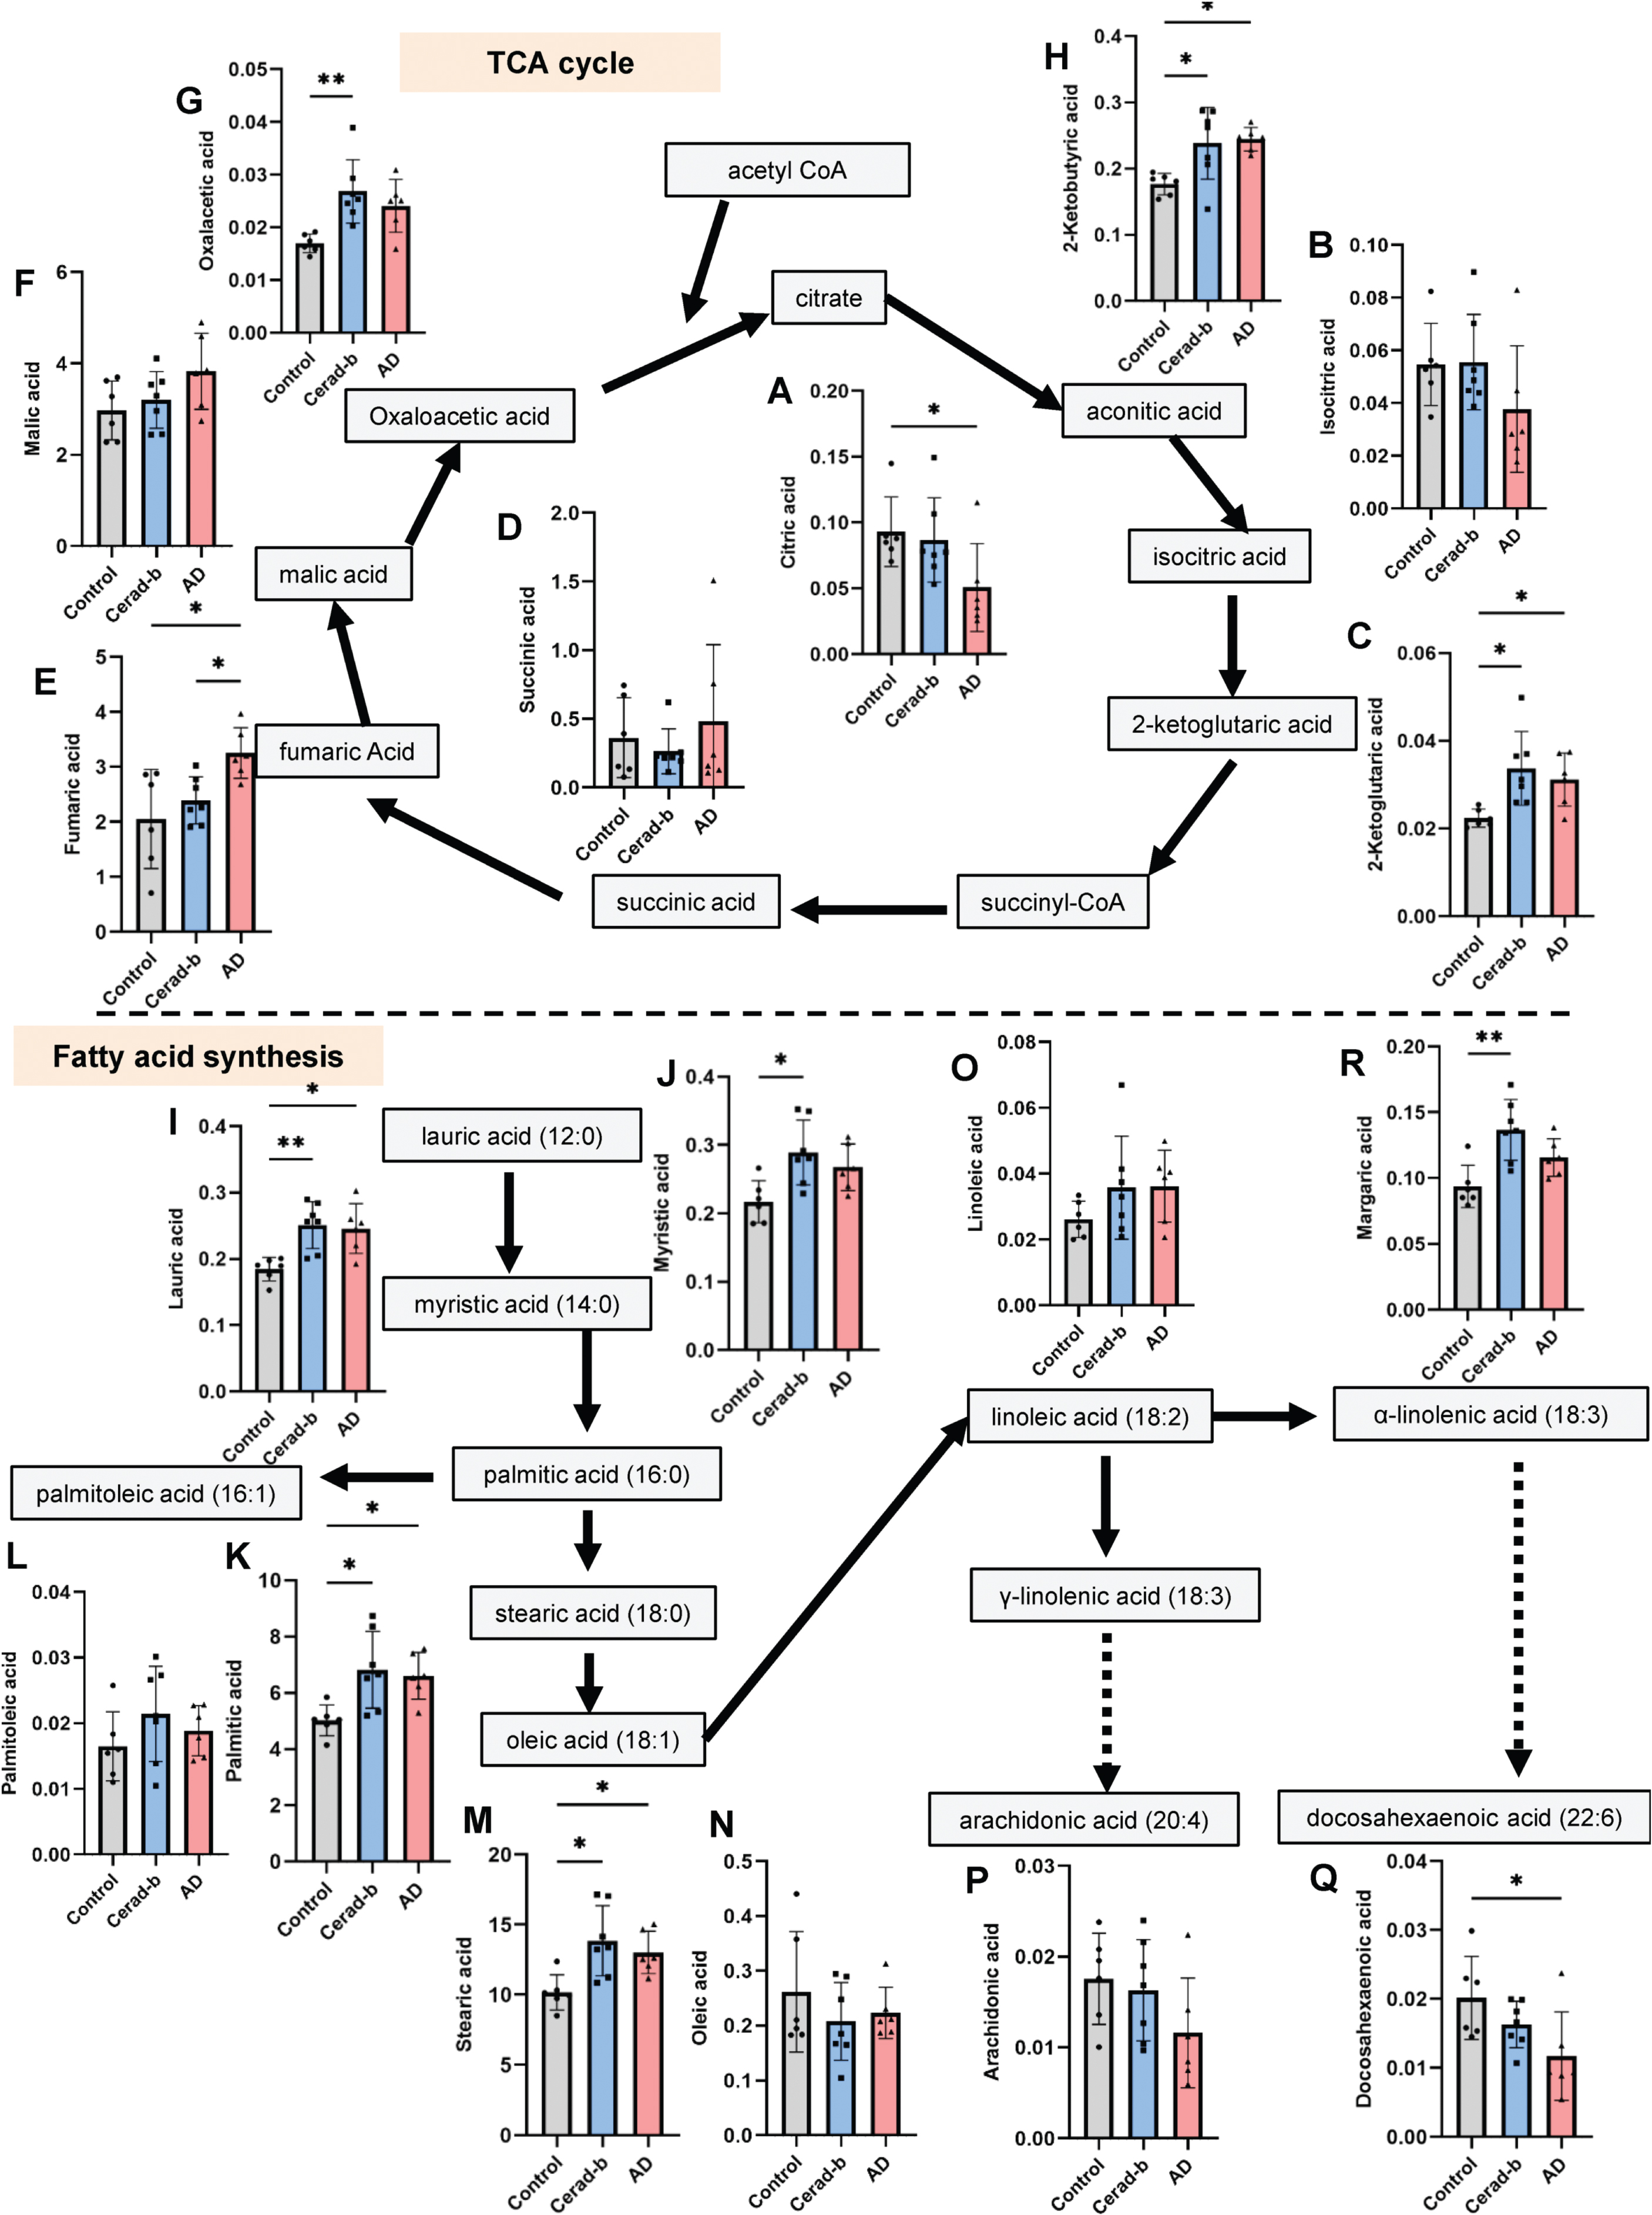
Modulation of the levels of metabolites related to the TCA cycle and fatty acid synthesis pathways in the AD and Cerad-b brains. The brain levels of metabolites related to the TCA cycle and fatty acid synthesis pathways were measured in the brains of control subjects (n = 6), patients with Cerad score b (n = 7), and patients with AD (n = 6). The levels of the metabolites were adjusted for the brain protein levels. The Kruskal-Wallis test, followed by the Steel-Dwass test as a post-hoc test, was used for statistical evaluation of the differences. *p<0.05; **p<0.01. The units of the Y-axis are mg/g protein. The box bars represent the median and the error bars represent S.D.

Modulation of the levels of amino acids and their metabolites in the AD and Cerad-b brains. The brain levels of amino acids and their metabolites were measured in the brains of control subjects (n = 6), patients with Cerad score b (n = 7), and patients with AD (n = 6). The levels of the metabolites were adjusted for the brain protein levels. The Kruskal-Wallis test, followed by the Steel-Dwass test as a post-hoc test, was used for statistical evaluation of the differences. *p<0.05; **p<0.01. The units of the Y-axis are mg/g protein. The box bars represent the median and the error bars represent S.D.

Modulation of the levels of other metabolites in the AD and Cerad-b brains. The brain levels of metabolites other than those described in Figs. 1–3 were measured in the brains of control subjects (n = 6), patients with Cerad score b (n = 7), and patients with AD (n = 6). The levels of the metabolites were adjusted for the brain protein levels. The Kruskal-Wallis test, followed by the Steel-Dwass test as a post-hoc test, was used for statistical evaluation of the differences. *p<0.05; **p<0.01. The units of the Y-axis are mg/g protein. The box bars represent the median and the error bars represent S.D.
Modulations of glucose metabolites in the AD and Cerad-b brains
The brain levels of metabolites involved in the glycolysis pathway are shown in Fig. 1A–I. The glucose levels were higher in the Cerad-b and AD brains as compares with the control brains (Cerad-b, 1.47-fold, p = 0.025; AD, 1.41-fold, p = 0.020), while the glucose 6-phosphate (AD, 0.21-fold, p = 0.005) and fructose 6-phosphate levels (AD, 0.27-fold, p = 0.048) were lower. The metabolites placed on the glycolysis pathway after fructose 6-phosphate were not significantly modulated.
Uronic acid pathway is one of the catabolic pathways of glucose, mainly providing xylulose 5-phosphate to the pentose phosphate system. As shown in Fig. 1J and K, the brain levels of glucuronic acid were higher in both the Cerad-b and AD brains, while those of gluconic acid were lower in the AD brains than in the Cerad-b brains (AD versus Cerad-b, 0.41-fold, p = 0.044). With regard to the metabolites in the pentose phosphate system, the levels of xylulose were not significantly different (Fig. 1L), whereas those of ascorbic acid, which is synthesized via the uronic pathway, were higher in the Cerad-b and AD brains as compared with the control brains (Cerad-b, 1.48-fold, p = 0.019; AD, 1.41-fold, p = 0.027) (Fig. 1M). Furthermore, unequal modulations were observed in the intermediates for each nucleic acid. The brain levels of ureidosuccinic acid, an intermediary product in pyrimidine biosynthesis, were higher (AD, 1.55-fold, p = 0.010), whereas those of ribose 5-phosphate, a general intermediate of the pentose phosphate system, were lower in the AD brains (AD, 0.38-fold, p = 0.004) (Fig. 1N, O). Among the final detected products, the brain levels of uridine were lower (AD, 0.51-fold, p = 0.009), while those of thymidine were higher in the AD brains (AD, 2.44-fold, p = 0.010) (Fig. 1P–S).
Among the non-glucose sugars, the brain levels of mannose 6-phosphate were lower in the AD brains (AD, 0.30-fold, p = 0.041) (Fig. 1T–V).
Concerning the metabolites of the TCA cycle, the brain levels of citrate were significantly lower (AD, 0.54-fold, p = 0.048) and those of isocitrate tended to be lower (AD, 0.69-fold, p = 0.154) in the AD brains (Fig. 2A, B), whereas the brain levels of the metabolites downstream of 2-ketoglutaric acid generally showed significant upregulation in the AD and/or Cerad-b brains; the levels of 2-ketoglutaric acid (Cerad-b, 1.49-fold, p = 0.014; AD, 1.39-fold, p = 0.023), fumaric acid (AD, 1.58-fold, p = 0.017), and oxaloacetic acid (Cerad-b, 1.60-fold, p = 0.008) were significantly modulated (Fig. 2C–G). The brain levels of 2-ketobutyric acid, which is an intermediate of the amino acid catabolism that enters the TCA cycle, were also higher in the AD and Cerad-b brains (Cerad-b, 1.30-fold, p = 0.034; AD, 1.38-fold, p = 0.036) (Fig. 2H).
Modulations of metabolites in the fatty acid synthesis pathways in the AD and Cerad-b brains
Figure 2I–Q show the modulations in the levels of fatty acids in the AD and Cerad-b brains. The brain levels of saturated fatty acids were higher in the AD and/or Cerad-b brains, especially the Cerad-b brains (lauric acid, Cerad-b, 1.35-fold, p = 0.008; AD, 1.33-fold, p = 0.041; myristic acid, Cerad-b, 1.33-fold, p = 0.018; palmitic acid, Cerad-b, 1.37-fold, p = 0.012; AD, 1.32-fold, p = 0.027; stearic acid, Cerad-b, 1.37-fold, p = 0.011; AD, 1.28-fold, p = 0.048; margaric acid, Cerad-b, 1.45-fold, p = 0.005) (Fig. 2I–K, M, R). However, no upregulation of any unsaturated fatty acids was observed either in the AD brain or the Cerad-b brain (Fig. 2L, N–P); the brain levels of docosahexaenoic acid were significantly lower in the AD brain (AD, 0.58-fold, p = 0.048) (Fig. 2Q).
Modulations of amino acids and their metabolites in the AD and Cerad-b brains
Significant modulations in the levels of some amino acids and their metabolites were observed, while the direction of the modulations differed among them (Fig. 3). The amino acids and their metabolites whose levels were significantly increased in the AD brains were aspartic acid (Cerad-b, 5.38-fold, p = 0.014; AD, 3.84-fold, p = 0.023), norvaline (a valine precursor), N6-acetyllysine (a lysine derivative) (Cerad-b, 1.53-fold, p = 0.011; AD, 1.50-fold, p = 0.031), pimelic acid (a lysine precursor) (Cerad-b, 1.44-fold, p = 0.046), tyrosine (Cerad-b, 1.48-fold, p = 0.022; AD, 1.43-fold, p = 0.023), indol-3-acetic acid (a tryptophan precursor) (AD, 2.88-fold, p = 0.005), and dihydrouracil (an alanine metabolite) (AD, 1.33-fold, p = 0.036) (Fig. 3D, I, J, M, N, O, R, S), while those whose levels were significantly decreased in the AD brains were serine (AD, 0.58-fold, p = 0.020), glycine (AD, 0.34-fold, p = 0.042), and propionylglycine (a derivative of glycine) (AD, 0.59-fold, p = 0.027) (Fig. 3A–C). Phenylalanine levels were lower in the AD brains (AD, 0.23-fold, p = 0.007), while the levels of phenylacetic acid, a metabolite of phenylalanine, were higher in the AD brains (AD, 1.46-fold, p = 0.014), suggesting accelerated catabolism of phenylalanine in AD (Fig. 3P, Q).
Modulations of other metabolites in the AD and Cerad-b brains
In addition to the metabolites described above, our comprehensive metabolomics analyses also revealed many other metabolites whose levels were modulated. Figure 4 shows the metabolites for which significant differences in levels were shown by the Kruskal-Wallis test. The brain levels of erythrulose, ribonic acid, coniferyl aldehyde, glucosamine, and pyridoxamine were higher in both AD and Cerad-b brains (erythrulose; Cerad-b, 1.40-fold, p = 0.011; AD, 1.31-fold, p = 0.048; ribonic acid; Cerad-b, 1.35-fold, p = 0.038; AD, 1.37-fold, p = 0.020; coniferyl aldehyde, Cerad-b, 1.51-fold, p = 0.044; AD, 1.61-fold, p = 0.027; glucosamine, Cerad-b, 1.60-fold, p = 0.024; AD, 1.57-fold, p = 0.012; pyridoxamine, Cerad-b, 1.50-fold, p = 0.017; AD, 1.41-fold, p = 0.031) (Fig. 4A–E). The levels of catechol, tropic acid, isomaltose, and fendiline were higher in the Cerad-b than the control brains (catechol, Cerad-b, 3.22-fold, p = 0.021; tropic acid, Cerad-b, 1.48-fold, p = 0.015; isomaltose, Cerad-b, 1.52-fold, p = 0.035; fendiline, Cerad-b, 1.45-fold, p = 0.006), while those of hydroquinone were significantly lower and those of 3-hydroxysebacic acid tended to be lower in the Cerad-b than the control brains (hydroquinone, Cerad-b, 0.23-fold, p = 0.045; 3-hydroxysebacic acid, Cerad-b, 0.73-fold, p = 0.149) (Fig. 4F–K). The levels of 4-hydroxybutyric acid, 2-aminoethanol, 3,4-dihydroxybenzylamine, and inositol were higher in the AD brains (4-hydroxybutyric, AD, 1.69-fold, p = 0.031; 2-aminoethanol, AD, 1.53-fold, p = 0.014; 3,4-dihydroxybenzylamine, 1.60-fold, p = 0.017; inositol, AD, 2.22-fold, p = 0.001), while those of inositol phosphate were significantly lower (AD, 0.27-fold, p = 0.004) and those of 1,5-anhydro-glucitol tended to be lower in the AD brains (AD, 0.55-fold, p = 0.063) (Fig. 4L–Q). The levels of 2-aminoisobutyric acid, rhamnose, and 1,6-anhydroglucose were significantly higher in the AD than the Cerad-b brains (2-aminoisobutyric acid, AD versus Cerad-b, 3.49-fold, p = 0.015; rhamnose, AD versus Cerad-b, 1.99-fold, p = 0.001; 1,6-anhydroglucose, AD versus Cerad-b, 1.94-fold, p = 0.019) (Fig. 4R–T).
Modulations of the enzyme expressions in the AD and Cerad-b brains
We also investigated the mRNA levels of the enzymes which play important roles in the kinetics of the metabolites showing significant modulations in the AD brains. The investigated enzymes are described in Supplementary Table 2.
Among the investigated enzymes, the mRNA levels of glucuronidase (GUSB), solute carrier family 7 member 5 (SLC7a5), and inositol-3-phosphate synthase 1 (ISYNA1) were significantly lower in the Cerad-b brains than the control brains (GUSB, Cerad-b, 0.56-fold, p = 0.031; SLC7a5, Cerad-b, 0.56-fold, p = 0.009; ISYNA1, Cerad-b, 0.44-fold, p = 0.014) (Fig. 5B, F, G). Moreover, the mRNA levels of Citrate synthase (CS) and phosphoserine phosphatase (PSPH) were significantly lower in the AD brains than the control brains (CS, AD, 0.60-fold, p = 0.023; PSPH, 0.68-fold, p = 0.020) (Fig. 5D, F). Among these modulations, the modulations of CS and PSPH were concordant with those of the corresponding metabolites, citrate, and serine, respectively.
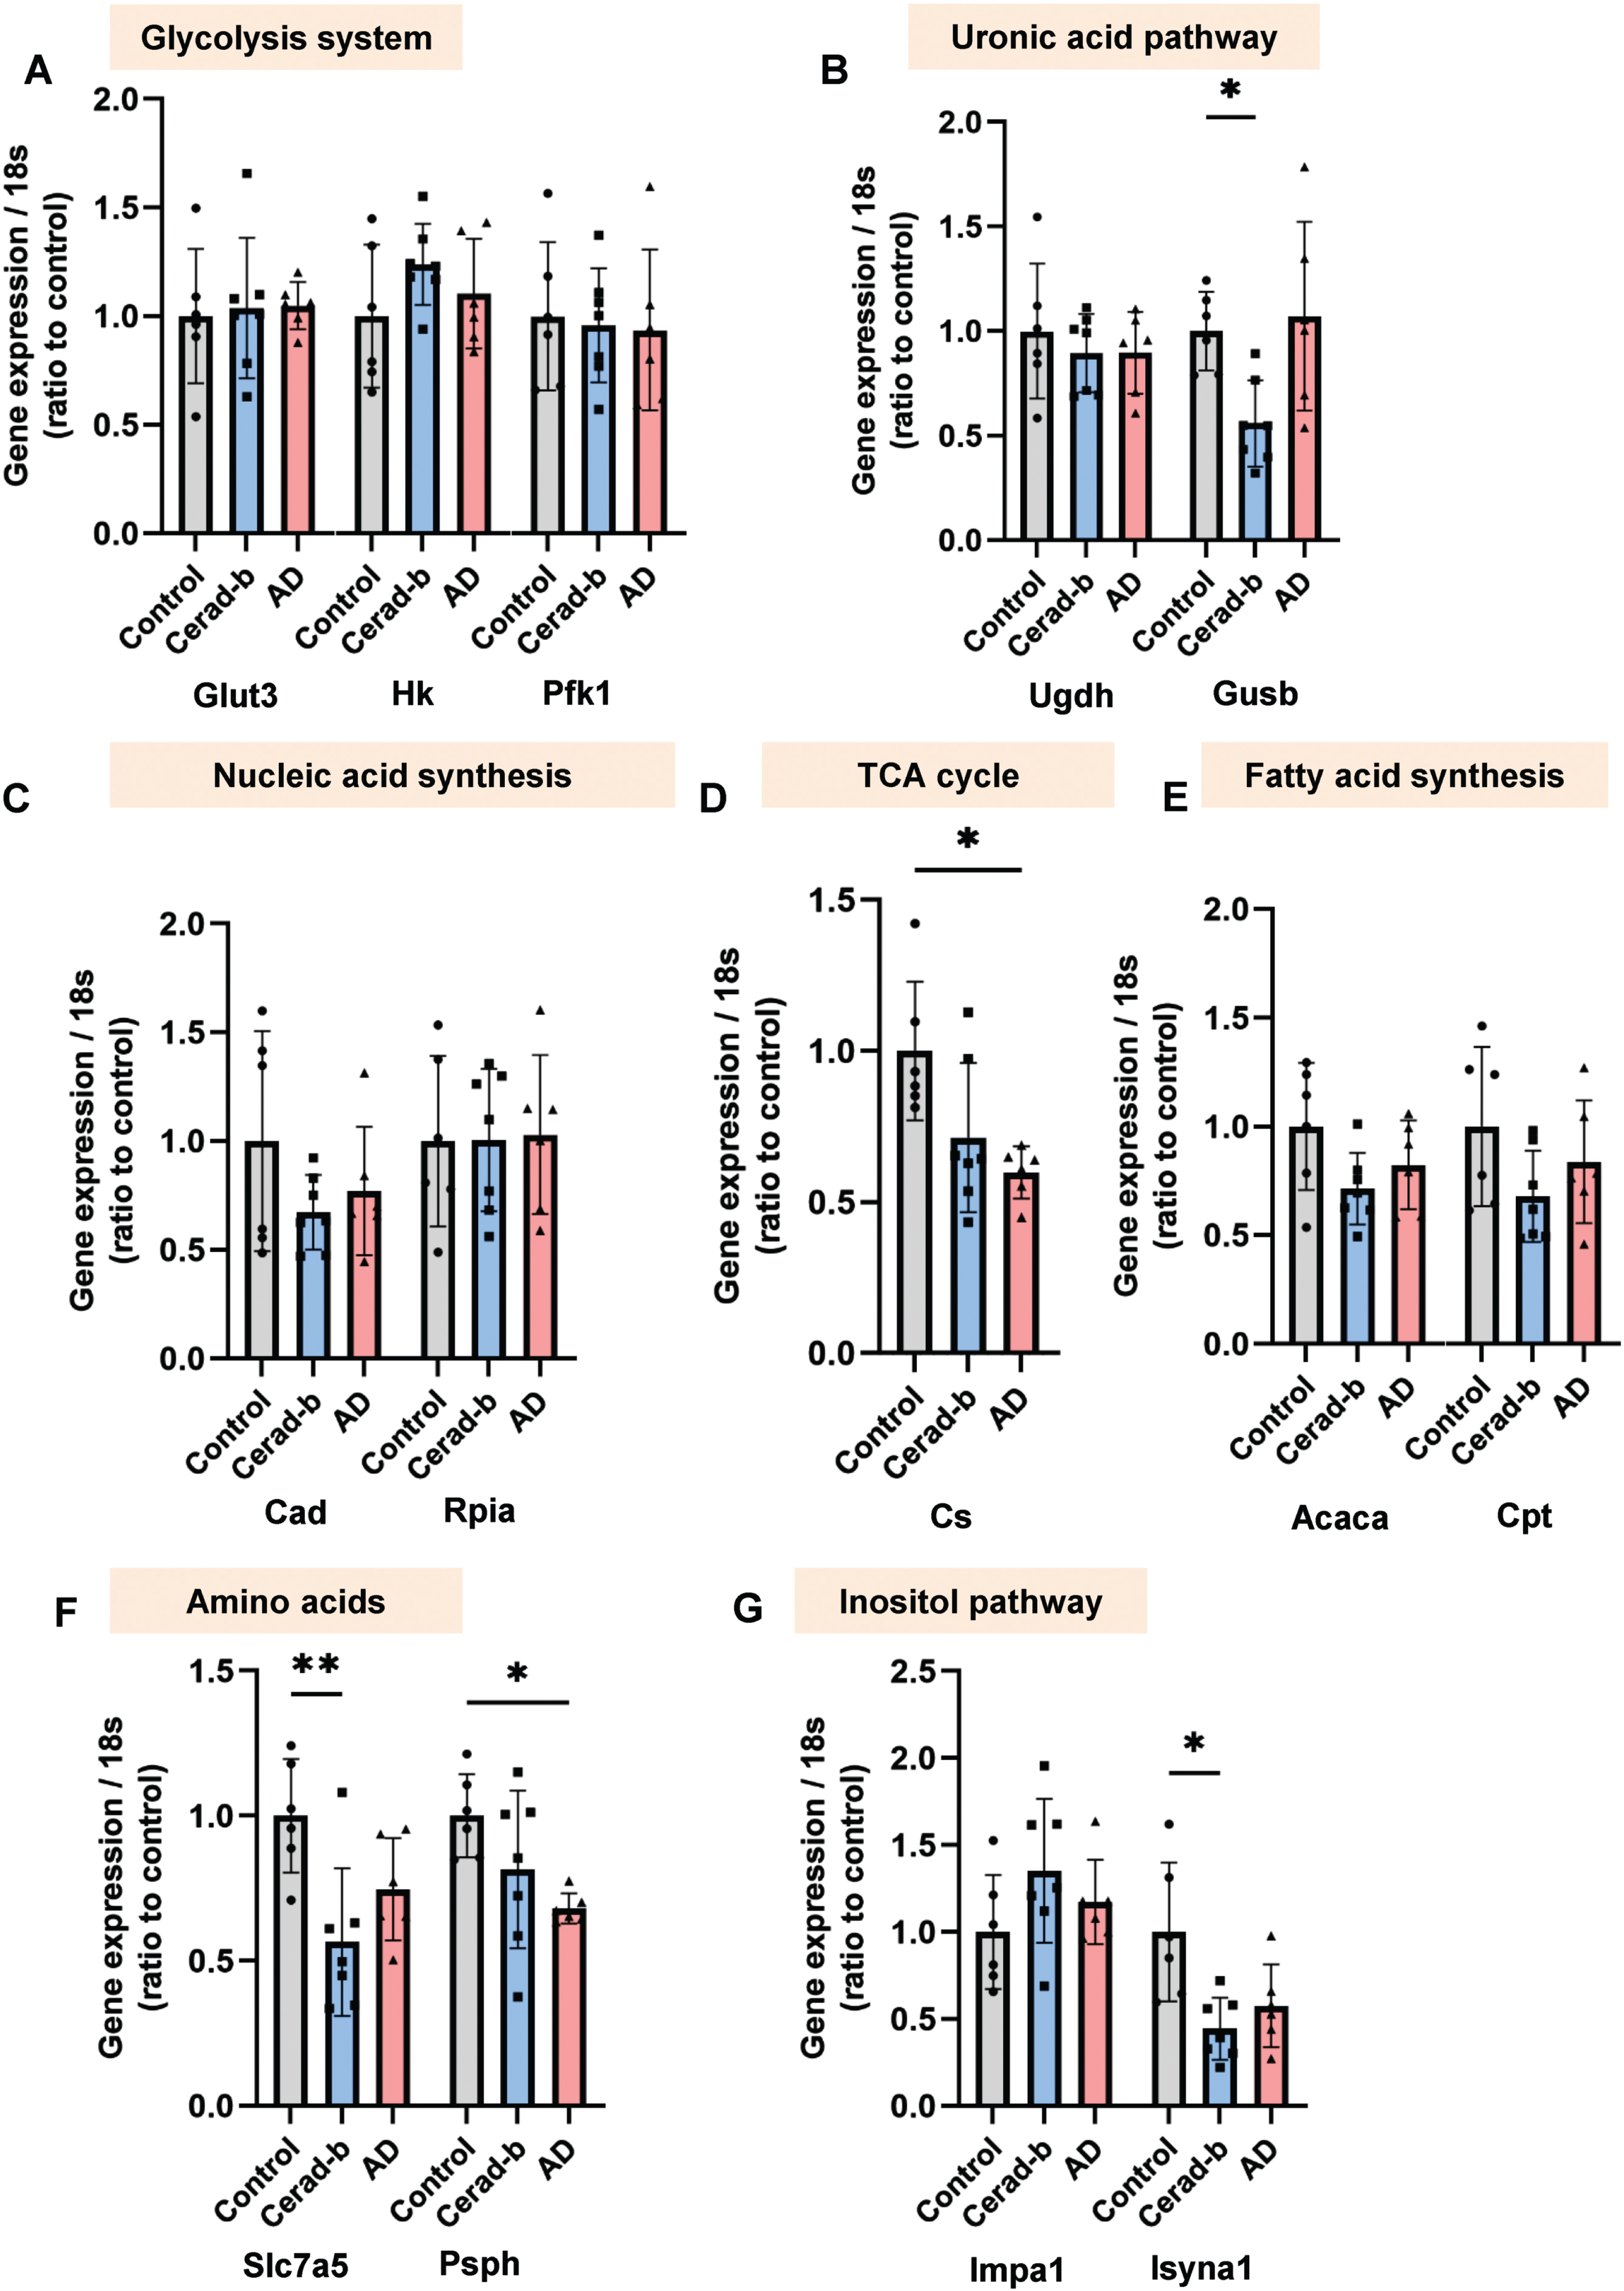
Modulation of the enzyme expressions in the AD and Cerad-b brains. The brain mRNA levels of enzymes, which play important roles in the kinetics of the metabolites showing significant modulations in the AD brains in Figs. 1–4, were investigated with a real time PCR method in the brains of control subjects (n = 6), patients with Cerad score b (n = 7), and patients with AD (n = 6). The levels of the gene expression were adjusted for the expression level of 18 s as the internal standard. The Kruskal-Wallis test, followed by the Steel-Dwass test as a post-hoc test, was used for statistical evaluation of the differences. *p<0.05; **p<0.01. The box bars represent the median and the error bars represent S.D.
Correlations of the contents of the metabolites with the clinical phenotypes in the postmortem brains
Next, we investigated the correlations of the levels of metabolites with the clinical phenotypes. Figure 6A shows the correlation coefficients and p-values for the top 20 lipid mediators with the lowest p values in the analysis of the correlations with any specific clinical parameters (diagnostic group [control, Cerad-b, and AD], SP score, Braak stage, and Aβ content) in heat maps. Notably, the contents of inositol and 2-aminoethanol were strongly positively correlated with all the four clinical parameters, whereas the contents of glucose 6-phosphate were strongly negatively correlated with the same parameters. The contents of fumaric acid were strongly positively correlated, while those of glycine, phenylalanine, serine, ribose 5-phosphate, and uridine were strongly negatively correlated with the SP score and Braak stage. The contents of 2-methylhippuric acid, 3-hydroxybutyric acid, 4-hidyroxybutyric acid, coniferyl aldehyde, and thymidine were strongly positively correlated with the SP score, while those of inositol phosphate and o-phosphoethanolamine were strongly negatively correlated with the SP score. The contents of 2-hydroxyisovaleric acid were positively correlated, while those of propionylglycine were negatively correlated, with the Braak stage. The levels of 2-ketoglutaric acid, oxaloacetic acid, phenylacetic acid, glucuronic acid, and ureidosuccinic acid showed moderately positive correlations, while those of fructose 6-phosphate showed moderately negative correlations, with the Aβ levels.
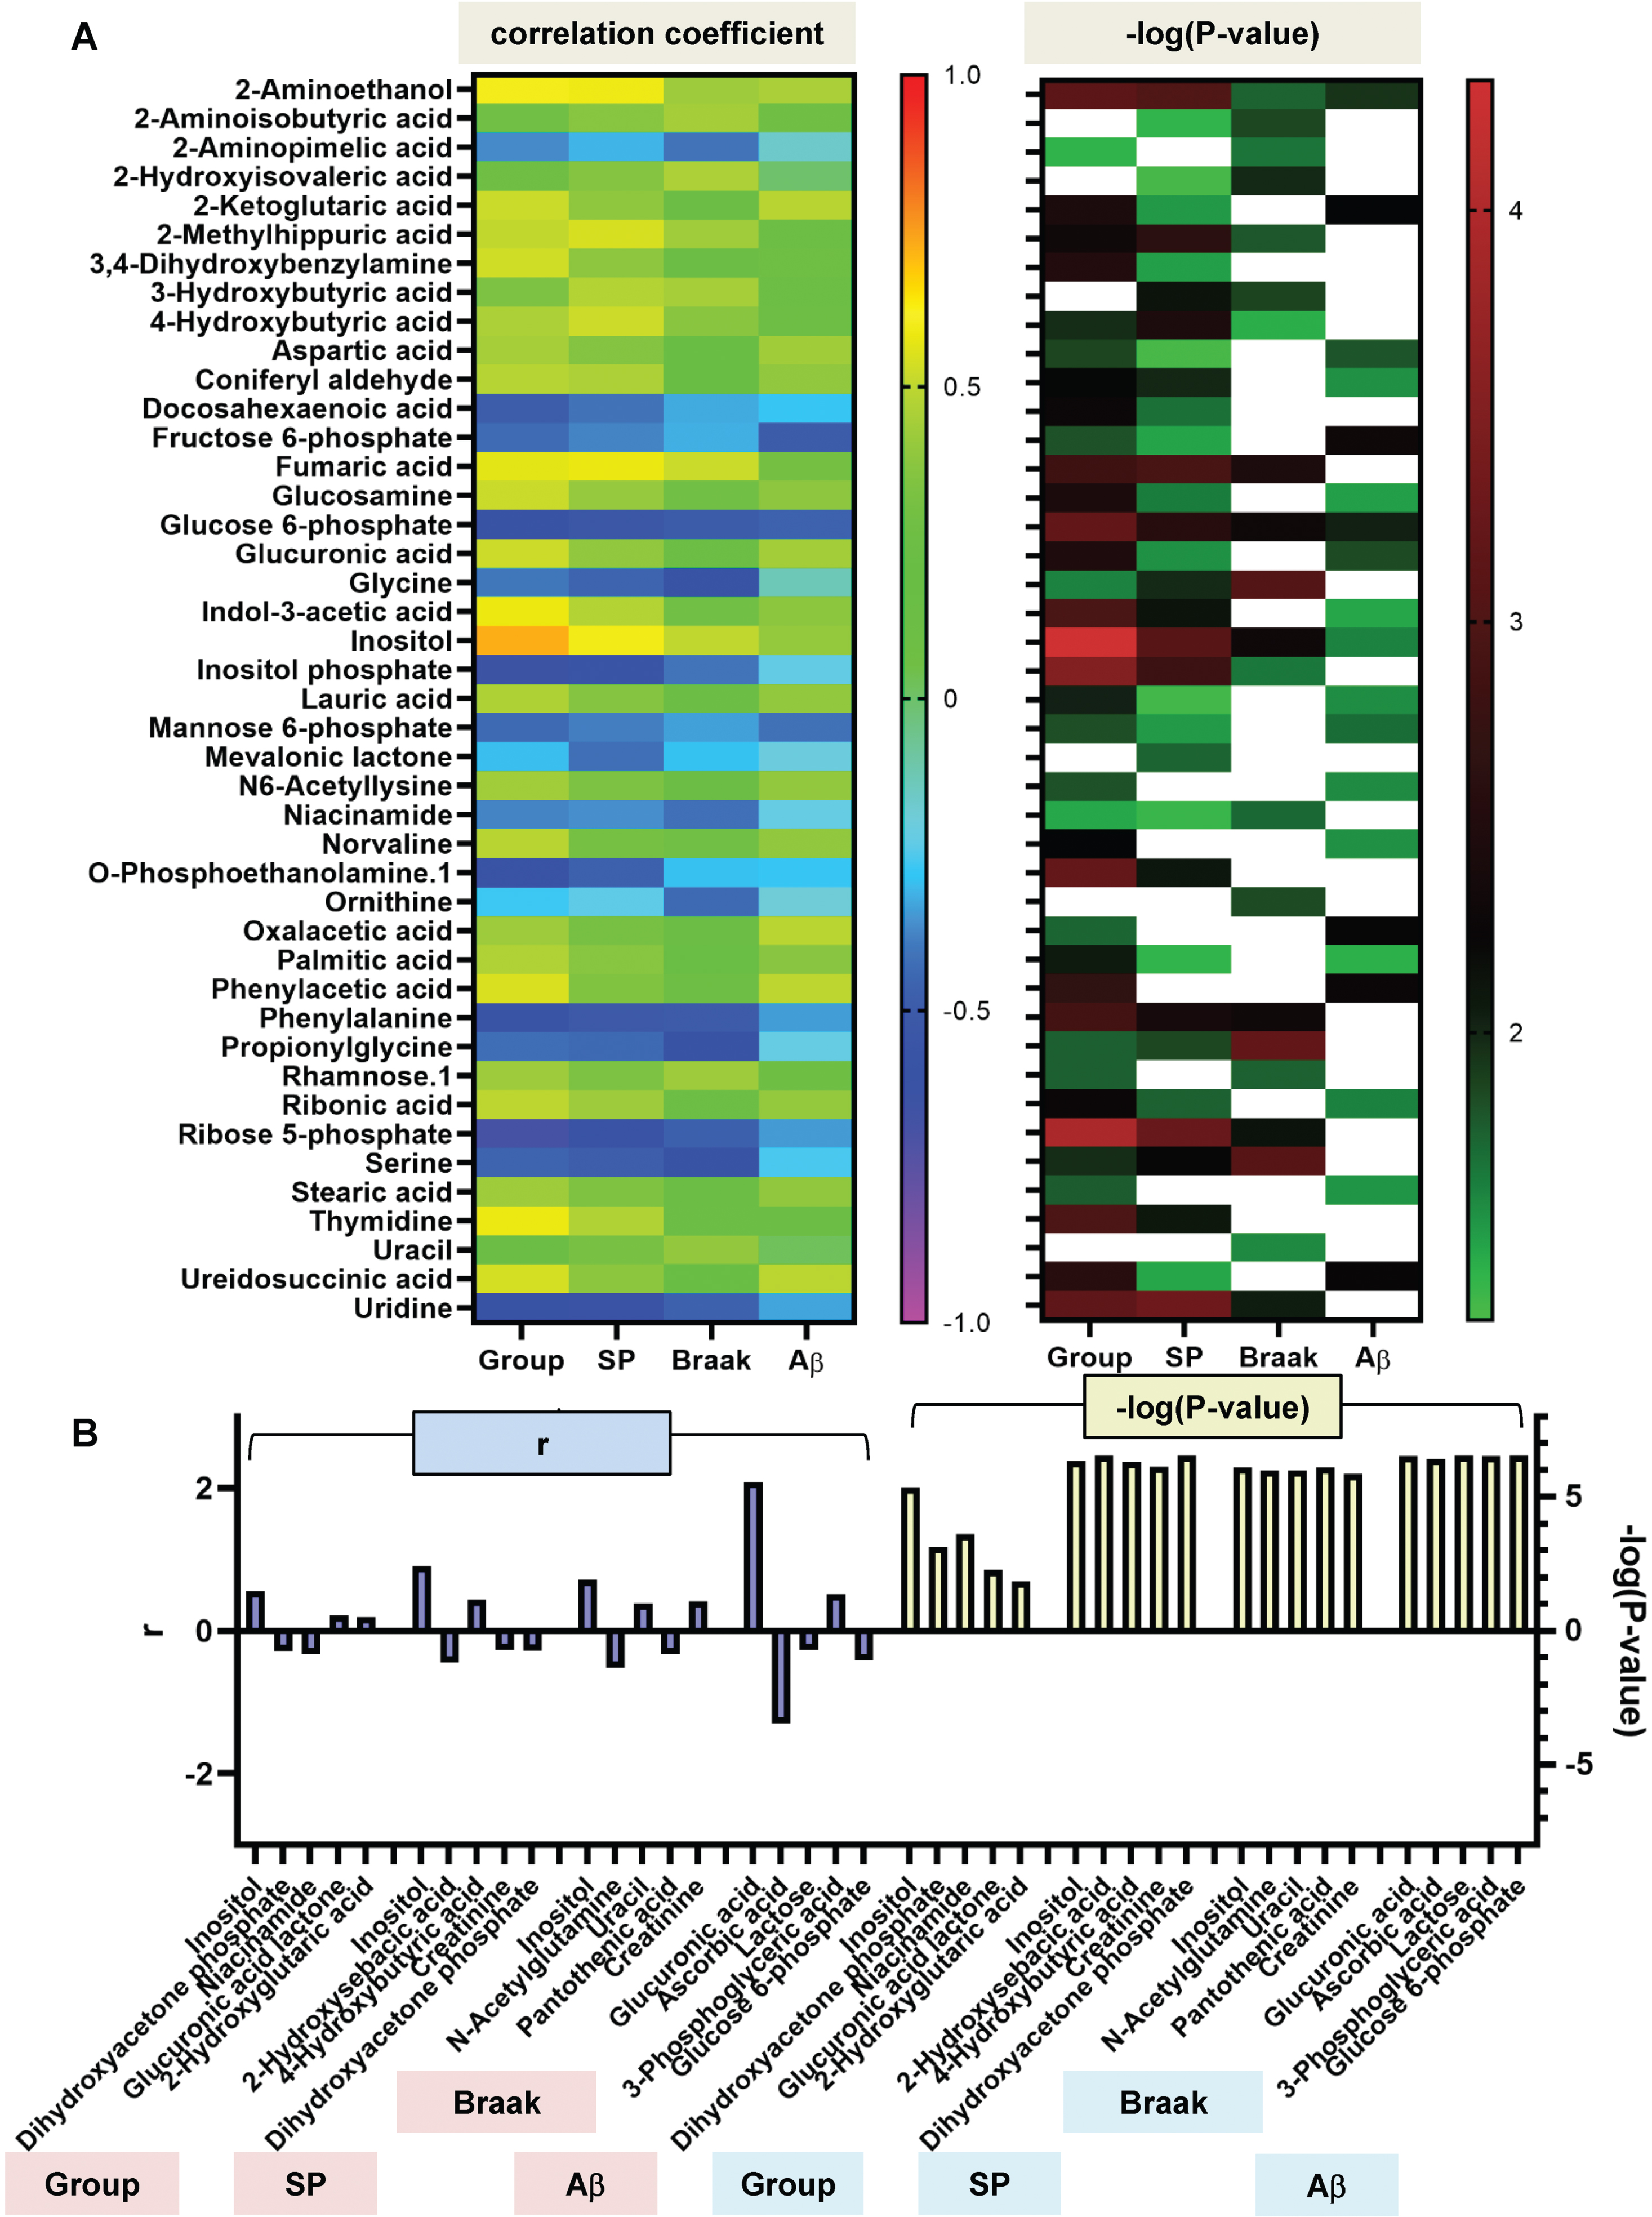
Correlations between the levels of various metabolites and the clinical phenotypes. The correlations between the brain levels of metabolites and the clinical phenotypes (group [control, Cerad-b, and AD], SP score, Braak stage, and Aβ content) were examined using the Kendall rank correlation for correlations with the diagnostic group, SP score, and Braak stage, and the Spearman rank correlation for Aβ using age and sex as the covariates of interest. A) The correlation coefficients and the p-values of the top 20 metabolites with the lowest p values in the analysis of the correlations with any specific clinical parameters (group [control, Cerad-b, and AD], SP score, Braak stage, or Aβ content) are shown in heat maps. B) The independent effects of the metabolites on the clinical phenotypes (Group, SP score, Braak stage, and Aβ content) were investigated by stepwise multiple logical regression analysis, using these clinical phenotypes as objective variables and the metabolites, age, and sex as possible explanatory factors. The standardized β values and p-values of the top five most important metabolites are shown.
We performed multiple regression analyses to analyze the independent associations of the metabolites with the clinical phenotypes, and the top five most important metabolites are shown in Fig. 6B. We identified inositol as showing the strongest positive associations with the diagnostic group, SP score, and Braak stage. Glucuronic acid was selected as the best positive explanatory metabolite for the brain Aβ levels. Nicotinamide, 2-hydroxysebacic acid, N-acetylglutamine, and ascorbic acid were identified as the best negative explanatory metabolites for the diagnostic group, SP score, Braak stage, and Aβ levels, respectively.
Comprehensive statistical analyses to identify the metabolites that were independently associated with AD
As we obtained data on numerous kinds of metabolites, we performed comprehensive statistical analyses, including enrichment analyses, sparse PLS-DA, and neural network analyses, to understand the results better and identify the metabolites or metabolic pathways that are significantly associated with AD.
First, enrichment analyses revealed that histidine metabolism, phosphatidylinositol signal, pentose and glucuronate interconversions, inositol phosphate metabolism, and orbate and aldarate metabolism might be significantly modulated in the AD as compared with the control brains (Fig. 7A). Analysis to identify the metabolic pathways that were progressively modulated in the process from healthy brain to Cerad-b brain to AD brain suggested that gluconeogenesis, the Warburg effect, glycine and serine metabolism, and the urea cycle might be progressively modulated with progression from normal to Cerad-b (Supplementary Figure 2). Then, phosphatidylinositol phosphate metabolism, TCA cycle, phenylalanine and tyrosine metabolism, and porphyrin metabolism might be modulated with further progression to the stage of AD (Supplementary Figure 3).
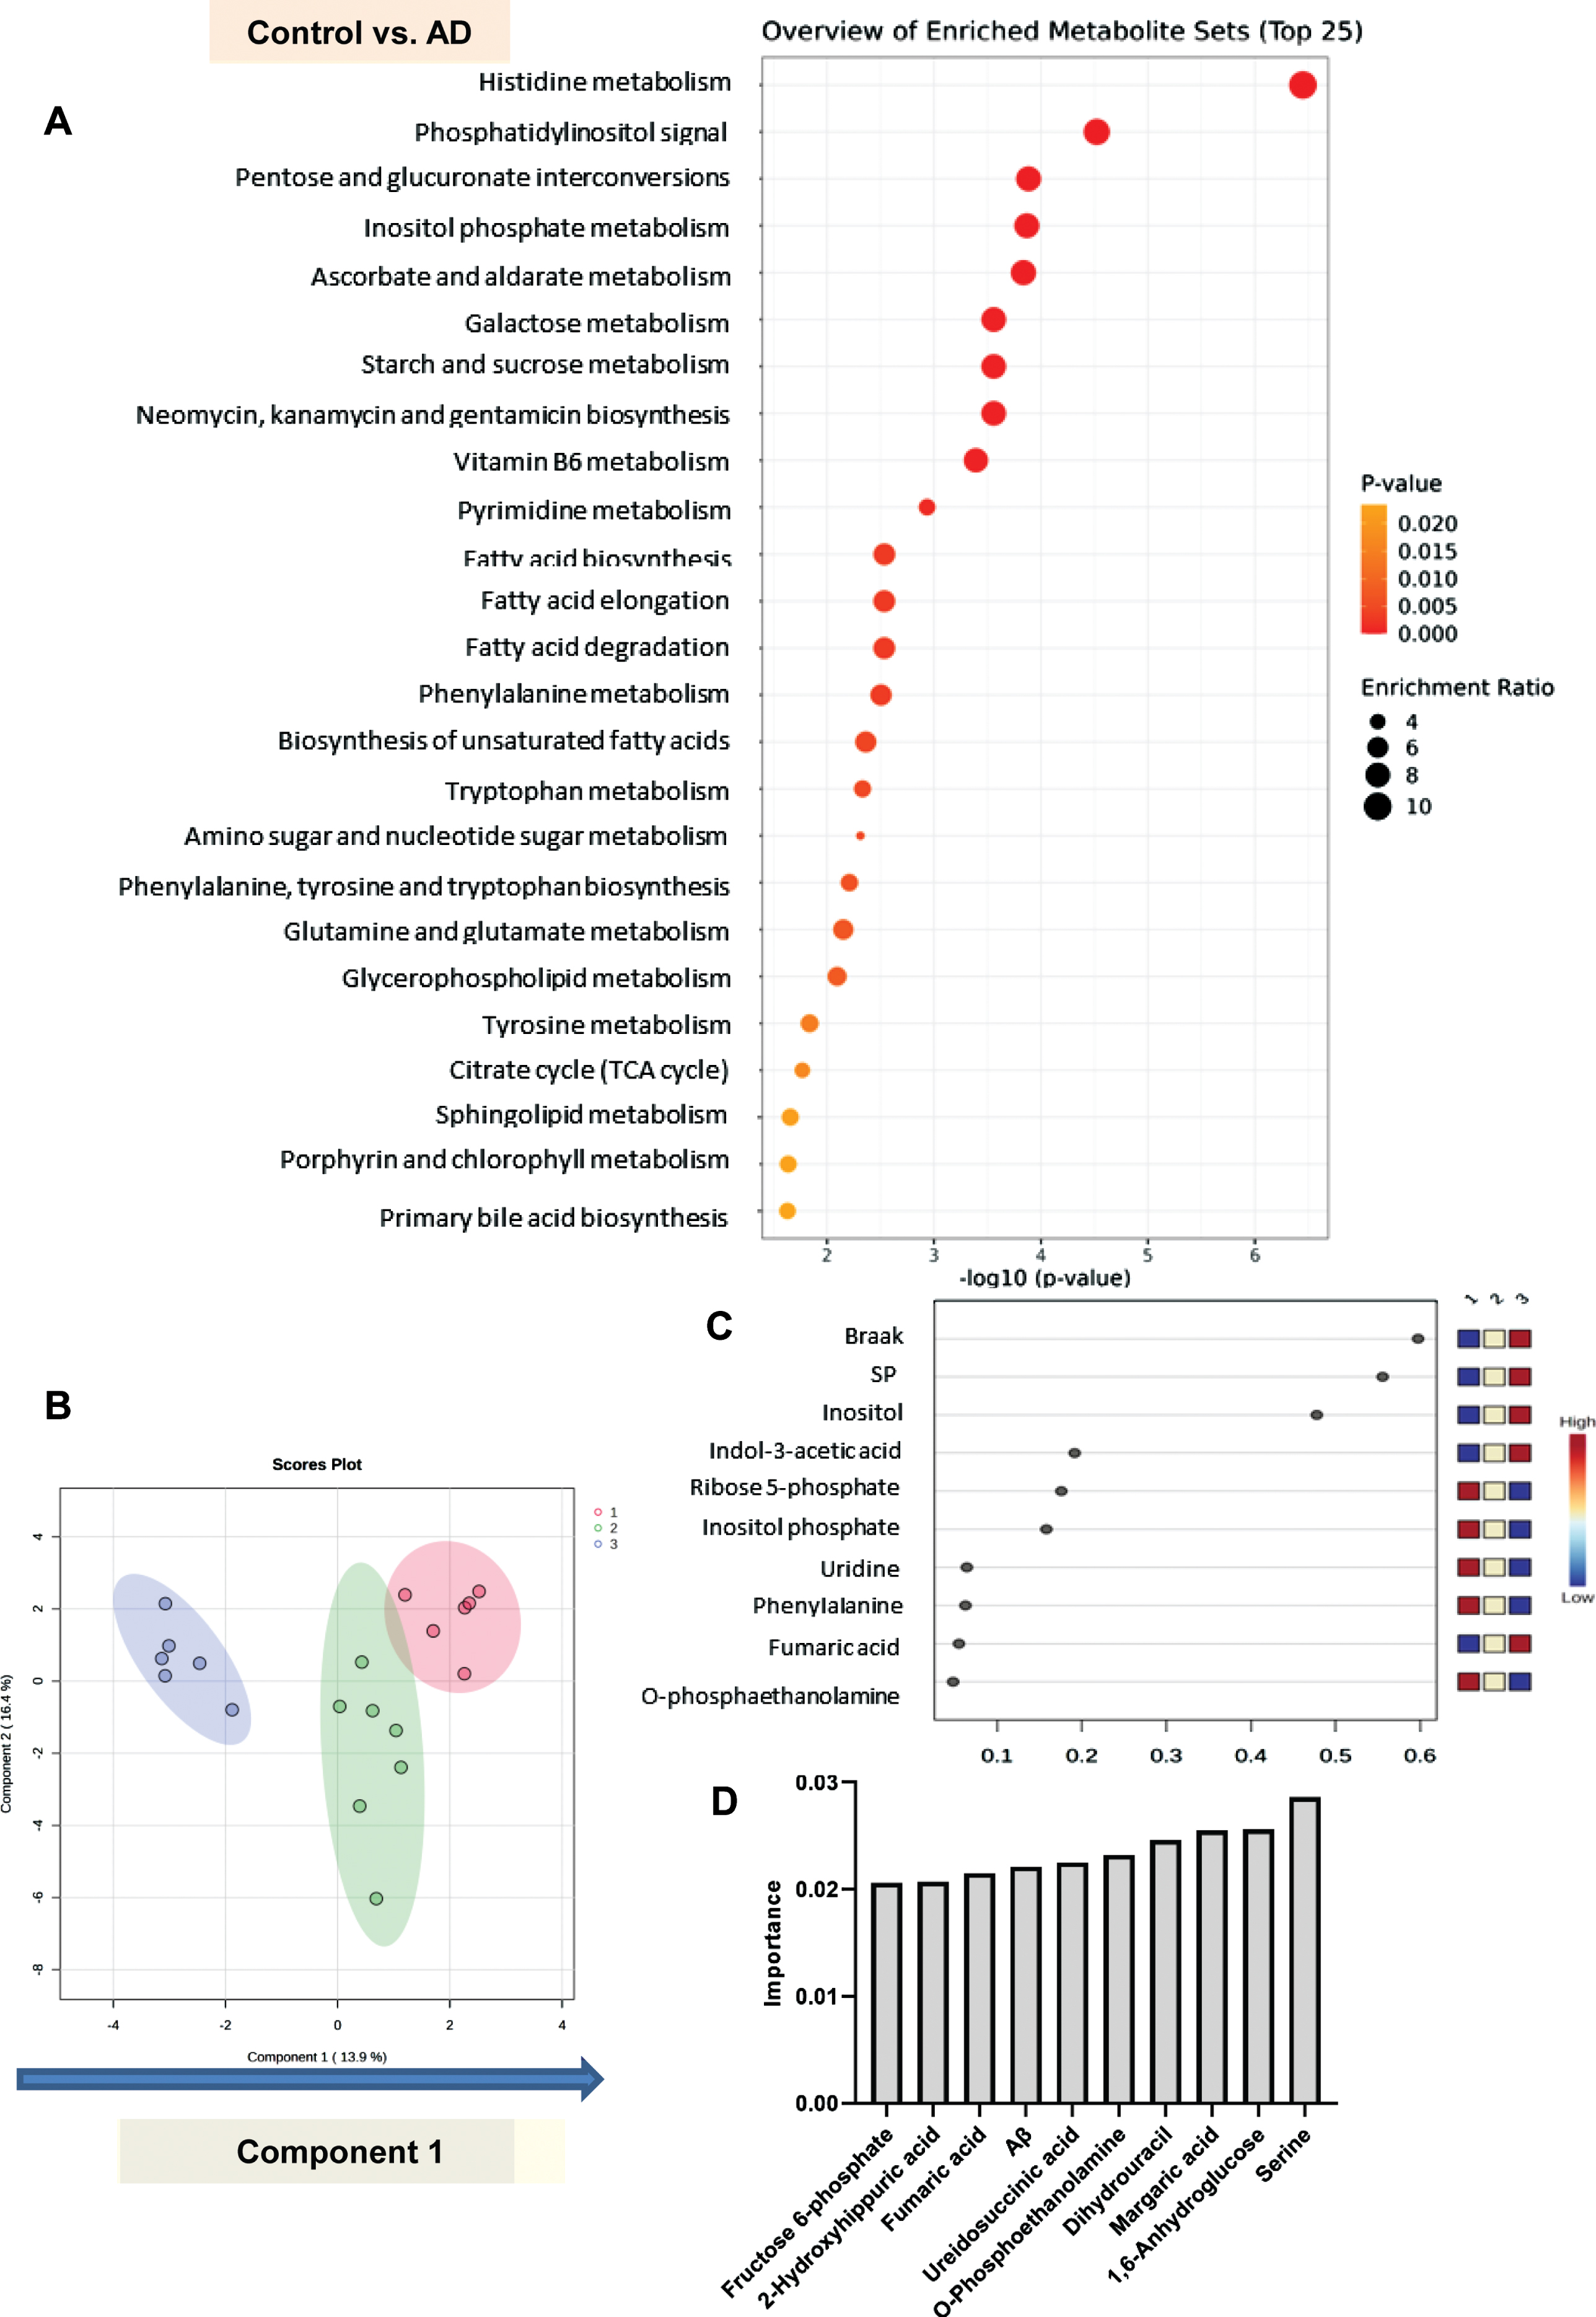
Comprehensive statistical analyses to identify the metabolites related to the development/progression of AD. A) An enrichment analysis was performed with MetaboAnalyst 5.0 using the pathway based on SMPDB to identify the metabolic pathways which are modulated in AD brains as compared with control brains. B, C) Sparse PLS-DA was performed for metabolites that might contribute to discriminating AD from Cerad-b and control, and AD and Cerad-b from control. B) Score plots. C) Loading plot for component 1. D) A neural network analysis, using SPSS modeler ver. 18 : 2 to identify the important metabolites in the model distinguishing among control, Cerad-b, and AD. The top 10 important variables are described.
Although principal component analysis could not completely discriminate among the three groups, their distributions also did not entirely overlap each other (Supplementary Figure 4). Therefore, we performed a sparse PLS-DA to identify the metabolites that contributed to discriminating among the three diagnostic groups, considering the clinical phenotypes together. As shown in Fig. 7B, component 1 discriminated among the three groups in the order of AD, Cerad-b, and control quite well. The Braak stage and SP score contributed to component 1, followed by inositol, indol-3-acetic acid, ribose 5-phosphate, and inositol phosphate (Fig. 7C).
Lastly, we used a machine learning technique, a neural network analysis, to identify metabolites that were significantly modulated in the clinical phenotypes. As shown in Supplementary Figure 5, we could construct a neural network with an accuracy of 100%. The top 10 important metabolites are listed in Fig. 7D. Serine, 1,6-anhydroglucose, margaric acid, dihydrouracil, O-phosphoethanolamine, and ureidosuccinic acid were found to be more important than the Aβ content.
DISCUSSION
In this study, we observed substantial modulations in the levels of various metabolites in the Cerad-b and AD brains. The results are summarized in Fig. 8.
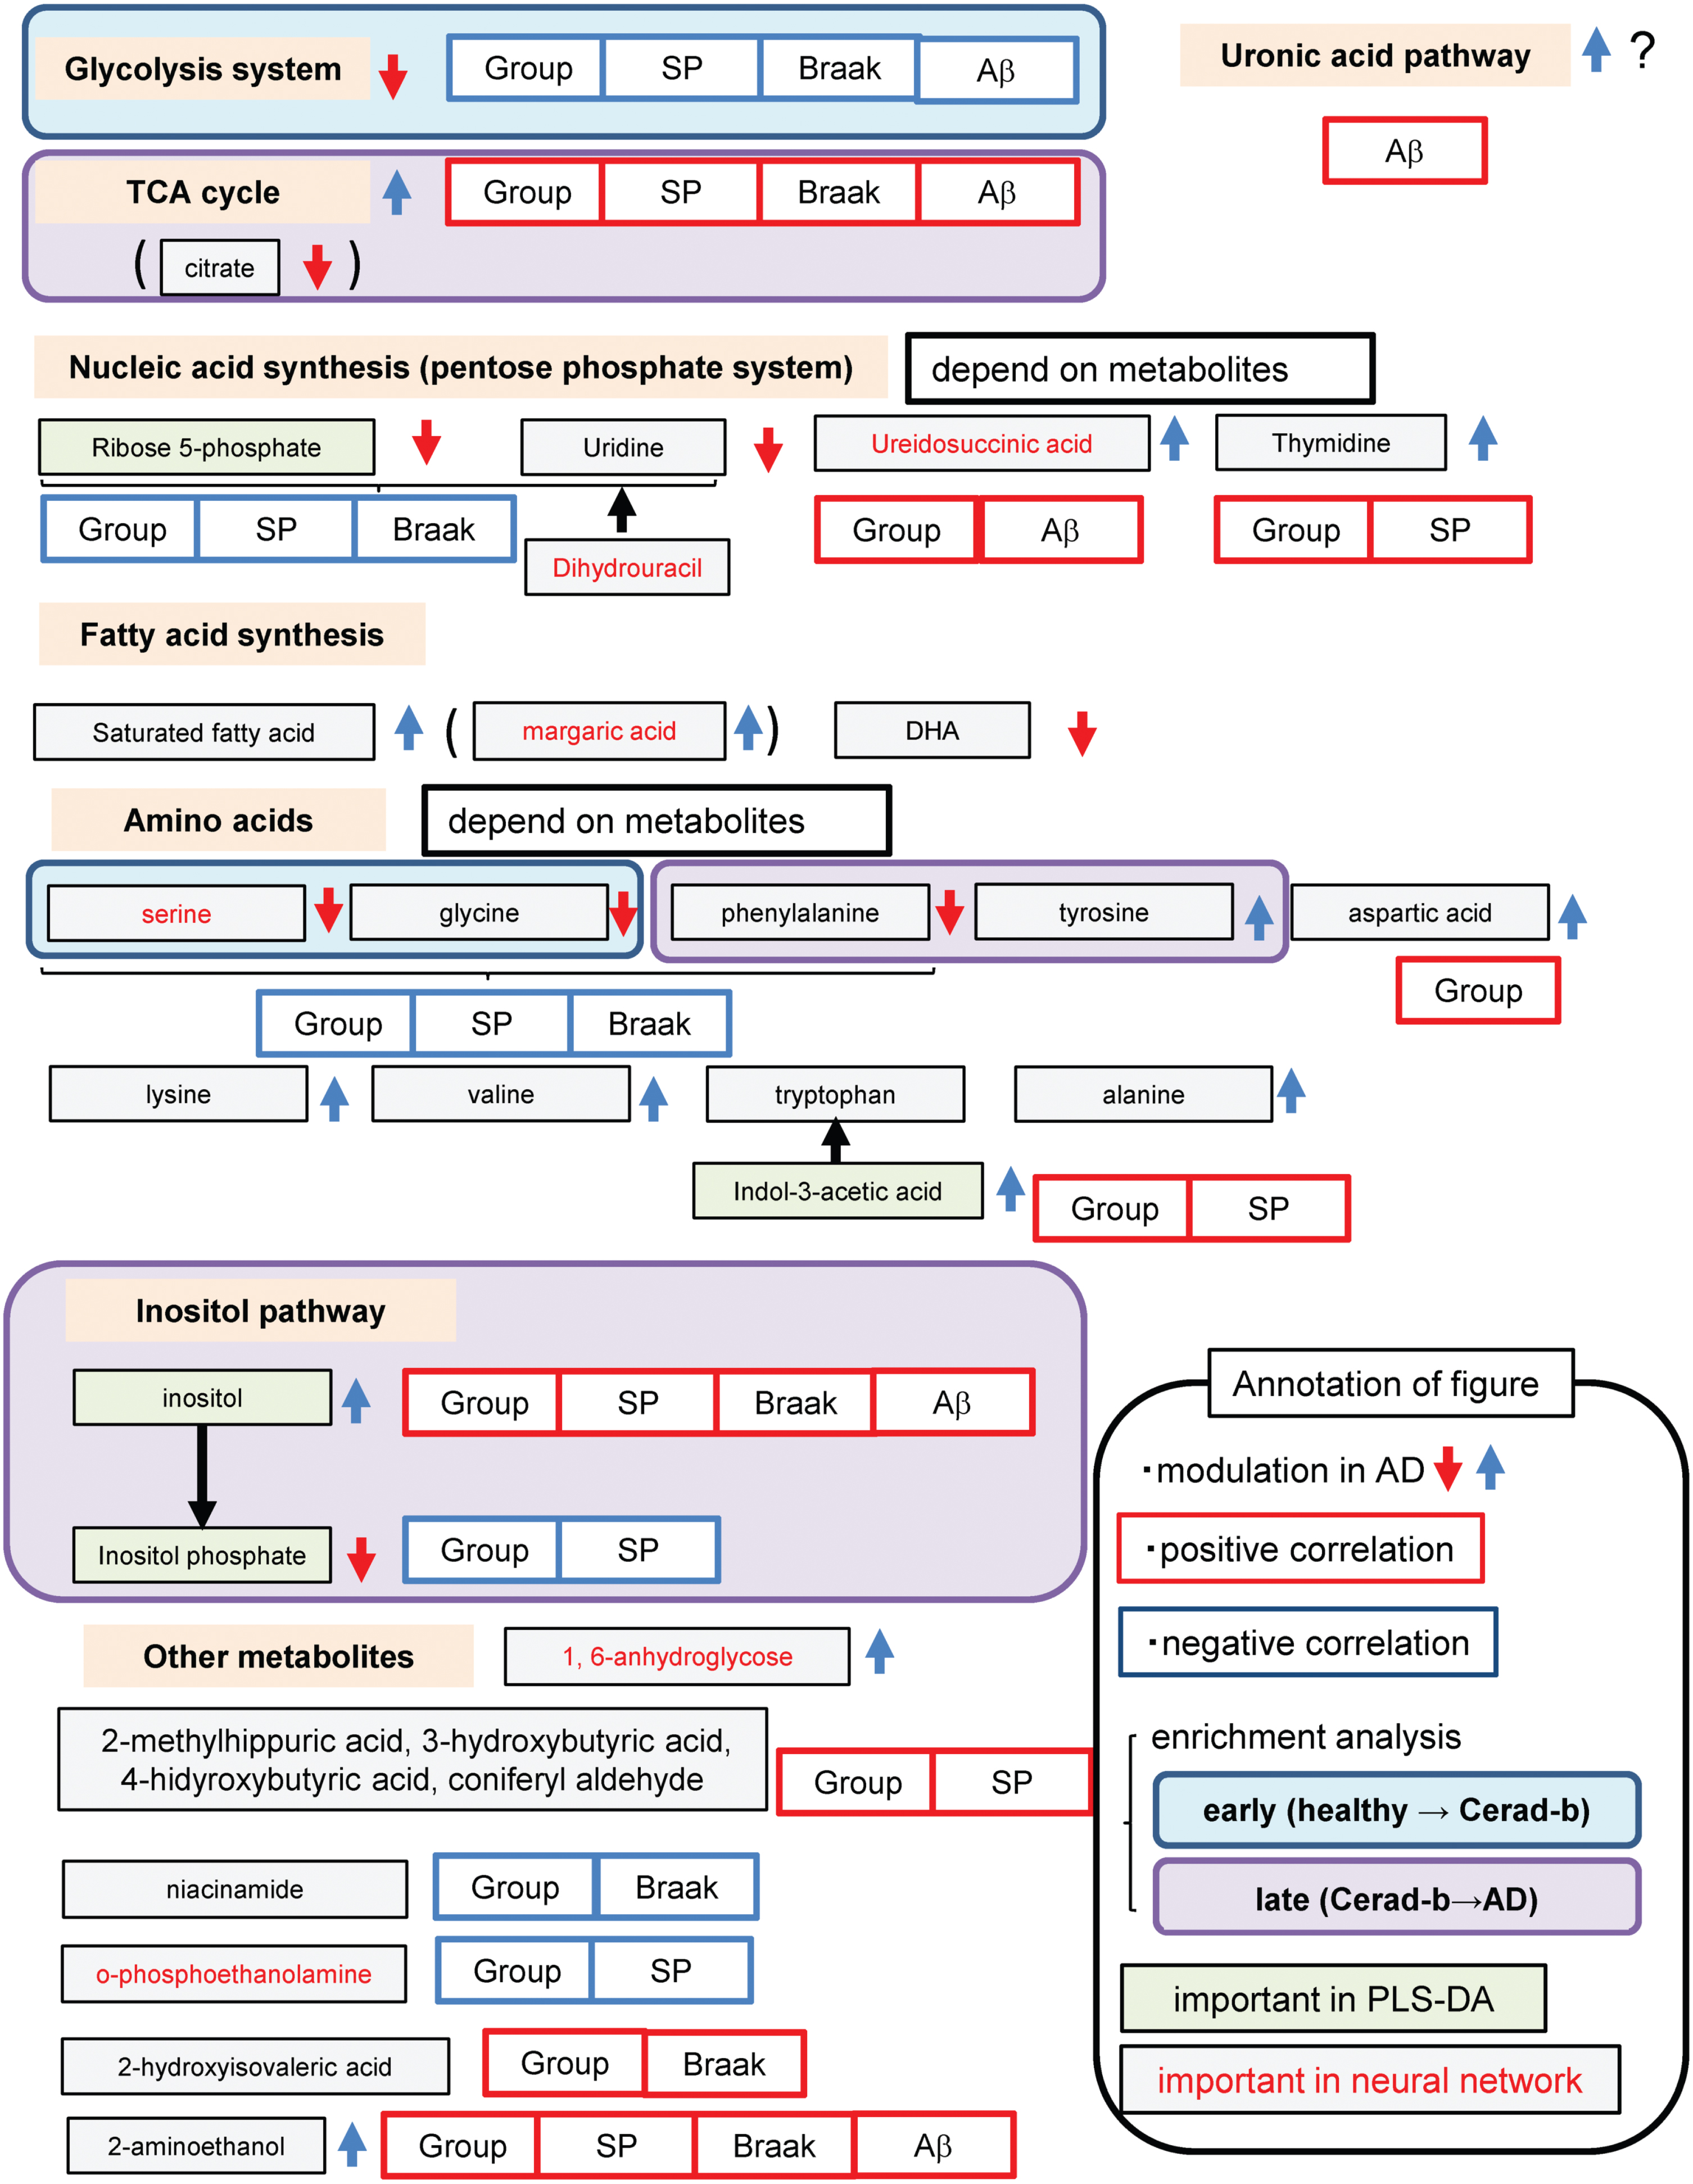
Schematic showing modulation of metabolites in the AD brain.
With regard to the glycolysis pathway in the brain, our findings suggested that glucose utilization was retarded at the step of conversion of glucose to glucose 6-phosphate, which are concordant with previous studies [19] (Fig. 1A, B). As for the TCA cycle, the contents of all the metabolites of the TCA cycle, except those of citrate, were increased in the AD brains (Fig. 2A–H). While former studies suggest impaired glucose uptake by the brain [5, 6], our findings herein suggest that impaired phosphorylation of glucose might be the cause of the impaired utilization glucose in AD brains. The reasons for the discrepancy remained unknown. Contrary to the previous studies using PET with living human subjects [5, 6], the present study investigated the postmortem brains, which might explain the discrepancy. Actually, in this study, glucose contents were higher in the AD brains (Fig. 1A). In alive human subjects, however, it is impossible to investigate the modulation of glucose metabolism in the brains. Therefore, we think that the impaired phosphorylation of glucose might also exist in the AD brains. Importantly, the glucose 6-phosphate levels in the AD brains were strongly negatively correlated with the clinical phenotypes (Fig. 6A). Considering that the levels of mannose 6-phosphate and fructose 6-phosphate were also decreased (Fig. 1C, U), we speculate that impaired phosphorylation of sugar might have some important role in the pathogenesis of AD. Although modulations of the mannose 6-phosphate and fructose 6-phosphate levels have not previously been reported, a positive association has been reported between the mannose 6-phosphate receptor level and AD [20]. The results of our enrichment analysis also suggested that impaired glycolysis might play an important role, even from a rather early phase, in the pathogenesis of AD (Supplementary Figure 2). The mRNA levels of the enzymes involved in glucose uptake or glycolysis were no modulated (Fig. 5A). Although previous studies have suggested impaired functioning of the TCA cycle in the AD brain [11], we observed elevated levels of the TCA cycle metabolites, except citrate, whose levels were decreased, in AD. The mRNA levels of CS were lower in the AD brains, which was concordant with the modulations of citrate in AD (Fig. 5D). In the present study, since we did not perform flux assays, we could not determine whether the TCA cycle was accelerated or inhibited. However, we can safely conclude that altered functioning of the TCA cycle may have some role in the pathogenesis of AD, since enrichment analysis identified the TCA cycle as playing an important role in the transition from Cerad-b to AD (Supplementary Figure 3). In fact, the levels of several metabolites of the TCA cycle were found to be positively correlated with the clinical phenotypes of AD (Fig. 4A).
Metabolites in the catabolic pathways of glucose have also been reported to be associated with AD [4]. In addition, large-scale proteomic analysis also proposed that glucose metabolism was one of the modules most significantly associated with AD pathology [21]. With regard to modulations of the uronic acid pathway metabolites, the levels of glucuronic acid were higher, while those of gluconic acid were lower in the AD brains (Fig. 1J, K). The mRNA levels of UDP-glucose 6-dehydrogenase were not different, while those of GUSB were lower in the Cerad-b brains (Fig. 5B), which was not concordant with the result that no modulation was observed in the levels of gluconic acid in the Cerad-b brains. The glucuronic acid levels were found to be strongly associated with the Aβ content of the brain (Fig. 6B). Although we could not conclude whether the uronic acid pathway is accelerated or inhibited in AD, to the best of our knowledge, alteration of the uronic acid pathway function has not previously been reported in the AD brain. Interestingly, the levels of ascorbic acid were higher in the AD brains, a finding that was inconsistent with a previous report [22]. Considering the antioxidant properties of ascorbic acid, this modulation might represent a compensatory response [23]. Products of the uronic acid pathway enter the pentose phosphate pathway, which produces nucleic acids. Associations of metabolites of the pentose phosphate pathway with AD differed among metabolites; the levels of ribose 5-phosphate, a general intermediate of the pentose phosphate pathway, and uridine were lower, while those of ureidosuccinic acid, an intermediary product in pyrimidine biosynthesis, and thymidine were higher, in the AD brains (Fig. 1N–S). The mRNA levels of carbamoyl-phosphate synthetase 2, which produces ureidosuccinic acid, and ribose 5-phosphate isomerase A were not modulated (Fig. 5C), which could not explain the modulations of these metabolites. Since the pentose phosphate pathway is important for oxidative catabolism [24, 25], its functioning has been speculated as being altered in the AD brain. Our present results, however, suggest that the altered functioning of the pentose phosphate pathway may be heterogeneous. From the biological aspect, thymidine suppresses microglial activation and reduces oxidative stress [26] and ribose 5-phosphate could react with Aβ, which might result in neurotoxicity [27]. Although the precise underlying mechanisms remain unknown, the results of our comprehensive analyses have revealed, for the first time, the importance of ureidosuccinic acid and dihydrouracil in the pathogenesis of AD (Fig. 7D). Especially, dihydrouracil levels were reportedly higher in the postmortem cerebrospinal fluid samples of AD patients [28], suggesting the possibility that the impaired secretion of dihydrouracil might be involved in the pathogenesis of AD.
The associations between fatty acid metabolism and AD have been rather well studied. Decreased DHA levels in AD brains have been reported by several studies [1, 29]; this finding was also replicated in the present study by our metabolomics analysis conducted using a GC-MS method (Fig. 2Q). Modulations of the saturated fatty acid levels in AD remain controversial; while one study demonstrated decreased levels of saturated fatty acids [13], another reported elevated levels of saturated fatty acids [30, 31] in the AD brains. The results of the present study were concordant with the latter report (Fig. 2I–K, M, R). The mRNA levels of acetyl-CoA carboxylase and carnitine palmitoyltransferase 1A were not modulated (Fig. 5E). Considering the lipotoxicity of saturated fatty acids [32], elevated levels of saturated fatty acids might be involved in the pathogenesis of AD, although one basic research suggested the possibility that lauric acids could stabilize Aβ oligomers [33] and attenuate neuroinflammation [34]. Among saturated fatty acids, our neural network analysis identified margaric acid as an important metabolite (Fig. 7D). Epidemiologically, intake of margarine seems to be positively associated with AD [35–37]. Although the associations of the biological properties of margaric acid with AD has never been reported previously.
Modulations in the levels of amino acids in the AD brains depended on the metabolites. The mRNA levels of SLC7a5, which is an amino acid transporter and reported to be elevated in an AD model mouse [38], were lower in the Cerad-B brains in the present study (Fig. 5F). The levels of serine, glycine, and phenylalanine were lower in the AD brains (Fig. 3A, B, P). The mRNA levels of PSPH, which is involved in serine production, were lower in the AD brains (Fig. 5F), which could explain the decreased levels of serine in the AD brains. Especially, our enrichment analyses suggested that serine and glycine might be important, even from the early stage, in the pathogenesis of AD and that phenylalanine might be important in the later phases (Supplementary Figures 2 and 3). The decrease in glycine levels was consistent with a previous report [39]. A previous study reported elevation of the brain serine levels in the AD brain [40], and our finding on the brain serine levels in the present study was inconsistent with this report. With regard to the metabolism of phenylalanine, the levels of phenylalanine were decreased, while those of phenylacetic acid, a metabolite of phenylalanine, were increased, suggesting that phenylalanine catabolism might be accelerated in AD. A previous study found that the phenylalanine levels were higher in the AD brain [41], and our observation was inconsistent with this report, although the reasons for the discrepancy remained unknown. Some reports demonstrated that phenylalanine functions as NMDAR co-agonists, which could result in NMDAR-mediated excitotoxicity [42–44], while others demonstrated that phenylalanine derivatives antagonize NMDAR [45, 46], which might result in the suppression of NMDAR-mediated excitotoxicity. We also observed elevated levels of aspartic acid, norvaline (valine precursor), N6-acetyllysine (lysine derivative), pimelic acid (lysine precursor), tyrosine, indol-3-acetic acid (tryptophan precursor), and dihydrouracil (alanine metabolite) in the AD brains (Fig. 3D, I, J, M, N, O, R, S). Modulation of the levels of aspartic acid in AD has been under debate [47, 48] and it has been suggested that aspartic acid might act as an NMDAR agonist. Although this is the first study to show modulation in the levels of norvaline in the AD brain, several studies have demonstrated that norvaline protects against the pathogenesis of AD by inhibiting arginase [49, 50]. In addition, the levels 3-hydroxyisobutyric acid, a metabolite of valine, were also higher in the AD brains. One previous study suggested that 3-hydroxyisobutyric acid could inhibit energy metabolism in the rat brain [51]. Although no modulation in the levels of lysine itself was observed, the levels of its metabolites, N6-acetyl-lysine and pimelic acid, were higher in the AD brains. Although the significance of these lysine-related metabolites remains unknown, lysine has been reported as being associated with tauopathy [52]. Tyrosine phosphatase has been demonstrated to be activated in the AD brain [53], whereas no modulations of the brain levels of tyrosine have been reported until date. Indole-3-acetic acid, a precursor of tryptophan, has been reported to inhibit the fibrillation process of Aβ, which might protect against AD [54]. To summarize, considering the proposed biological properties of these amino acids, the brain levels of serine, glycine, phenylalanine, norvaline, and indole-3-acetic acid might be modulated to preserve homeostasis, while modulations of the levels of aspartic acid, 3-hydroxyisobutyric acid, N6-acetyl-lysine, and pimelic acid might have a role in promoting the progression of AD. The significance of tyrosine and dihydrouracil remains uncertain according to previous literature.
Our correlation studies (Fig. 6), enrichment analyses (Fig. 7A), and PLS-DA (Fig. 7C, Supplementary Figure 3) identified the inositol pathway and its metabolites as being important in the pathogenesis of AD. Our finding of elevated inositol levels in the AD brain was concordant with a previous report [55], while the mRNA levels of enzymes involved in inositol pathway could not explain the modulations of inositol or inositol phosphate in the AD brains (Fig. 5G). Inositol phosphate regulates tau phosphorylation [56], while inositol has been reported to prevent fibrillation of Aβ, insulin resistance, and oxidation [57]. Considering these properties, the elevated levels of inositol and decreased levels of inositol phosphate might be compensatory responses in the pathogenesis of AD, and not have a role in the causation of AD.
We also observed modulations in the levels of other metabolites, many of which have never been reported previously as being modulated in AD. The levels of 2-aminoethanol were higher in the AD brain and were positively correlated with the clinical phenotypes (Figs. 4M, 6A). Although we could not determine the plasmalogen type separately, the levels of the plasmalogen type of 2-aminoethanol have been reported to be lower in AD brains [58, 59], which seems inconsistent with our observation in the present study. 2-aminoethanol might protect against Aβ toxicity by inhibiting its aggregation [60, 61]. 2-aminoisobutyric acid, levels of which were higher in AD brains (Fig. 4R), has been proposed to possess anti-apoptotic activity [62] and a glutathione-replenishing property [63], in addition, 4-hydroxybutyric acid, whose levels were also higher in AD brains (Fig. 4L), has been demonstrated as a GABA receptor agonist[64, 65], potentially protecting against the pathogenesis of AD, since GABA receptor agonists are generally associated with inhibitory effects [66]. Catechol and fendiline, levels of which were higher in the Cerad-b brains (Fig. 4F, I), might protect against AD through their antioxidant properties [67], however, modulation of their levels in the AD brain has never previously been reported. Hydroquinone, whose levels were lower in the Cerad-b brains (Fig. 4J), has been proposed as a therapeutic target for AD because of its anti-amyloid [68] and antioxidant [69] properties. Rhamnose, levels of which were higher in the AD brains (Fig. 4S), might protect against AD by inhibiting the aggregation of Aβ [70] and forming free-radical scavengers [71, 72]. Coniferaldehyde, whose levels were higher in both the Cerad-b and AD brains (Fig. 4C), might attenuate Aβ toxicity [73]. 3,4-Dihydroxybenzylamine, levels of which were higher in the AD brains (Fig. 4N), might also dissociate Aβ oligomers [74]. Intake of glucosamine, levels of whose levels were elevated in the Cerad-b and AD brains (Fig. 4D), has been reported to protect against dementia [75]. Pyridoxamine, levels of which were higher in the Cerad-b and AD brains (Fig. 4E), has been shown to prevent aggregation of Aβ [76]. The biological properties in relation to the pathogenesis of AD have not been reported for tropic acid, erythrulose, 1,6-anhydroglucose, ribonic acid, 1,5-anhydro-glucitol, isomaltose, and 3-hydrosebacic acid.
One of the limitations is possible postmortem effects on metabolites. Although we could not completely elucidate the postmortem effects, we tried to investigate the postmortem changes in metabolites by leaving murine brains at 4°C for 24 h. As shown in Supplementary Table 3, no significant changes in metabolites were observed up to 24 h after the sacrifice of the mice. Therefore, we think that the contents of metabolites in postmortem brains can represent those in antemortem brain at least to several degrees. Another limitation is that we could not examine metabolites in other regions of brain than cortex. To conclude the significance of the changes in metabolites in the pathogenesis of AD, it is necessary to demonstrate it in various brain regions. In addition, since this was an observational study conducted on a rather small number of subjects, understanding the detail mechanisms with further basic studies and clinical studies is needed. Although we investigated the modulation of mRNA levels of several key enzymes, the investigation on the protein levels of enzymes involved in metabolic pathways would be more helpful to understand the disturbed metabolism in the pathogenesis of AD in the future study. However, comprehensive studies on the metabolites in the brain of AD has been limited and we believe that this approach is important since the modulations of metabolites in the brains of AD might support the further investigation on the potential significant roles of the metabolites in the pathogenesis of AD from the aspects of translational research. Especially, considering the proposed biological properties, aspartic acid, 3-hydroxyisobutyric acid, N-acetyl-lysine, pimelic acid, saturated fatty acids, 4-hydroxybutyric acid, and hydroquinone might be modulated in direction of progression of AD and therefore serve as therapeutic targets for AD. Further basic studies on the roles of these metabolites in the pathogenesis of AD are desired.
In summary, in the present study, the results of the comprehensive metabolomics analyses of postmortem brains not only confirmed disturbances in the brain metabolism in AD that have been reported previously, but also revealed many novel metabolites in the human brain as being potentially associated with AD (Fig. 8). Especially, we obtained evidence for the involvement of impaired phosphorylation of glucose, rather than impaired uptake, in the disturbed metabolism of glucose in AD, and of disturbed activity of the inositol phosphate pathway in the AD brain. We also identified the potential involvement of some novel metabolites such as ureidosuccinic acid and dihydrouracil, and of some metabolic pathways such as the uronic acid pathway, in AD. Our hope is that identification of metabolites showing modulation in the brains of AD patients might provide some impetus for the development of novel therapeutic targets for AD in the future.
Footnotes
ACKNOWLEDGMENTS
The authors have no acknowledgments to report.
FUNDING
This work was supported by JSPS KAKENHI Grant Number 20H03573 (M.K.), the Takeda Science Foundation (M.K.), AMED JP21wm0425019 (Y. S.), and JSPS KAKENHI JP22H04923 (CoBiA) (Y. S.).
CONFLICT OF INTEREST
The authors have no conflict of interest to report.
DATA AVAILABILITY
All the data are included in the manuscript and Supplemental Materials. The raw data is shown in the Supplementary data set. The datasets generated or analyzed in the current study will be made available upon reasonable request. All the materials used for the study are commercially available.