
Abstract
Background:
Traumatic brain injury (TBI) and posttraumatic stress disorder (PTSD) are potential risk factors for the development of dementia including Alzheimer’s disease (AD) in later life. The findings of studies investigating this question are inconsistent though.
Objective:
To investigate if these inconsistencies are caused by the existence of subgroups with different vulnerability for AD pathology and if these subgroups are characterized by atypical tau load/atrophy pattern.
Methods:
The MRI and PET data of 89 subjects with or without previous TBI and/or PTSD from the DoD ADNI database were used to calculate an age-corrected gray matter tau mismatch metric (ageN-T mismatch-score and matrix) for each subject. This metric provides a measure to what degree regional tau accumulation drives regional gray matter atrophy (matrix) and can be used to calculate a summary score (score) reflecting the severity of AD pathology in an individual.
Results:
The ageN-T mismatch summary score was positively correlated with whole brain beta-amyloid load and general cognitive function but not with PTSD or TBI severity. Hierarchical cluster analysis identified five different spatial patterns of tau-gray matter interactions. These clusters reflected the different stages of the typical AD tau progression pattern. None was exclusively associated with PTSD and/or TBI.
Conclusions:
These findings suggest that a) although subsets of patients with PTSD and/or TBI develop AD-pathology, a history of TBI or PTSD alone or both is not associated with a significantly higher risk to develop AD pathology in later life. b) remote TBI or PTSD do not modify the typical AD pathology distribution pattern.
INTRODUCTION
Traumatic brain injury (TBI) and posttraumatic stress disorder (PTSD) have been identified as potential risk factors for the development of dementia including Alzheimer’s disease (AD) in later life. Considering that TBI acutely upregulates processes tightly linked to AD pathology such as amyloid precursor protein synthesis, tau hyperphosphorylation and microglial activation, the assumption that these acute TBI sequelae predispose to AD in later life is well justified [1, 2]. Several studies that used data derived from large administrative databases, e.g., national health record systems, found a clear association between mild–severe TBI with dementia in general [3–12]. The results regarding the association of TBI with AD were inconsistent though [3–12]. The same was also true for autopsy studies investigating the TBI–AD association [13–16]. Similar inconsistencies also exist for PTSD as an AD risk factor. Studies in animal models of PTSD suggested a mechanistic link between PTSD and AD by showing that the stress mediator corticotropin releasing factor increases tau phosphorylation and amyloid-β (Aβ) levels [17–19]. In keeping with that, several studies using data from administrative databases showed that PTSD poses an increased risk for dementia [20–25] including AD [26]. Other studies, however, were neither able to confirm the association of PTSD with AD nor to find an association of PTSD with dementia in general [27–29]. To some degree these controversies can be explained by limitations inherent to administrative databases and autopsy studies. These studies are usually retrospective and the diagnoses of PTSD, TBI and dementia are based on clinical observations translated into diagnostic codes that are often different across studies and do not account for cases with subclinical PTSD or mild TBIs not necessitating medical assessments. In recent years though, the availability of new PET tracers that allow for prospective cross-sectional and longitudinal in vivo measurements and mappings of tau and Aβ brain loads combined with standardized research questionnaires able to capture systematically cognitive performance and different degrees of PTSD and TBI, has eliminated many of these limitations.
Several prospective and even longitudinal studies in at risk populations tried to exploit the advantages of Aβ and tau PET imaging but they too had inconsistent outcomes. Mohamed et al. [30] and Scott et al. [31] for example found regionally increased Aβ binding using AV45 and C13PIB PET in participants with remote, i.e., more than 1 year since incident, TBI compared to participants without history of TBI. Studies by Asken et al., [32], Turk et al., [33], Weiner et al., [34, 35], Risacher et al. [36], and Cummins et al. [37], however, found no differences between participants with remote TBI and those without TBI. Two studies that used the AV1451 PET tau tracer (AV1451) to investigate tau deposits in TBI found similar patterns of increased tau binding in participants with remote TBI [36, 38]. Weiner et al. [35] and Cummins [37], however, also using AV1451 PET found no differences between the two groups. The few studies done in PTSD had also inconsistent findings. Mohamed et al. [30, 38] found increased AV45 and AV1451 in PTSD while Elias et al. [39] and Weiner et al [34, 35] found no differences for both tracers in their studies. Prieto et al. [40] found a significant association of PTSD severity with cognitive decline after adjusting for AD biomarkers. However, Marcolini et al. [41] found that the cognitive decline in participants with PTSD was not different from those without despite the former showing worsening white matter integrity over time. These inconsistencies are even more remarkable when considering that some of these studies used data from the same data repository, i.e., the DoD ADNI data repository [30, 41].
Different PET processing and/or analysis techniques, e.g., voxel-based versus ROI-based, different reference regions, co-registration approaches, etc., could have contributed to some of these inconsistent findings. However, the fact that the approaches used in these studies are routinely employed in AD PET studies where they reliably detect the well-established tau and Aβ binding patterns, makes it unlikely that methodological differences alone are responsible for these inconsistencies. Another potential explanation is that TBI and PTSD modify the tau and Aβ distribution patterns so that methods optimized to detect the typical Braak tau and Aβ patterns fail. Finally, it is also possible that there exist subsets of patients with remote TBI or PTSD who have a higher risk to develop AD pathology than other patients with the same history and that the percentage of these high risk patients in the study population determines if an association of TBI or PTSD with AD pathology can be found or not.
To investigate these alternative explanations, this study used a modification of the T-N mismatch metric introduced by Das et al. [42] that is based on NIA-AA A-T-(N) framework [43] where A stands for Aβ plaques, T for tau pathology, and N for neurodegeneration. The T-N mismatch metric is a summary score that is derived by counting in each individual brain those regions where gray matter atrophy (dependent) was either at least 1.5 standard deviations above or below that expected by local tau load (independent) in a robust regression analysis. By combining the T-N mismatch metric with hierarchical cluster analysis Das et al [42] identified different regional gray matter atrophy patterns with similar global tau burdens that are thought to represent different phenotypes in cognitively impaired and demented Aβ positive subjects. PTSD and remote TBI are known to affect gray matter differently. PTSD preferentially affects regions involved in emotion control, e.g., cingulate, orbitofrontal, dorso-lateral frontal, and mesial frontal cortices, etc., which results in a PTSD typical pattern of gray matter loss at the individual level that is also found at the group level [44]. In contrast, gray matter abnormalities in TBI are determined by the strength and direction of the forces impacting the brain during the incident which means there exists no typical TBI pattern of gray matter loss at the individual level which results in a diffuse gray matter loss at the group level [45, 46]. This project therefore calculated an age corrected gray matter tau mismatch score (ageN-T mismatch score) for which the dependent and independent variable of the T-N mismatch score were interchanged so that this score describes how age corrected regional gray matter atrophy (independent) predicts regional tau load (dependent). As done by Das et al. [42], a hierarchical cluster analysis was used to identify different regional patterns of tau depositions that had similar degrees of age associated global gray matter atrophy. This information was then used to investigate to what degree the two alternative explanations (atypical tau distribution pattern, vulnerable subgroups) contribute to the inconsistent findings by addressing the following specific questions: 1) Does the modified ageN-T mismatch score indeed capture AD pathology in accordance with the A-T-N framework? If yes, the ageN-T-mismatch score should be significantly positively associated with whole brain Aβ load and with cognitive impairment. 2) If PTSD and TBI indeed modify the typical AD tau Braak stages, the modified pattern is best observed in clusters with high ageN-T mismatch scores. 3) If the assumption that only a subset of high risk TBI and PTSD patients develops AD pathology is correct, then the cluster analysis should identify three high ageN-T mismatch score clusters. One that consists of patients with remote TBI, one that consists of patients with PTSD and one that consists of patients with both remote TBI and PTSD.
MATERIALS AND METHODS
Participants
The project used completely anonymized data from the DoD ADNI and ADNI data repository. Studies using anonymized data from data repositories where it is not possible to ascertain the subject’s identity are considered non-human subject studies and exempt from UCSF IRB review.
The majority of the data used in this project came from the DoD ADNI data repository (n = 89). The DoD ADNI project acquired MRI and PET to investigate if non-penetrating TBI and/or PTSD resulting from military service and other traumata increase the risk for later dementia in Vietnam Veterans aged 60 to 80 years [47]. DoD ADNI participants in this study were selected from the whole DoD ADNI population based on the following criteria: 1) availability of pre-processed (cf MRI and PET processing) AV1451 PET scan at the end of 2020 (number (no) of participants fulfilling requirement = 122); 2) availability of a preprocessed AV45 PET scan (no of participants fulfilling requirements 1&2 = 120); 3) availability of a good quality T1 weighted image(s) acquired within 6 months of the AV1451 and of the AV45 PET (no of participants fulfilling requirements 1–3 = 99); 4) availability of resting state fMRI (no of participants fulfilling requirements 1–4 = 93; 5) “Pass” rating of all image processing steps (no of participants fulfilling requirements 1–5 = 91; 6) Complete TBI information (see below) and CAPS scores (no of participants fulfilling requirements 1–6 = 89). All DoD ADNI participants had undergone medical and neurological examinations and an extensive cognitive and mental health testing battery. From these, the Alzheimer’s Disease Assessment Scale –cognitive subscale (ADAS-cog) was selected as a measure of cognitive dysfunction and the Clinician-Administered-PTSD Scale for DSM 4 (CAPS) and the Geriatric Depression Scale (GDS) closest to the AV1451 PET were used to assess current and lifetime PTSD and depression. A CAPS current of ≥30 (CAPS < 30 used as threshold to define CON in DoD ADNI according to ClinicalTrial.gov) was used to identify participants suffering from PTSD. TBI history was assessed with a structured interview (summarized in table RECTBIINJ.csv) that captured the number of non-penetrating TBIs over lifetime (before, during, and after military service) and scored each instances severity based on need for hospitalization and presence or absence and duration of confusion or disorientation, memory gaps, loss of consciousness. To avoid the need for an arbitrary threshold to distinguish between participants with and without TBI and to account for TBI severity as well as repetitive TBIs with different severity, the information in RECTBIINJ was used to calculate two continuous TBI variables. 1) Total number of lifetime non-penetrating TBI (npTBIcount), and 2) TBI severity score (npTBIseverity = no TBIs with loss of consciousness + no TBIs with hospitalization) at the time of the AV1451 scan. A npTBIcount > 0 was used to identify participants with a history of TBI.
Only 17 of the 89 DoD ADNI participants fulfilled the criteria of a typical aging control, i.e., were Aβ negative, cognitively intact (CDR-SOB = 0) and had neither PTSD nor TBI. To increase the number of typically aging controls, 37 cognitively intact (CDR-SOB = 0), amyloid negative subjects without a history of mood disorder or traumatic brain injury who had ADAS-cog scores and the same type of imaging data as the DoD ADNI subjects were randomly selected from the ADNI3 data repository. ADNI 3 is the continuation of the longitudinal ADNI project launched in 2004 that aims to identify biomarker(s) allowing for an early and accurate AD diagnosis and efficient monitoring of potential AD treatments [48]. Because they had not been formally assessed for PTSD (no CAPS) or TBI history (no TBI severity scores) these ADNI3 subjects were only used to enrich the planned cluster analysis. Please see Table 1 for details.
Demographics
MMSE, Mini-Mental State Examination; ADAS-cog, cognitive sub-scale of Alzheimer’s Disease Assessment Scale, npTBI, non-penetrating traumatic brain injury; CAPS, Clinician-Administered-PTSD Scale; GDS, Geriatric Depression Scale; CDR-SOB, Clinical Dementia Rating scale sum of boxes, information for one subject not in database.
MRI and PET acquisition
The ADNI3 and DoD ADNI MRI and PET imaging data were acquired with the same harmonized protocol across all participating sites that had been optimized to provide comparable images from different platforms from Siemens, Philips, and General Electric. The harmonization strategy and quality controls are described in detail in Mueller et al. [46]. The 3T T1 weighted MPrage sequence with TR/TE/TI 2300/2.95/900 ms, sagittal, 1.1×1.1×1.2 mm resolution was used for this project. The AV1451 PET consisted of a continuous 30 min brain scan (six 5 min frames) starting 75 min after the injection of 10 mCi of the tau tracer AV1451. The AV45 PET was acquired 50 min after an injection of 10 mCi of the amyloid beta tracer AV45. All PET images were downloaded fully preprocessed (“coreg_avg_std_img_and_Vox_size_uniform_resolut-ion”) from the DoD ADNI and ADNI data repository.
MRI Processing
The T1 weighted image underwent tissue segmentation with CAT12.7 (http://www.neuro.uni-jena.de/cat), a toolbox implemented into the SPM12 (https://www.fil.ion.ucl.ac.uk/spm/) software package. CAT12 performs a bias correction, spatial normalization to the MNI space using the shooting algorithm [49] and tissue segmentation into gray and white matter and cerebrospinal fluid [50]. CAT12 segmentation accounts for partial volume effects [51] by applying adaptive maximum a posteriori estimations [52] and using a hidden Markov Random Field model [53]. It also calculates intracranial volume and total white matter hyperintensity volumes. The tissue maps were modulated and corrected for intracranial volume. 94 cortical and subcortical (hippocampus, amygdala, ncl. accumbens) gray matter volumes were extracted from the modulated gray matter map using the regions of interest (ROI) of the automated anatomical labeling atlas 3 (AAL3) [54]. Each subject’s total gray matter volume (total Gray) was calculated by summing up the 94 AAL3 gray matter ROI volumes.
PET processing
The pre-processed AV45 and AV1451 PET images were co-registered to the subject-space T1 weighted image using SPM’s coreg function. The transformation parameters from the spatial normalization of the T1 were applied to the co-registered PET images and the non-modulated gray and white matter tissue maps in subject space. The white matter map was thresholded at 0.9 and further eroded until only deep hemispheric white matter remained. The mean tracer uptake in that region was used as reference to generate whole brain Standard Uptake Value Ratio (SUVR) maps. The choice of deep white matter as reference instead of the more common cerebellum and/or cerebellar gray matter was motivated by two previous publications [30, 31] that had found increased cerebellar AV45 binding in TBI. The gray matter map was thresholded at 0.5 and the resulting mask used to restrict the extraction of the mean SUVR from each of the two PET images with the selected 94 AAL3 ROIs to pure gray matter regions. In analogy to gray matter volume, each subject’s whole brain Aβ (Aβ load) and whole brain tau load (tau load) was calculated by summing up the mean SUVR values from all 94 AAL3 cortical and subcortical ROIs. Considering that one objective of this project was to investigate if PTSD and TBI modify the typical AD Aβ and tau binding patterns, calculating whole brain Aβ and whole brain tau SUVRs instead of the in the AD field more common temporal or entorhinal meta-ROI SUVRs seemed more appropriate.
Modeling age corrected gray matter tau miss-match score: AgeN-T mismatch score
Individual gray matter loss tau-miss match scores were calculated using a modification of the approach introduced by Das et al. [42]. In a first step robust regression analyses with mean AV1451 SUVR in the ROI as dependent, gray matter volume in the ROI as independent and age as nuisance variable were used to model the relationship between tau and age corrected gray matter loss in each of the 94 selected AAL3 ROIs (F-tests corrected for multiple comparisons with Holm-Bonferroni q < 0.05). Each individual’s age corrected gray matter loss tau miss-match summary score (ageN-T mismatch score) was calculated by assigning all ROIs with a residual of at least 1.5 standard deviations above the fit line a 1, all ROIs with a residual of at least 1.5 standard deviations below the fit line a –1, all ROIs between –1.5 to 1.5 SD a 0 and calculating the sum. ROIs with residuals above the fit line represent ROIs with higher tau levels than expected based on age corrected gray matter volumes, i.e., gray matter volume loss is more likely to be driven by tau than by age or other factors. ROIs with residuals below the fit line however have lower tau levels than one would expect based on age corrected gray matter volume, i.e., gray matter loss is more likely to be driven by age or other factors than tau. A high ageN-T mismatch score therefore indicates that gray matter loss is mostly driven by tau and not by age or other factors and a low ageN-T mismatch score that gray matter loss is mostly driven by age and other factors and not by tau.
Cluster analysis
ROIs with residuals 1.5 standard deviations at or above or at or below the fit line were coded with 1 or –1 and all others with zero resulting in an atrophy/tau load array (NT array) for each subject. These NT arrays were concatenated across subjects resulting in a 94×126 matrix. Hierarchical clustering (Ward’s minimum variance method with Elbow criterion to determine the optimal cluster number) was used to identify 5 different clusters in this matrix.
Statistical analysis
In contrast to the previous sections, the analyses described here were restricted to the 89 DoD ADNI participants. Pearson correlations were used to investigate potential associations between ageN-T mismatch score and normally distributed data (total Aβ load, ADAS-cog, log transformed whole brain white matter lesion load (WML)) and Spearman rank correlations to investigate associations with non-normally distributed data (current and lifetime CAPS scores, npTBIcount, and npTBIseverity). Tukey-Kramer tests were used to detect differences of all normally distributed measures (total gray matter, tau and Aβ load, ADAS-cog), and the Steel Dwass method for non-normally distributed measures (GDS, CAPS scores, npTBI count, npTBIseverity) between the five Age N-T mismatch clusters.
RESULTS
Population
Table 2 summarizes the characteristics of the DoD ADNI subjects. 12 DoD ADNI participants had symptoms of current PTSD but had never sustained a TBI, i.e., were categorized as PTSD only, 31 had experienced at least one non-penetrating TBI but had a CAPS curr score < 30 and were categorized as TBI only, and 29 had experienced both and were categorized as PTSD&TBI. 17 DoD ADNI participants had neither a history of non-penetrating TBI nor a CAPS score indicating PTSD.
DoD ADNI Characteristics
*p < 0.05 PTSD more other groups. #p < 0.05 PTSD&TBI more than other group.
AgeN-T mismatch score: Associations with other variables
AgeN-T mismatch scores ranged from –81 to 77. They were positively associated with Aβ load (r = 0.56, p < 0.0001) and ADAS-cog (r = 0.22, p = 0.04) and negatively with WML (r = –0.22, p = 0.04). WML was positively associated with age (r = 0.21, p = 0.046) and negatively with total Gray (r=–0.44, p < 0.001). See Fig. 1. There were no significant associations of the ageN-T mismatch scores with CAPS current, CAPS lifetime, npTBI count or npTBI severity.
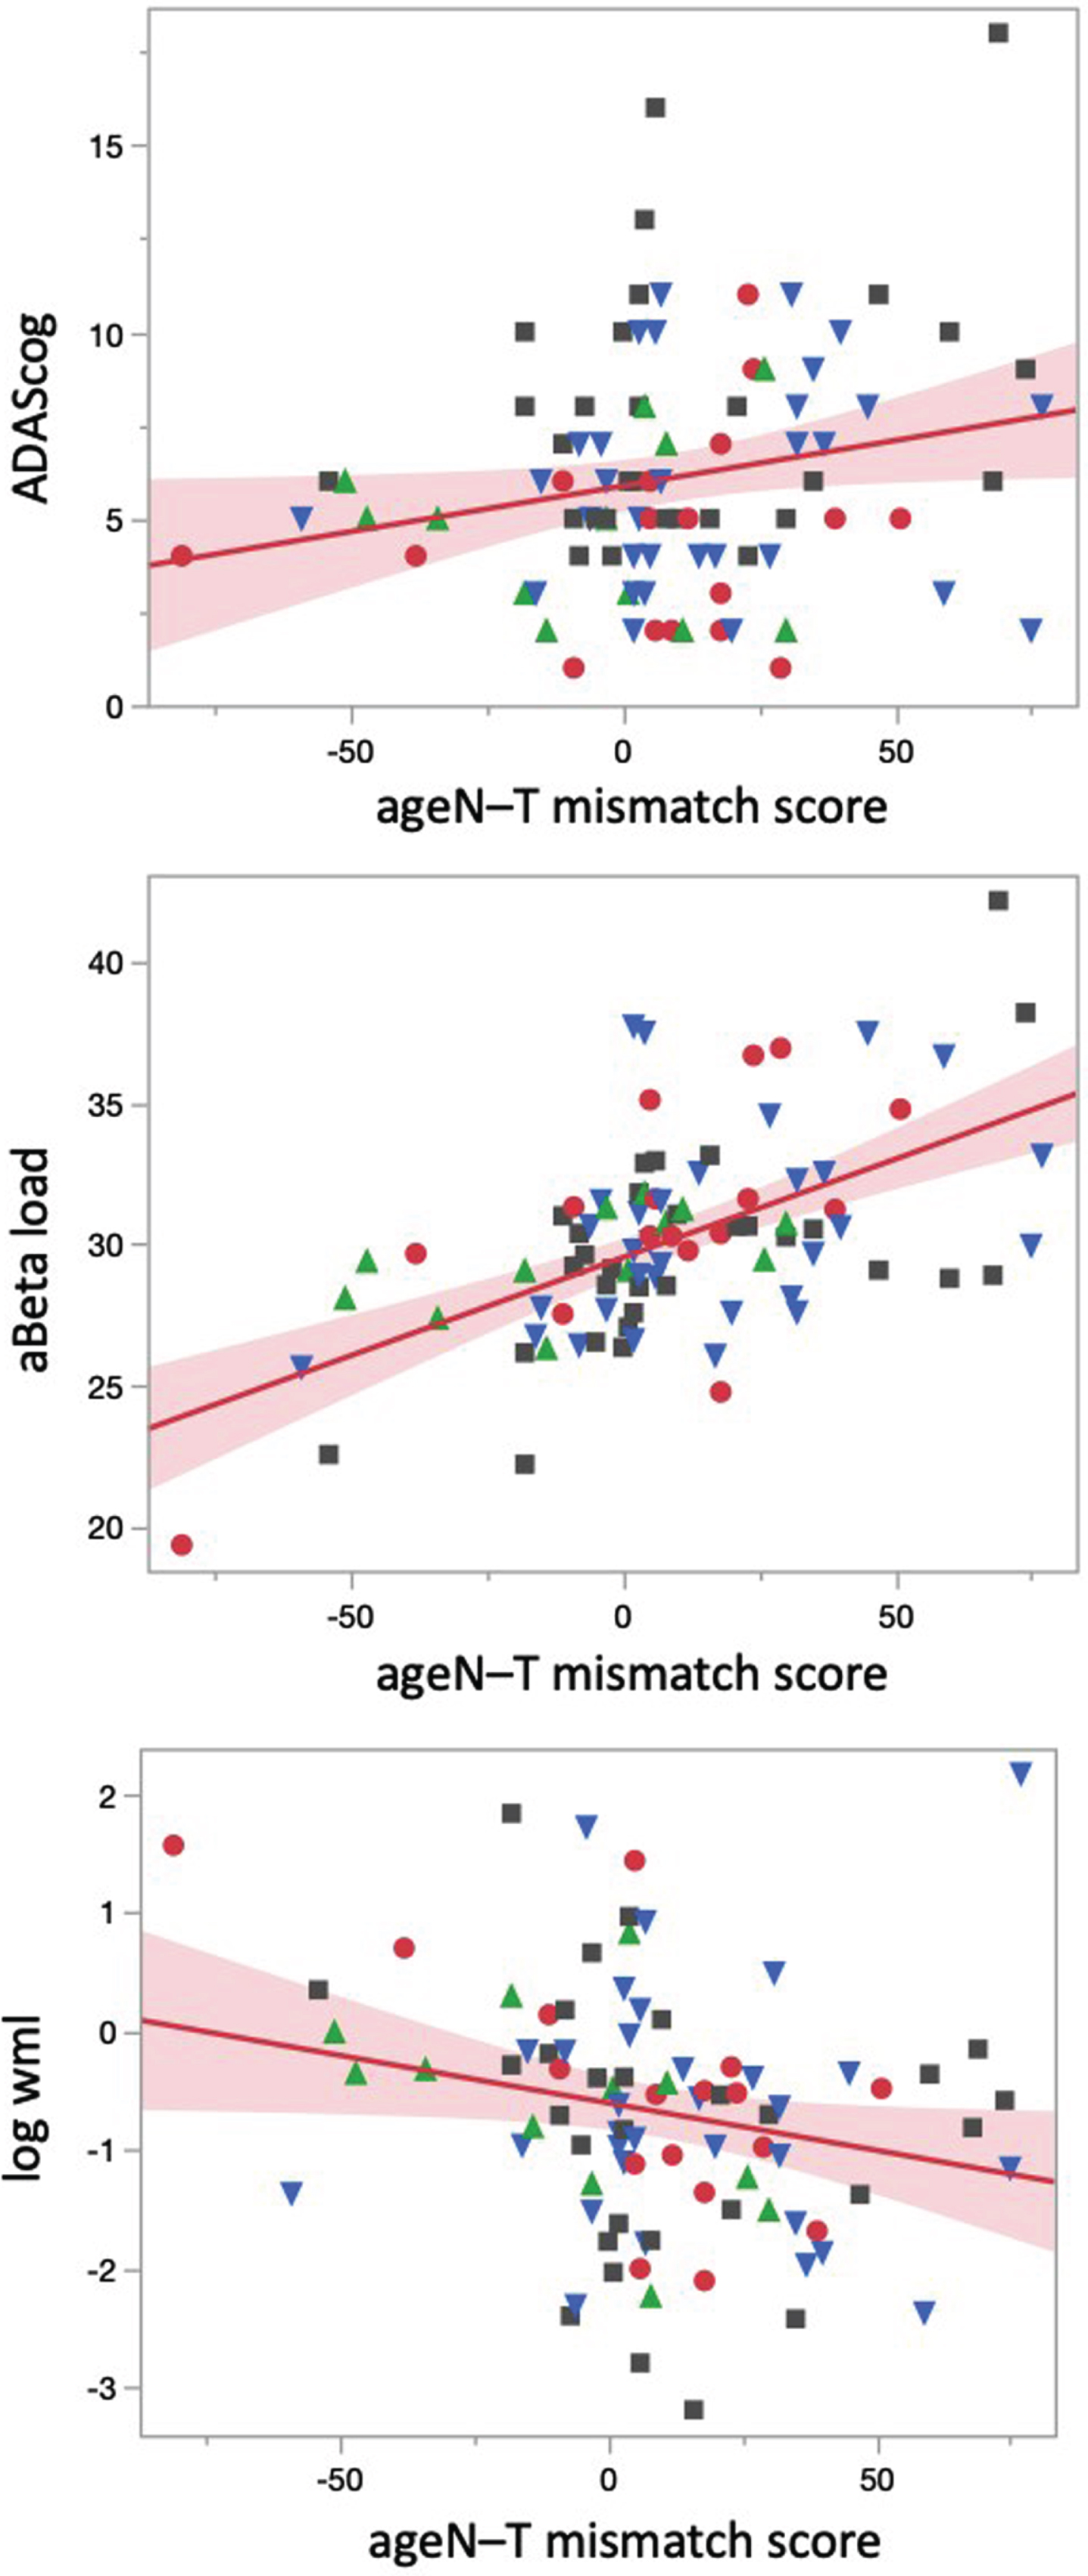
Relationship between age N-T mismatch scores with cognition, Aβ and white matter lesion load. Regression plots showing associations between ageN-T mismatch scores with ADAS-cog (upper panel), Aβ load (middle panel), and WML (log transformed). Blue triangles indicate patients with TBI, green triangles represent patients with PTSD, gray squares patients with TBI and PTSD and red dots represent patients without TBI or PTSD.
AgeN-T mismatch score: Cluster results
Figures 2 and 3 and Table 3 summarize the characteristics of the five clusters, please see supplementary material for detailed results
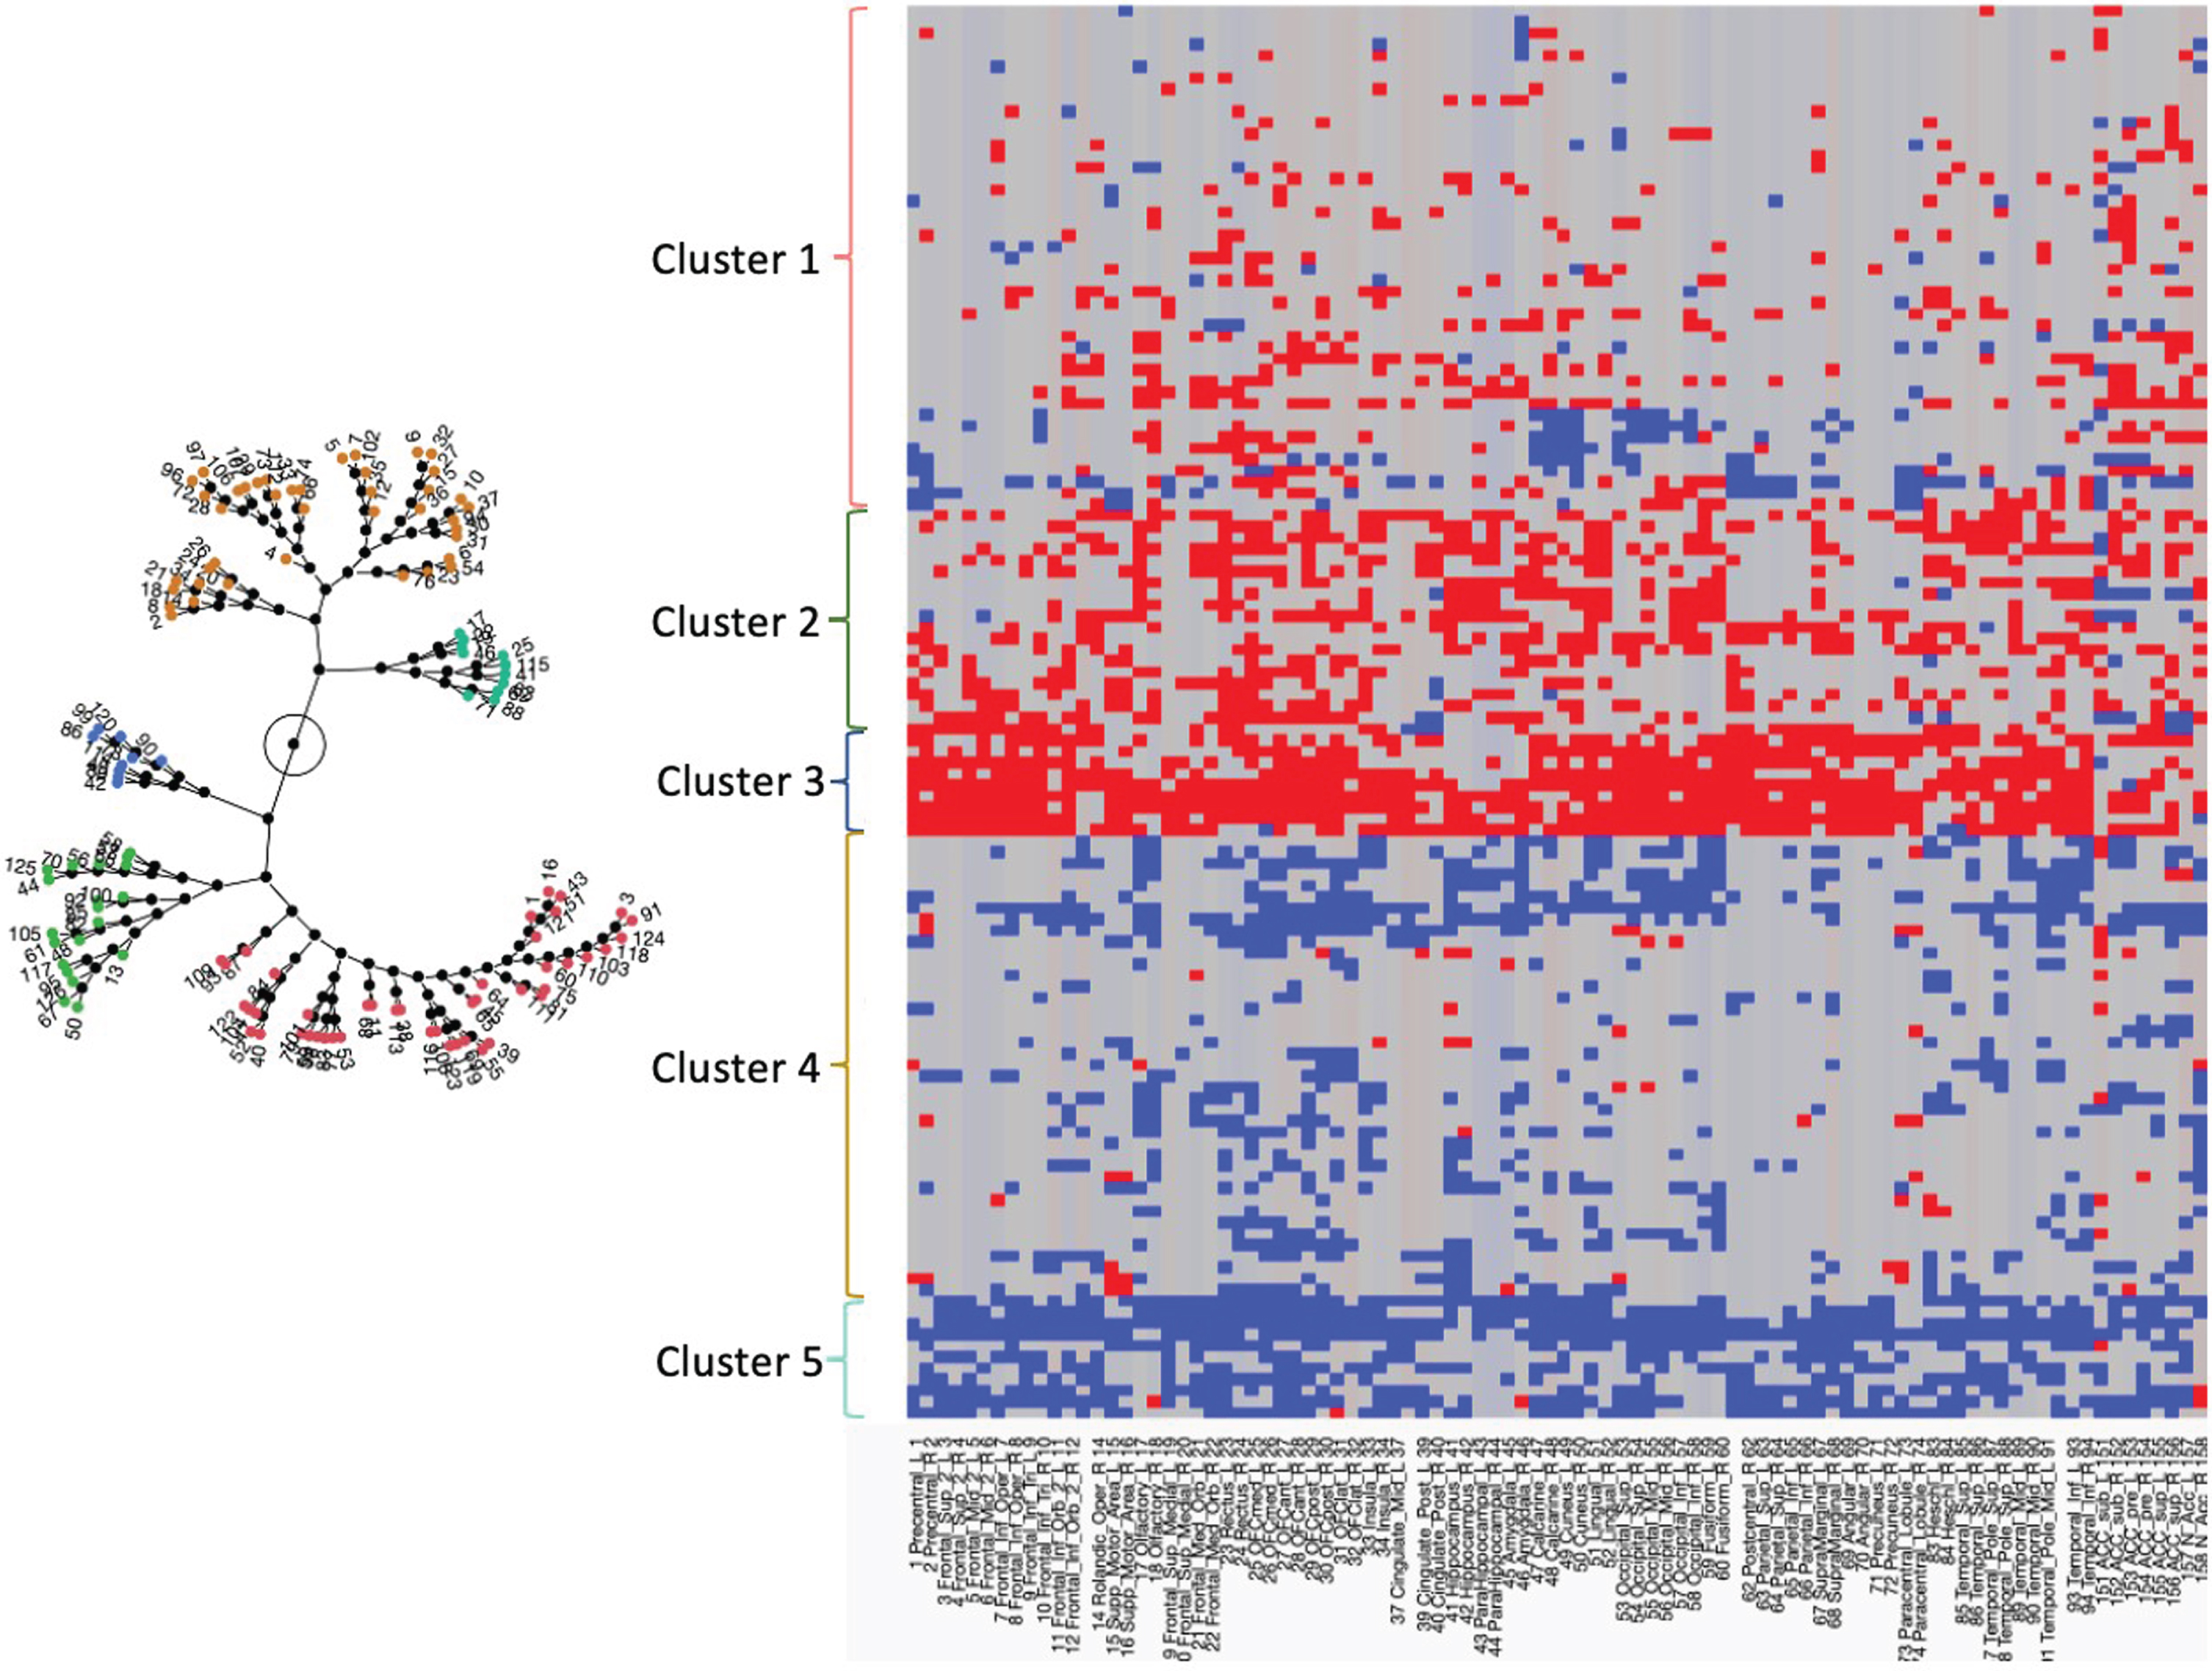
The constellation plot on the left side shows the five clusters. The circle represents the root of the constellation plot and the lines the distances of each cluster from the root. The graph on the right side shows the cluster results for each subject (rows) and region (columns). Residuals at least 1.5 SD below the fit line are in red and Residuals at least 1.5 SD above the fit line are in blue. Residuals within these boundaries are depicted in gray. The number of red residuals increases from Cluster 1 to 2 and reaches a maximum in Cluster 3.
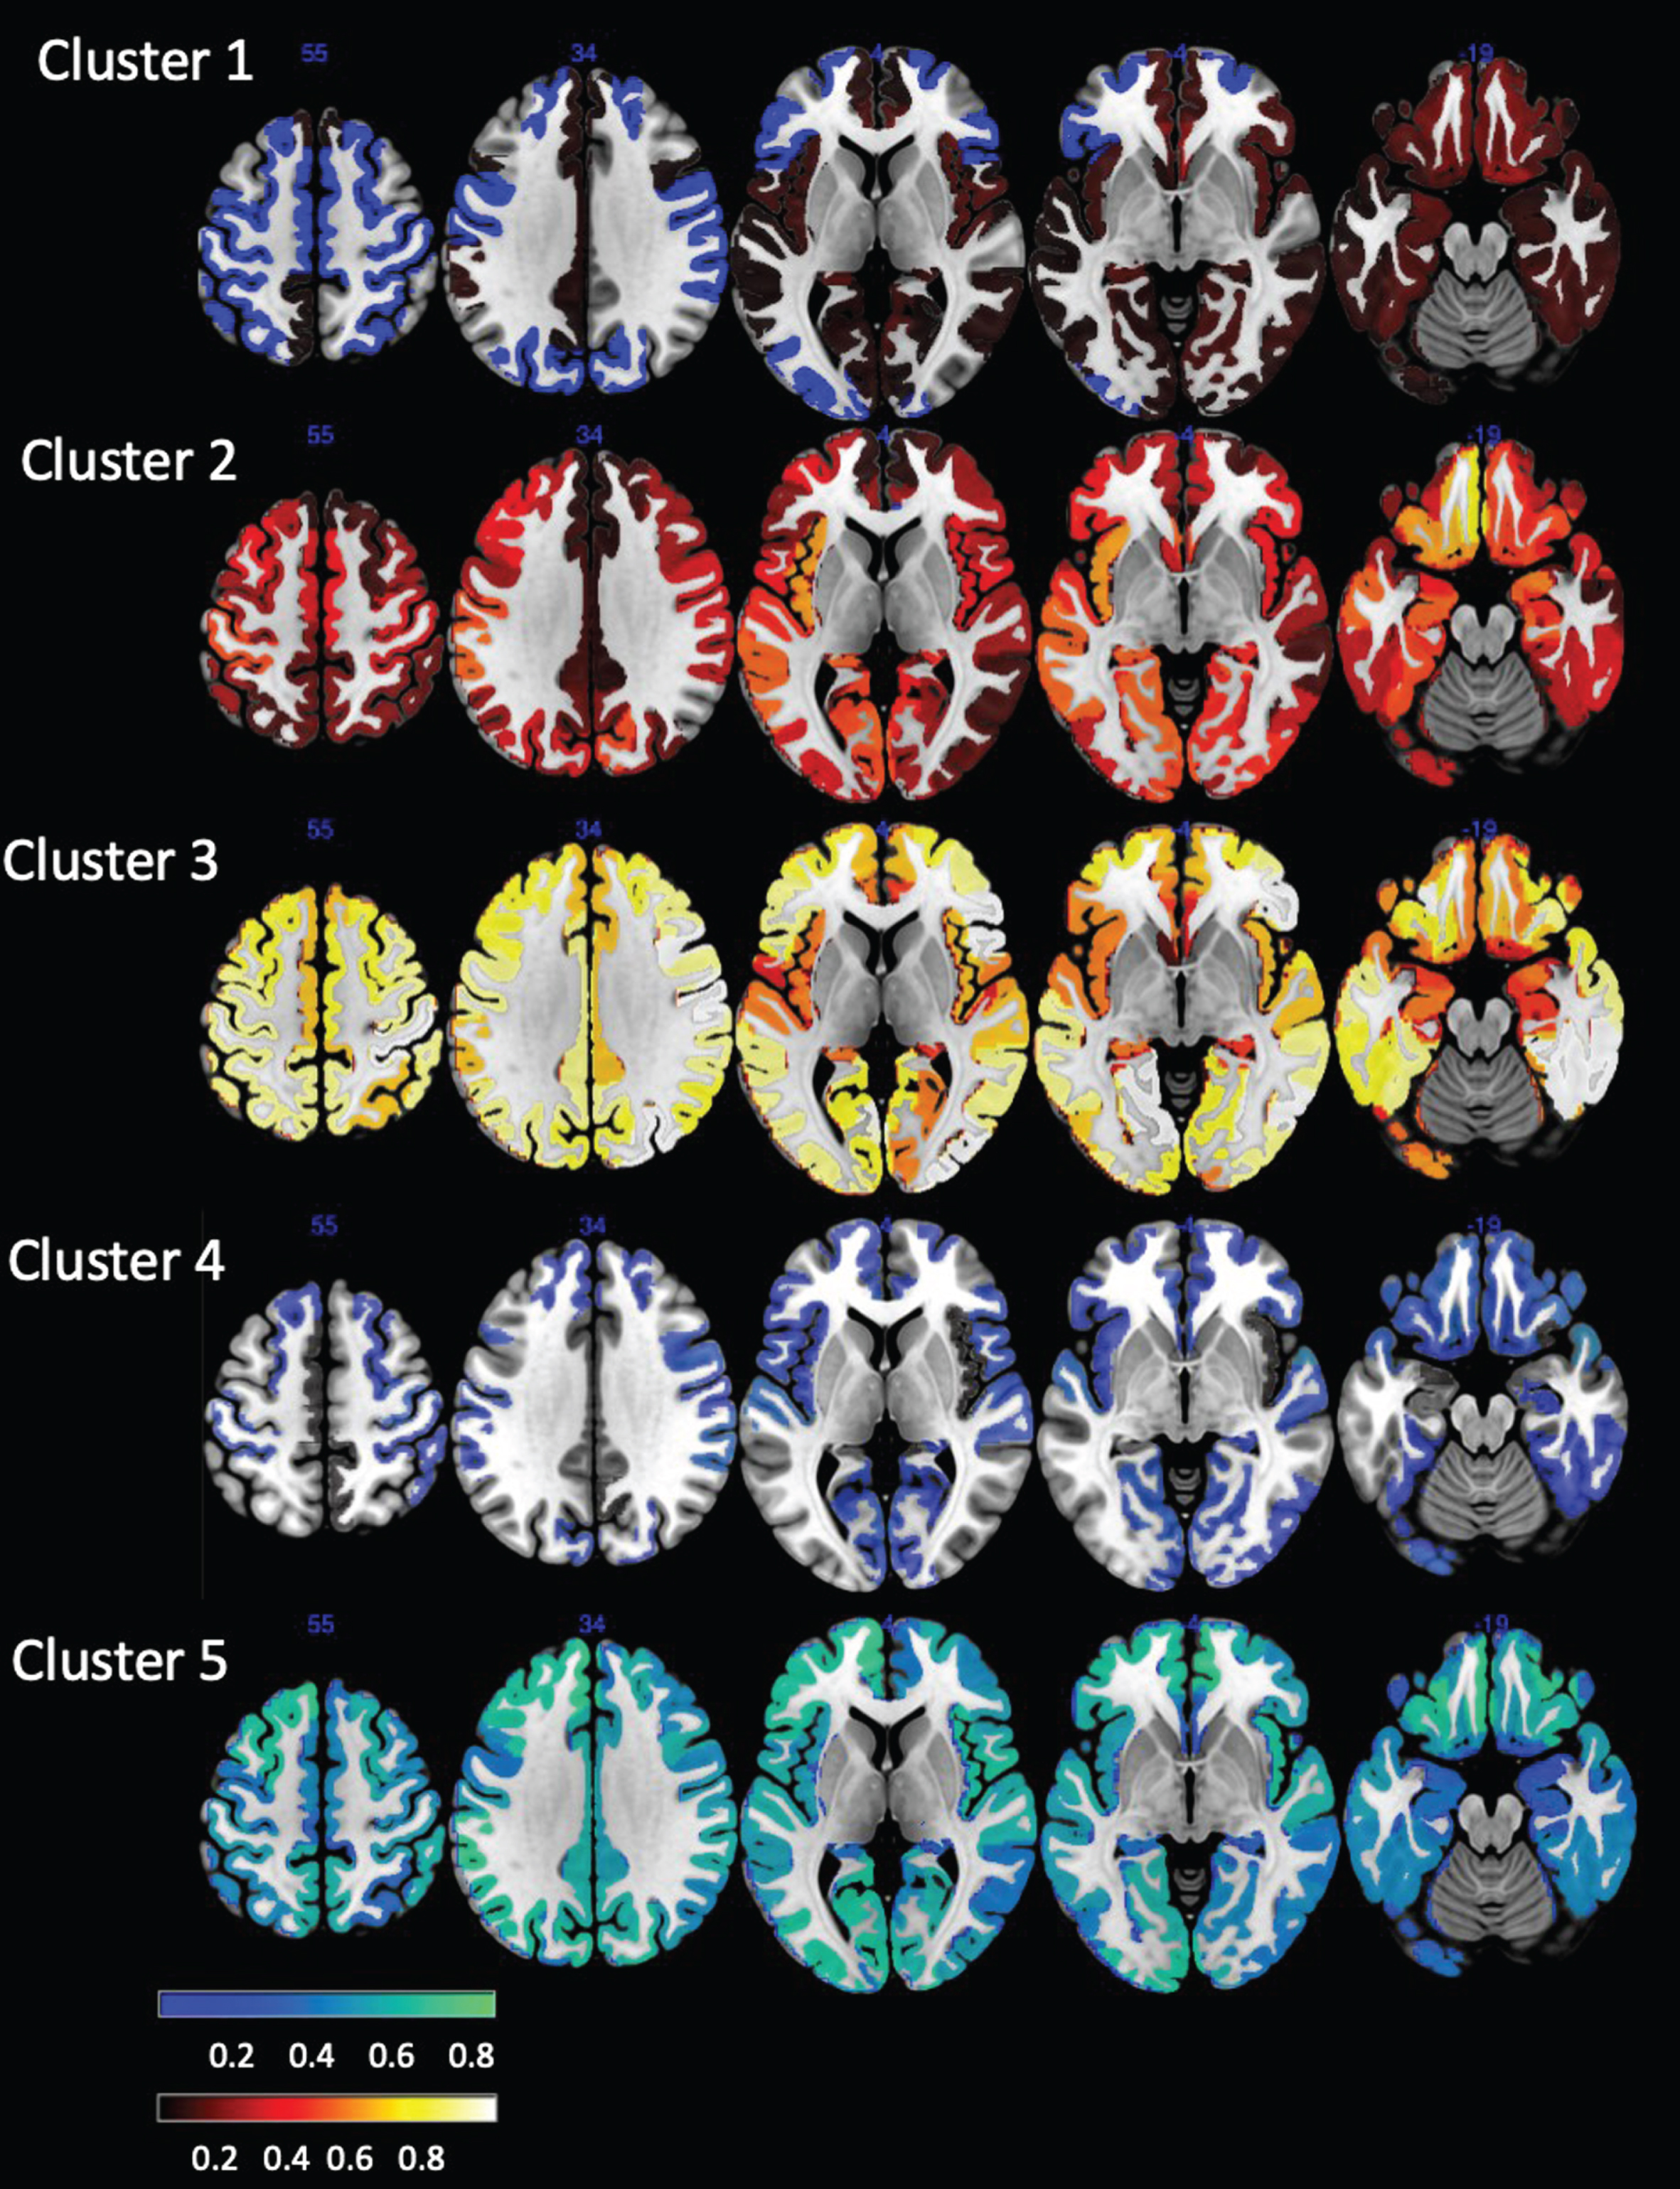
Cluster residual maps. The units represent the average counts of ≥1.5 SD residuals (hot) and ≤ 1.5 SD (blue) for a ROI found in the subjects assigned to this cluster. If all subjects in the cluster would meet the ≥1.5 SD residuals criterion or the ≤1.5 SD for a ROI the value would be 1, if none would meet this criterion, the value would be 0. An intuitive way to interpret these numbers is as percentages of subjects in a cluster in whom a particular ROI met the criterion.
Cluster Characteristics
*p < 0.05 each cluster different from all others. $p < 0.05 cluster 3 versus cluster 1,4,5. &p < 0.05 cluster 5 versus clusters 1,2,3. #p < 0.05 cluster 1 versus cluster 4.
The mean ages and mean total gray matter volumes were not different across the five clusters. Clusters 3 and 5 stood out. Cluster 3 had the highest mean ageN-T mismatch scores, highest mean Aβ and tau loads and highest mean ADAS-cog score. It had also the highest percentage of APOE4 carriers and of subjects with remote TBI with a high npTBI count of whom many also had a diagnosis of PTSD. Cluster 2 shared many of the cluster 3 features, i.e., had a high ageN-T mismatch score, high mean Aβ and tau load and a higher ADAS-cog than the remaining clusters but a lower percentage of APOE4 carriers and of subjects with remote TBI and PTSD than cluster 3. In contrast, cluster 5 was characterized by the lowest mean ageN-T mismatch score, lowest mean Aβ and tau loads but high CAPS and GDS scores. Cluster 4 shared its low mean ageN-T mismatch scores and mean Aβ and tau loads as well as its relatively high mean CAPS scores with cluster 5 but had a higher mean npTBI count and npTBI severity scores. Cluster 1 behaved like an intermediate between clusters 3 and 2 and clusters 5 and 4. It had a low positive ageN-T mismatch, lower mean Aβ and tau loads than clusters 2 and 3 and lower CAPS and GDS than clusters 4 and 5. Against the expectations, participants with a history of TBI or current PTSD were found in all five clusters. Clusters 3 and 4 had the highest frequency of participants with TBI history and cluster 4 and 5 had the highest frequency of participants with PTSD.
The distribution of ROIs with positive and negative residuals in each cluster is visualized in Fig. 2. Clusters 2 and 3 had mostly positive residual counts. Cluster 2 was characterized by positive residual counts in frontal, parietal and medial temporal and particularly orbitofrontal regions and comparatively low counts in the precuneus, cingulate, and medial prefrontal regions. Cluster 3 was characterized by high positive residual counts in the frontal and parietal cortices and particularly in the motor cortices and comparatively low positive residual counts in anterior cingulate, insula and medial temporal regions. Clusters 5 and 4 had mostly negative residual counts. In the case of cluster 4, the negative residual counts were generally low and diffusely distributed over all cortical regions except for the parietal lobes. Cluster 5 was characterized by high negative residual counts that were lowest in the medial temporal regions. In accordance with its role as intermediate between the two cluster groups, cluster 1 had positive and negative residuals. The positive residuals were most prominent in the medial temporal, orbitofrontal and anterior cingulate cortex and less so in the posterior cingulate and precuneus cortices. The negative residuals were most prominent in the sensorimotor and visual cortices. Figure 4 shows the tau SUVR maps associated with these clusters.
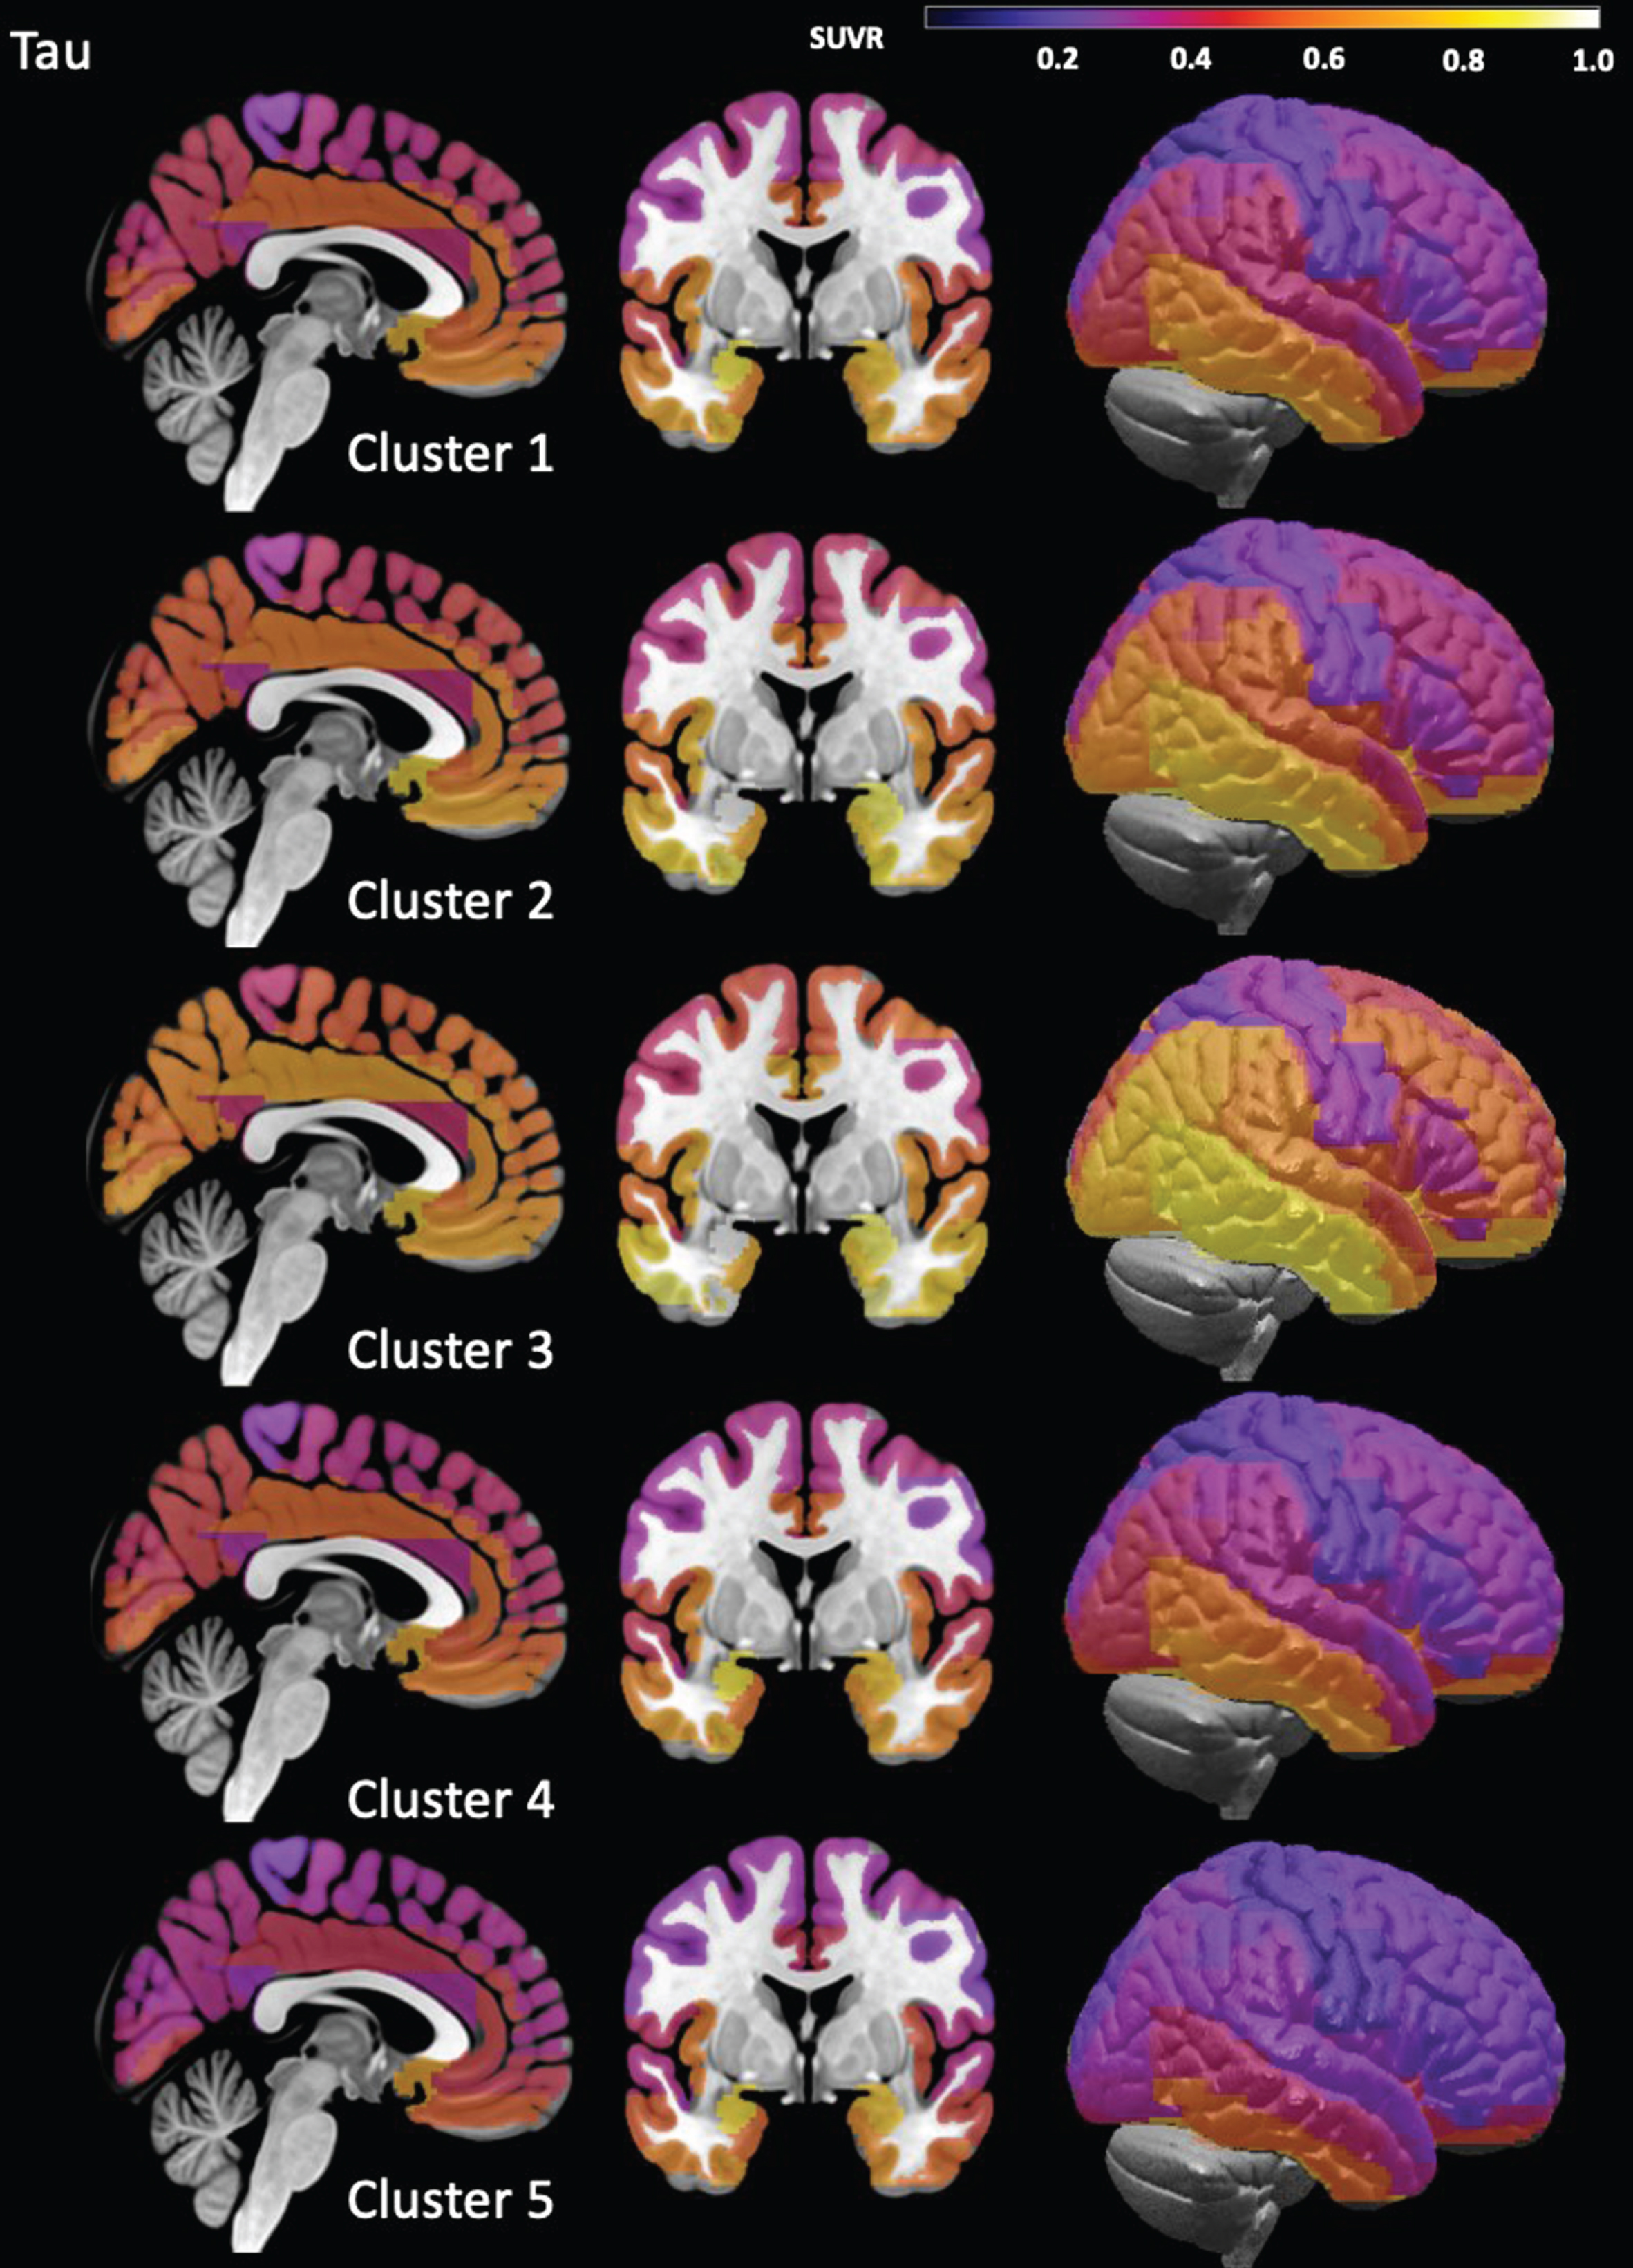
Cluster Tau maps. These maps were created by averaging individual ROI tau SUVR across all subjects assigned to each cluster. The scaling was chosen to maximize the differences between the clusters, i.e., is not to be mistaken for a statistical map that has a threshold that distinguishes between normal and different degrees of significantly elevated tau.
DISCUSSION
The study had two main findings: 1) The ageN-T mismatch score, a continuous measure that summarizes the relationship between regional tau binding and age corrected regional gray matter atrophy was positively correlated with whole brain Aβ load and general cognitive function. These associations are in line with the assumption that the ageN-T mismatch score represents a measure of an individual’s degree of AD pathology. The ageN-T mismatch score was negatively correlated with whole brain WML, a proxy of cerebrovascular disease, suggesting that age-related small vessel disease represents alternative mechanisms for age adjusted gray matter loss in this study population. There were no significant associations between the ageN-T mismatch scores and PTSD or TBI severity. This suggests that PTSD and remote TBI do not influence the expression of AD pathology in this population as a whole. 2) The cluster analysis based on the across subjects concatenated NT arrays detected five different clusters or tau binding patterns. The residual patterns and tau maps suggest different degrees of AD pathology as driving factor for the gray matter atrophy in clusters 1, 2, and 3 and other factors in clusters 4 and 5. None of these clusters was exclusively associated with PTSD and/or remote TBI. The following sections will discuss the main findings in more detail.
Das et al. [42] recently introduced the T-N mismatch metric that is based on the A-T-(N) framework and confirmed the new metric’s ability to convey clinically meaningful information by demonstrating positive associations with age and WML and a negative association with MMSE. This study used a modification of this T-N mismatch score, i.e., switched independent (gray) and dependent (tau) variable and corrected for the effects of age on regional gray matter volume. The resulting ageN-T mismatch score was positively associated with ADAS-cog and Aβ load, indicating that it indeed captured AD-pathology. However, it was negatively associated with WML. Taking the negative association between WML and total gray into account, this suggests that age associated WML or arteriosclerotic small vessel disease could be an alternative mechanism for gray matter loss in this population. This finding is interesting because several lines of evidence suggest a positive association between cerebrovascular disease and its proxy WML with Aβ and tau load [55–57]. The relationship between AD pathology and WML is complex tough. One factor playing a role is WML localization. Frontal WML are associated with both small vessel disease and AD pathology and parietal WML only with AD pathology [58–60]. The other factor is disease stage. AD pathology–WML associations are stronger in later stages with manifest cognitive impairment or dementia than in early, pre-clinical stages [61]. CAT12 only provides WML volumes but no WML maps making it impossible to investigate to what degree the WML distribution contributed to this finding. However, in contrast to Das et al. [42] who focused on cognitively impaired and demented subjects, the majority of subjects in this study was cognitively intact (CDR-SOB = 0) which makes it more likely that age associated small vessel disease and not AD pathology is causing the WML in this population.
Another important finding was the absence of an association between ageN-T mismatch score with measures of current and past PTSD and remote TBI severity. This indicates that at least in this population neither PTSD nor remote TBI promoted AD pathology systematically. This conclusion was also supported by the characteristics of each of the four disease groups that did not differ regarding gray matter atrophy, tau or Aβ load despite differences in cognition and, as to be expected, TBI and PTSD severity (please see Table 2). This finding though does not exclude that TBI and PTSD could enhance AD pathology only in a subgroup of high risk TBI and/or PTSD subjects.
A hierarchical cluster analysis was used to answer the question of the existence of TBI and PTSD subgroups. It identified 5 different clusters that had the same degree of global age adjusted gray matter atrophy but differed regarding other features. Clusters 1, 2, and 3 had all positive ageN-T mismatch scores. Cluster 1 encompassed the majority of the study population. Its residual pattern with positive residuals concentrated in mesial temporal, orbitofrontal and cingulate regions and negative residuals elsewhere and its tau map are consistent with the limbic stage of the Braak tau staging pattern for AD [62]. Its comparatively low but positive mean ageN-T mismatch score and low Aβ load are also consistent with early incipient AD pathology. Clusters 2 and 3 had the second highest and highest ageN-T mismatch scores consistent with AD pathology being the main mechanism driving gray matter atrophy in these subgroups. Cluster 2 was characterized by positive residual counts in all lobes indicating that the AD associated neurodegenerative process is no longer confined to limbic regions but starts affecting the rest of the brain as well. Cluster 3 was characterized by even higher positive residual counts in non-limbic regions and particularly in the motor cortices indicating an even greater effect of AD pathology on gray matter atrophy in these regions. Compared to those regions, the positive residual counts in limbic regions were lower indicating an ongoing but lessening influence of AD pathology on gray matter atrophy there. Taking together, the positive residual patterns in clusters 1–3 and tau maps in combination with the increasing Aβ loads are consistent with evolving AD pathology with cluster 1 representing an early and cluster 3 a more advanced stage. The tau maps associated with these clusters support this conclusion.
None of these three clusters was exclusively associated with PTSD, TBI, or PTSD&TBI though. Between 58–89% of the subjects assigned to these three clusters had a history of remote TBI. The frequency of PTSD was with 32–56% somewhat lower. The high percentages of remote TBI with or without PTSD particularly in cluster 3, however, seems to suggest that TBI could play a role in the development of this AD pathology. But the observation that most of the subjects assigned to cluster 3 had not only a history of TBI but also of PTSD and were often APOE4 carriers suggests that TBI has to occur in combination with other brain insults and risk factors to raise the risk to develop AD pathology.
The conclusion that TBI alone is not sufficient to trigger the development of AD pathology in later life is also supported by the characteristics of cluster 4. Despite equaling cluster 3’s percentage of subjects with a history of TBI with or without PTSD, its mean ageN-T mismatch score was negative indicating that other factors than AD pathology were driving the global gray matter atrophy. The most striking difference between clusters 3 and 4 besides the mean ageN-T score was the higher percentage of APOE4 carriers in cluster 3 although it did not reach significance. This indicates that not so much a history of TBI with or without concomitant PTSD but rather their combination with a well-established AD risk factor such as APOE4 puts a person at risk to develop AD pathology. Such a synergistic effect of APOE4 and TBI and/or PTSD on the risk to develop AD pathology has been described previously [37, 63–67] but there are also other studies that did not find it [13, 68]. The characteristics of cluster 5 finally provide some insights into the role of PTSD. It had the lowest mean ageN-T mismatch score, the lowest Aβ and tau loads but the highest CAPS scores and the highest percentage of subjects with PTSD of all clusters. This suggests that PTSD is driving global gray matter atrophy in this subgroup and by extension that PTSD on its own seems not to be a strong risk factor for the development of AD pathology.
Limitations
The study has several limitations. 1) Although large for an imaging study, the sample size is small, particularly the group of subjects with PTSD only and that of subjects without TBI or PTSD. To compensate for the latter, the DoD ADNI population was enriched with cognitively intact and Aβ negative subjects from the ADNI3 database for the NT regression analyses and cluster analysis. The majority of the ADNI3 subjects was assigned to cluster 4. It cannot be excluded that some of the cluster characteristics that were only trends, e.g., different percentages of ApoE4 carriers in clusters 3 and 4, would have been significant in a larger sample. 2) The DoD ADNI project required participants to undergo repeated assessments and imaging over several years which might have been too demanding for participants who were more severely affected by the consequences of TBI and/or PTSD and thus more at risk to develop AD pathology. It is possible that the exclusion of these subjects prevented the detection of a TBI-AD or a PTSD-AD cluster. 3) DoD ADNI enrolled Vietnam veterans which means that the population in this study was male and had a high percentage of military service related TBI. This did not allow to investigate sex differences and the findings re TBI might not be representative for a civilian population. 4) The focus of DoD ADNI was on the impact of remote TBI, i.e., a TBI sustained during early-middle adulthood, on brain Aβ and tau load in subjects 60 years and older. It is therefore possible that a study investigating the impact of recent TBI and PTSD on Aβ and tau load would have come to different conclusions. 5) DoD ADNI tracked the total number of TBIs and their severity in each participant. However, the TBI mechanism, e.g., vehicle accident or blast exposure, was not recorded. It is therefore not possible to investigate if some TBI mechanisms are more likely to lead to the development of AD pathology in later life than others.
Taken together, the findings reported here support the hypothesis that only a subset of the patients with PTSD and/or remote TBI develop AD pathology. There is no evidence that TBI or PTSD modify tau binding patterns and create PTSD or post TBI specific patterns. This suggests that a history of TBI or a PTSD diagnosis alone is not sufficient to put a subject at risk for AD but rather that TBI and PTSD represent one of several factors that need to come together for this to happen.
AUTHOR CONTRIBUTIONS
Susanne Mueller (Conceptualization; Formal analysis; Funding acquisition; Investigation; Methodology; Writing – original draft; Writing – review & editing).
Footnotes
ACKNOWLEDGMENTS
Many thanks to AMM for the critical reading of the manuscript.
FUNDING
This work was supported by the Department of Defense award W81XWH-19-1-0841 to SGM.
CONFLICT OF INTEREST
The author has no conflicts of interest to report.
DATA AVAILABILITY
The data used in this study came from the DoD ADNI (https://adni.loni.usc.edu/study-design/collaborative-studies/dod-adni/) and ADNI (![]() ) data repositories. A list of the DoD ADNI and ADNI subjects used in this project has been provided as supplementary information.
) data repositories. A list of the DoD ADNI and ADNI subjects used in this project has been provided as supplementary information.