
Abstract
Background:
Alzheimer’s disease (AD) is a neurodegenerative disorder caused by a complex interplay of various factors. However, a satisfactory cure for AD remains elusive. Pharmacological interventions based on drug targets are considered the most cost-effective therapeutic strategy. Therefore, it is paramount to search potential drug targets and drugs for AD.
Objective:
We aimed to provide novel targets and drugs for the treatment of AD employing transcriptomic data of AD and normal control brain tissues from a new perspective.
Methods:
Our study combined the use of a multi-layer perceptron (MLP) with differential expression analysis, variance assessment and molecular docking to screen targets and drugs for AD.
Results:
We identified the seven differentially expressed genes (DEGs) with the most significant variation (ANKRD39, CPLX1, FABP3, GABBR2, GNG3, PPM1E, and WDR49) in transcriptomic data from AD brain. A newly built MLP was used to confirm the association between the seven DEGs and AD, establishing these DEGs as potential drug targets. Drug databases and molecular docking results indicated that arbaclofen, baclofen, clozapine, arbaclofen placarbil, BML-259, BRD-K72883421, and YC-1 had high affinity for GABBR2, and FABP3 bound with oleic, palmitic, and stearic acids. Arbaclofen and YC-1 activated GABAB receptor through PI3K/AKT and PKA/CREB pathways, respectively, thereby promoting neuronal anti-apoptotic effect and inhibiting p-tau and Aβ formation.
Conclusions:
This study provided a new strategy for the identification of targets and drugs for the treatment of AD using deep learning. Seven therapeutic targets and ten drugs were selected by using this method, providing new insight for AD treatment.
INTRODUCTION
With the global demographic trend towards aging, Alzheimer’s disease (AD) has emerged as one of the leading causes of mortality worldwide. Despite the impact of COVID-19 over the past three years, AD still ranks in the top ten causes of mortality [1]. Researchers are actively addressing this issue, but the absence of definitive treatments remains a challenge.
AD is treated in various ways, including psychotherapy [2, 3], behavioural interventions [4], pharmacological and non-pharmacological treatments [5–7], and pharmacological treatments that take the primary role in AD therapy. Although donepezil, galantamine, rivastigmine, and memantine are the most commonly used pharmacological treatments, their clinical efficacy varies among patients [8]. In the past few decades, the design of typical AD drugs has primarily based been on the pathology of the disease, which involves acetylcholinesterase, N-methyl-D-aspartate receptor, amyloid-β (Aβ) plaques, and neurofibrillary tangles (NFTs). Tacrine, donepezil, rivastigmine, galantamine, and memantine aim to improve cognitive and behavioral symptoms in patients. Unfortunately, these drugs do not significantly delay the progression of AD and have severe side effects [8].
To develop more effective therapeutic agents, online databases and computational biological methods have been combined to identify potential AD targets. Reanalyzing online data by molecular network analysis or applying an integrative network analysis framework have been the most common strategies [9–11]. Deep learning has only been used in a few studies to screen gene targets: tamoxifen, bosutinib, and dasatinib, which were redefined as potential AD drugs by the inference method [12]. The most frequently used deep learning methods involve multi-layer perceptrons (MLPs), convolutional neural networks (CNNs) or recurrent neural networks (RNNs). Unlike CNNs and RNNs, a MLP is typically referred to as a basic feedforward neural network in which information flows unidirectionally from input to output without recurrent or convolutional structure. In non-image processing networks, MLPs outperform CNNs and RNNs [13] and could be a good choice for target- and drug-screening for the treatment of AD.
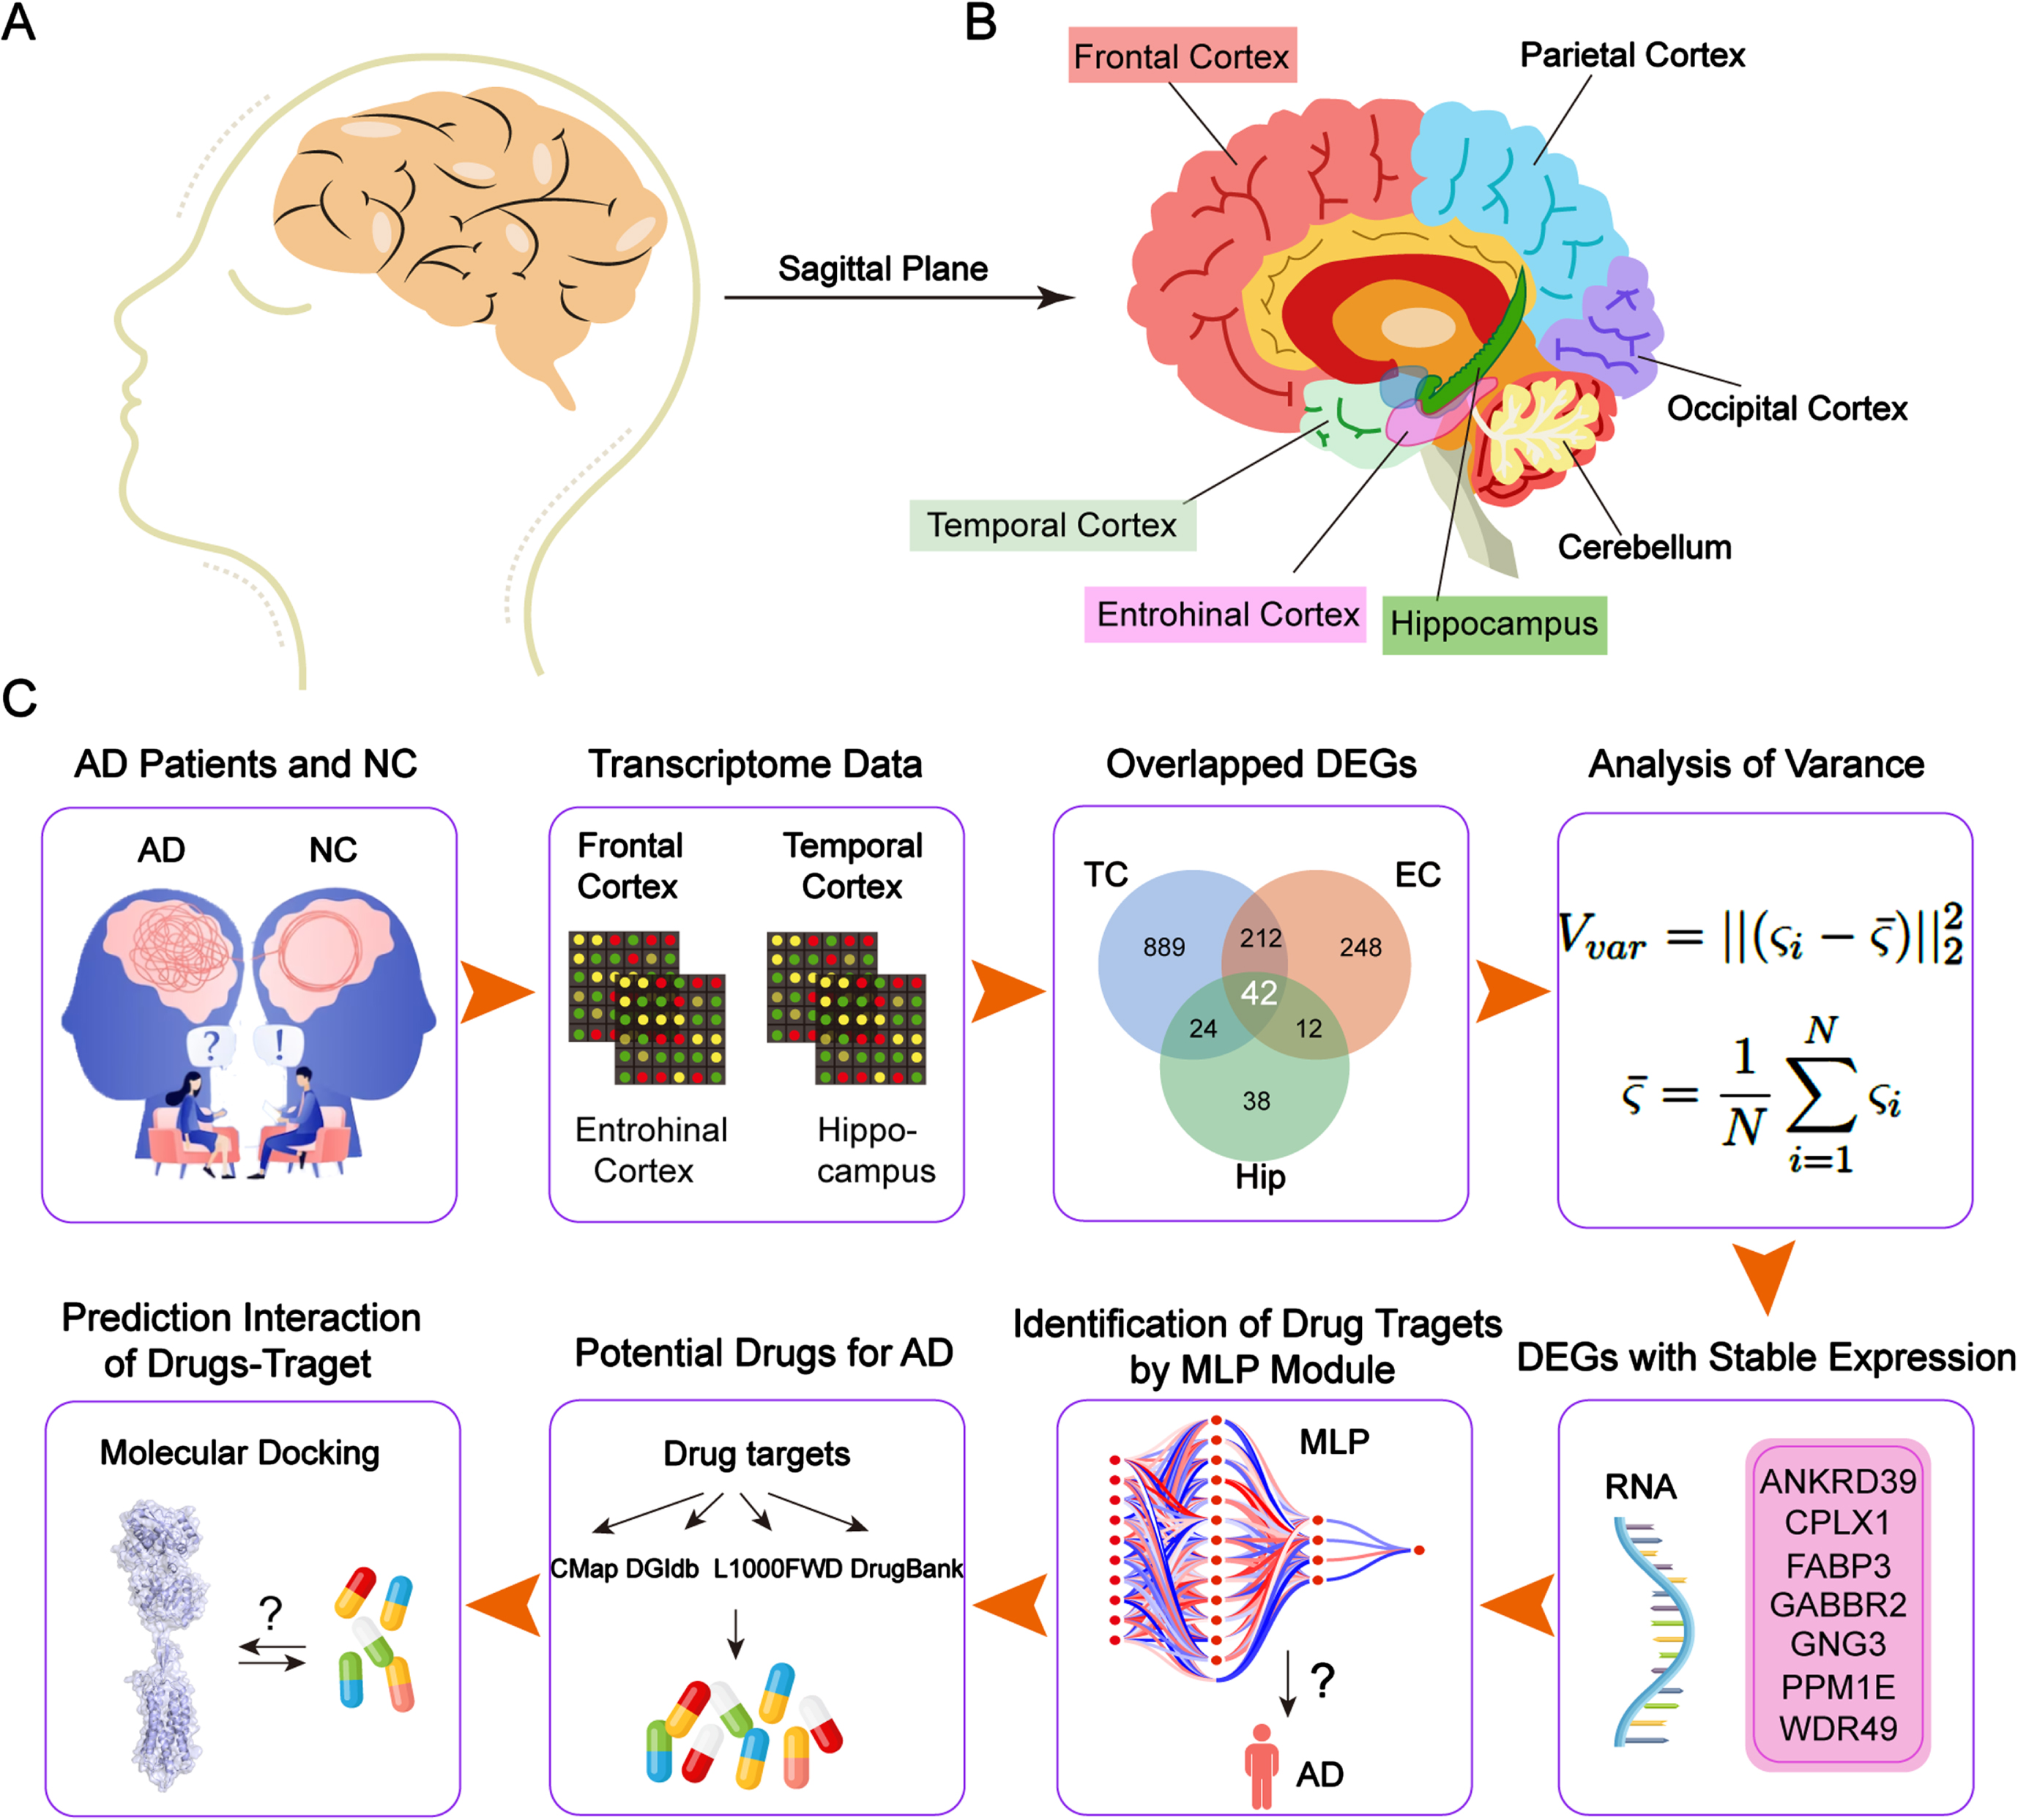
In the present study, we aimed to search potential target genes and drugs for AD by analysing the human AD database with a new MLP model. The overall workflow is shown in Fig. 1. First, we extracted genes that were differentially expressed in the temporal cortex (TC), entorhinal cortex (EC), frontal cortex (FC), and hippocampus (Hip) from the transcriptome data from AD patients and control groups. We obtained a small subset of differentially expressed genes (DEGs) that encoded proteins that were potential drug targets based on their variance. Next, we constructed a MLP model to determine the suitability of the DEGs as target genes. Finally, we used molecular docking to identify potential drugs that targeted the proteins encoded by the selected genes.
METHODS
Datasets
TC, EC, FC, and Hip transcriptome data were obtained from the AlzData database (http://www.alzdata.org/). The Gene Expression Omnibus (GEO) (https://www.ncbi.nlm.nih.gov/geo/) accession numbers are presented in Supplementary Table 1. The information pertaining to the study participants, including number, age and gender, is shown in Table 1.
Demographic features of AD patients and normal controls from the GEO dataset
NC, normal control; F, female; NA, not available; M, male.
Hypothesis testing
The analysis of transcriptome data was carried out following previously established protocols [14]. In this study, the TC, EC, FC, and Hip transcriptome data were renormalized, and differential expression analysis was performed. The DEGs were determined based on the following criteria: |fold change|>1.5 and p < 0.05. Here, we utilized the volcano plot to exhibit the DEGs. In the volcano plot, each gene is represented by a point. The p-value is pre-processed as follows:
Each point in the volcano plot can be regarded as a point that has expression difference and statistical significance when it meets the conditions described as follows:
Analysis of gene expression stability
After the hypothesis testing, we hope to find the DEGs that express stability in four areas and different conditions. The normalized data containing gene expression values were obtained from the datasets. Then, the heatmap was plotted to demonstrate the consistency for various DEGs in AD and control groups. The vertical axis represents the different DEGs, and the horizontal axis represents the various samples. The variance for every DEG in various samples was calculated in AD and control groups to assess the characteristics of DEGs. Here, the variance can be calculated as follows:
Data preparation
Before establishing the MLP, it was necessary to pre-processed the data from the datasets. In the hypothesis testing, the DEGs of FC were eliminated because they were insufficient in number. The other three brain areas were regarded as the features to train. The data from three brain datasets were filtered by the selected DEGs. Samples from different people were necessary to be labelled as AD or control. The features of the brain areas should also be considered. Therefore, we used one-hot encoding to represent the different brain areas. One-hot encoding is a method used to encode data and is commonly used in machine learning and data analysis. Each of the three brain areas was coded in the datasets by a three-dimensional vector; therefore, EC was represented as [0, 0, 1], TC as [0, 1, 0], and Hip as [1, 0, 0]. The data were then concatenated to form a new dataset containing 309 samples from different people. The dataset was used to train our deep-learning model. During deep learning, it is a common practice to split the dataset into three main subsets: the training, validation, and test sets. This splitting helps evaluate and fine-tune the performance of the deep learning model. The general rule of thumb is to split the dataset into approximately 60%–80% for training, 10%–20% for validation, and 10%–20% for testing, depending on its size and complexity. However, the proportions may vary based on specific requirements and data availability. Herein, they are divided into 70% for training, 15% for validation, and 15% for testing according to the sizes of our datasets.
Correlation analysis via MLP
In this study, we proposed a deep-learning model to validate the relevance between the filtered DEGs and AD. Due to the filtered DEGs that had a wide, significant and stable expression, we established a compact MLP model. Our model offered efficient training with a reduced sample size requirement compared to the larger model. The MLP architecture aligned with the inherent characteristics of the DEG datasets. MLPs are feedforward artificial neural networks (ANNs) model that map input data onto appropriate outputs. A MLP consists of at least three layers of nodes: input layer, hidden layer and output layer. Here, our specific MLP designed four layers, including two hidden layers, utilizing the rectified linear unit (ReLU) activation function for efficient learning. The ReLU is a commonly adopted activation function in neural networks and deep learning models due to its favorable properties. Furthermore, the Adaptive Moment Estimation (Adam) algorithm, proposed by Kingma and Ba in 2015, is an optimizer and popular optimization algorithm in deep learning.
Molecular docking
We used molecular docking to identify the interaction sites between the targets and the drugs to predict the binding modes and strengths of interaction between the drug molecules and the proteins [15, 16]. The structures of the small-molecule drugs (ligands) were downloaded from PubChem (https://pubchem.ncbi.nlm.nih.gov/), and the protein structures of the targets were retrieved from the Research Collaboratory for Structural Bioinformatics Protein Data Bank (RCSB PDB) (https://www.rcsb.org/). Subsequently, the structures of the ligand were energy-minimized and converted into 3D structures using Chem3D. The proteins were prepared by removing solvents and organic molecules using the PyMOL. The processed ligands and proteins were saved in a pdbqt format using the AutoDock Tools. Finally, molecular docking was performed with AutoDock Vina 1.2.2, and the 2D and 3D results were visualized using Discovery Studio 2020 Client and PyMOL, respectively.
Cell culture
Mouse neuroblastoma Neuro-2a (N2a) cells (CCL-131) were purchased from ATCC. The swedish mutant AβPP (AβPPswe)-overexpressing N2a cells (N2a-AβPPsw) were a gift from Prof. Hua-Xi Xu of Xiamen University. They were cultured in Dulbecco’s modified Eagle’s medium (DMEM) with 10% fetal bovine serum, l-glutamine, 1% penicillin, and streptomycin in 5% CO2 at 37°C.
MTT assay
The viability of the cells treated with the compounds was evaluated using a 3-(4,5-dimethylthiazol-2-yl)-2,5-diphenyltetrazolium bromide (MTT) assay (E606334; Sangon Biotech). The cells were seeded into 96-well plates at a density of 2000/well, incubated for 24 h, and either treated with various concentrations of arbaclofen or YC-1 for 24 h, or left untreated. After treatment, the cells were incubated with 0.5 mg/mL MTT for 4 h. The media was discarded carefully and a formazan solubilization solution was added to each well. The absorbance was measured at 570 nm using a microplate reader.
Immunoblotting
Immunoblotting was performed as described previously [17]. The N2a and N2a-AβPPsw cells were harvested and sonicated in lysis RIPA (P0013B; Beyotime Biotech Co., Ltd.) supplemented with 20 mM sodium fluoride, 1 mM orthovanadate, 20 mM phenylmethanesulfonyl fluoride, and a protease inhibitor cocktail (P8340; Sigma-Aldrich). The total protein concentration was quantified with a BCA protein assay kit (CW0014S; Jiangsu Cowin Biotech Co., Ltd.), and the samples were heated at 95°C for 10 min. The samples were then loaded onto 8% SDS-PAGE, transferred onto polyvinylidene difluoride membranes, and blocked with 5% milk. Subsequently, the membranes were incubated with the primary antibodies and HRP-conjugated secondary antibodies. All antibodies were used in Supplementary Table 2.
Immunofluorescence
The N2a-AβPPsw cells were seeded on poly-l-lysine coated glass coverslips. After treatment with arbaclofen (50μM) or YC-1 (10μM) for 24 h, the N2a-AβPPsw cells were fixed with 4% paraformaldehyde at room temperature for 10 min. The fixed cells were then permeabilized in 0.2% Triton X-100 for 3 min and blocked in 5% goat serum for 30 min. The cell slides were then successively incubated with primary antibodies and secondary antibodies incubation. Images of the cells were obtained captured using a Leica TCS SP8 laser-scanning confocal microscope with a 40×objective. All antibodies were used in Supplementary Table 2.
Statistical analysis
The quantification data is represented as the mean±S.E.M. The Ordinary one-way ANOVA was performed for statistical analysis in Prism 8. Significant changes were defined as p < 0.05.
RESULTS
Identifying the DEGs in AD patients and control groups
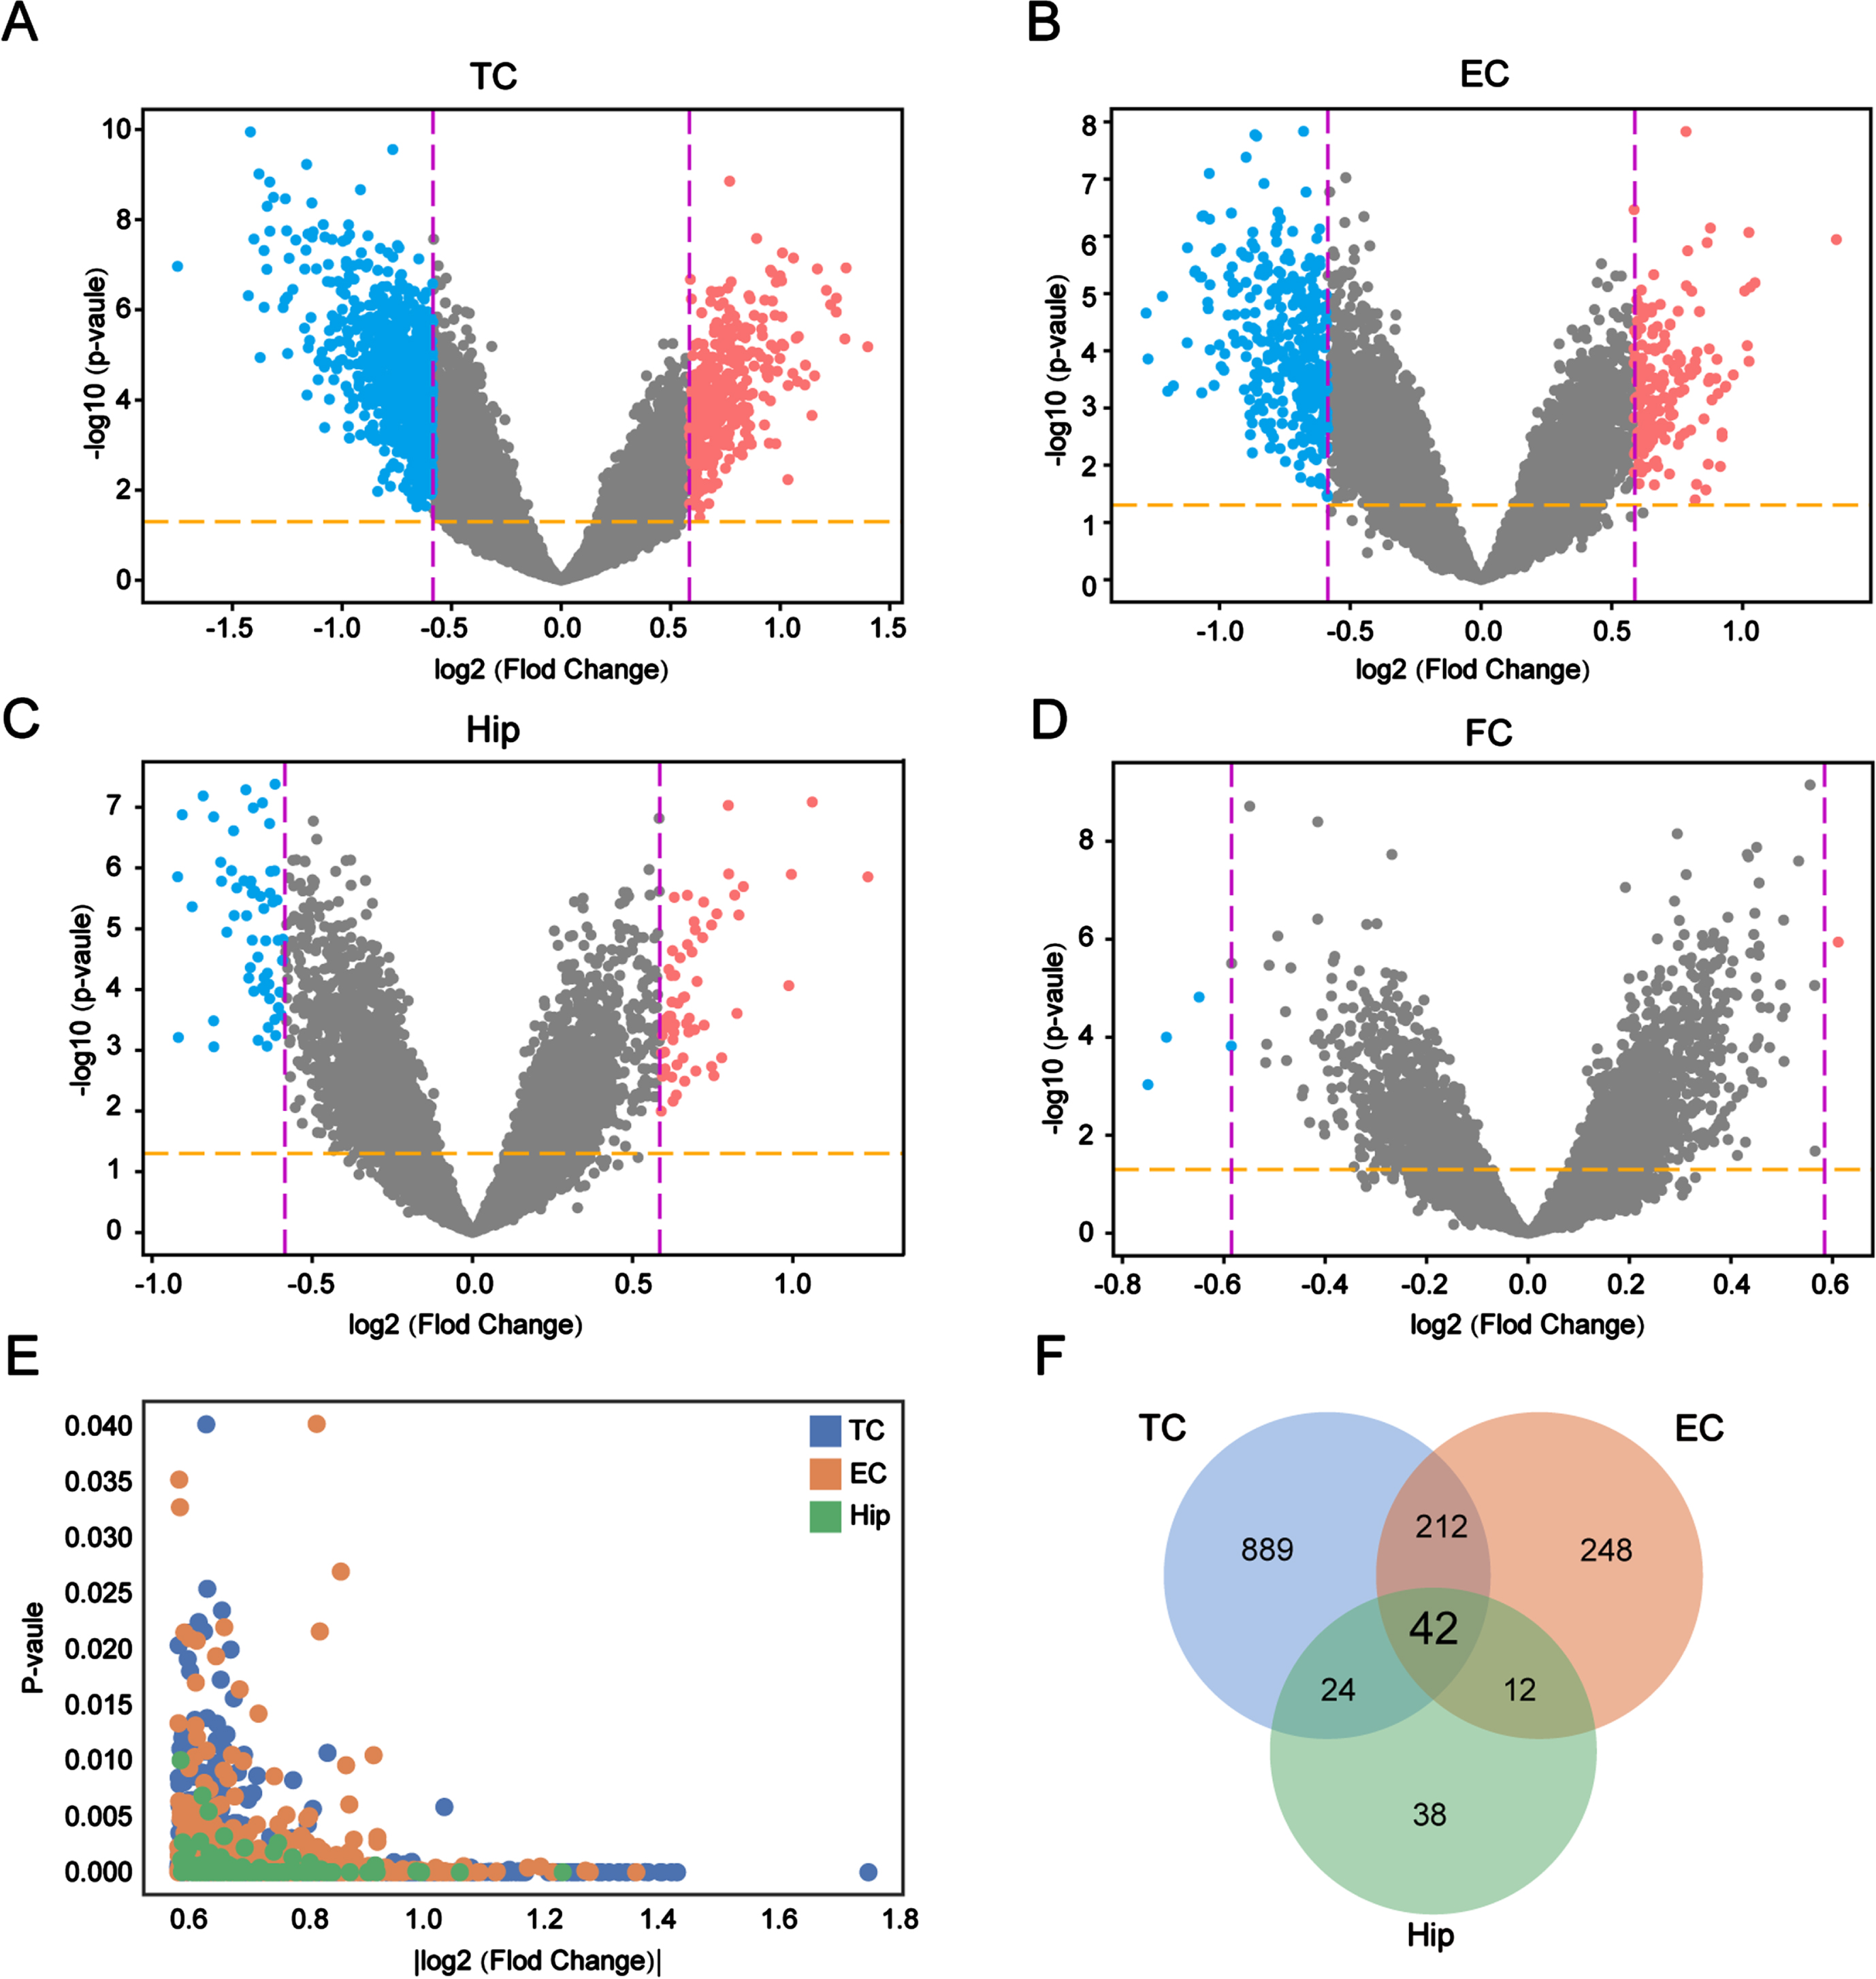
We performed differential gene expression analysis using transcriptome data from the TC, EC, FC and Hip to obtain the DEGs in AD compared with the control brains. A total of 1,802 DEGs were identified in four areas: 1,167 in the TC (Fig. 2A), 514 in the EC (Fig. 2B), 116 in the Hip (Fig. 2C), and 5 in the FC (Fig. 2D). This suggested that TC, EC, and Hip are the regions that are most likely to induce functional abnormalities in AD. We excluded FC from this study because it did not harbor enough DEGs. The expression and number of the DEGs differed in the various brain regions, suggesting that the DEGs of each region have unique functions in AD. We also conducted an integrated analysis of these DEGs to understand their expression in the different regions. The results showed that the DEGs from the TC, EC, and Hip were tightly clustered together (Fig. 2E), indicating that the screened genes were significantly and uniformly expressed in all three regions, and 42 DEGs were shared by the TC, EC, and Hip (Fig. 2F). In conclusion, the screening and correlation analysis identified 42 DEGs that are likely to be involved in the development of AD.
Evaluation of the stability of DEG expression in AD patients and control groups
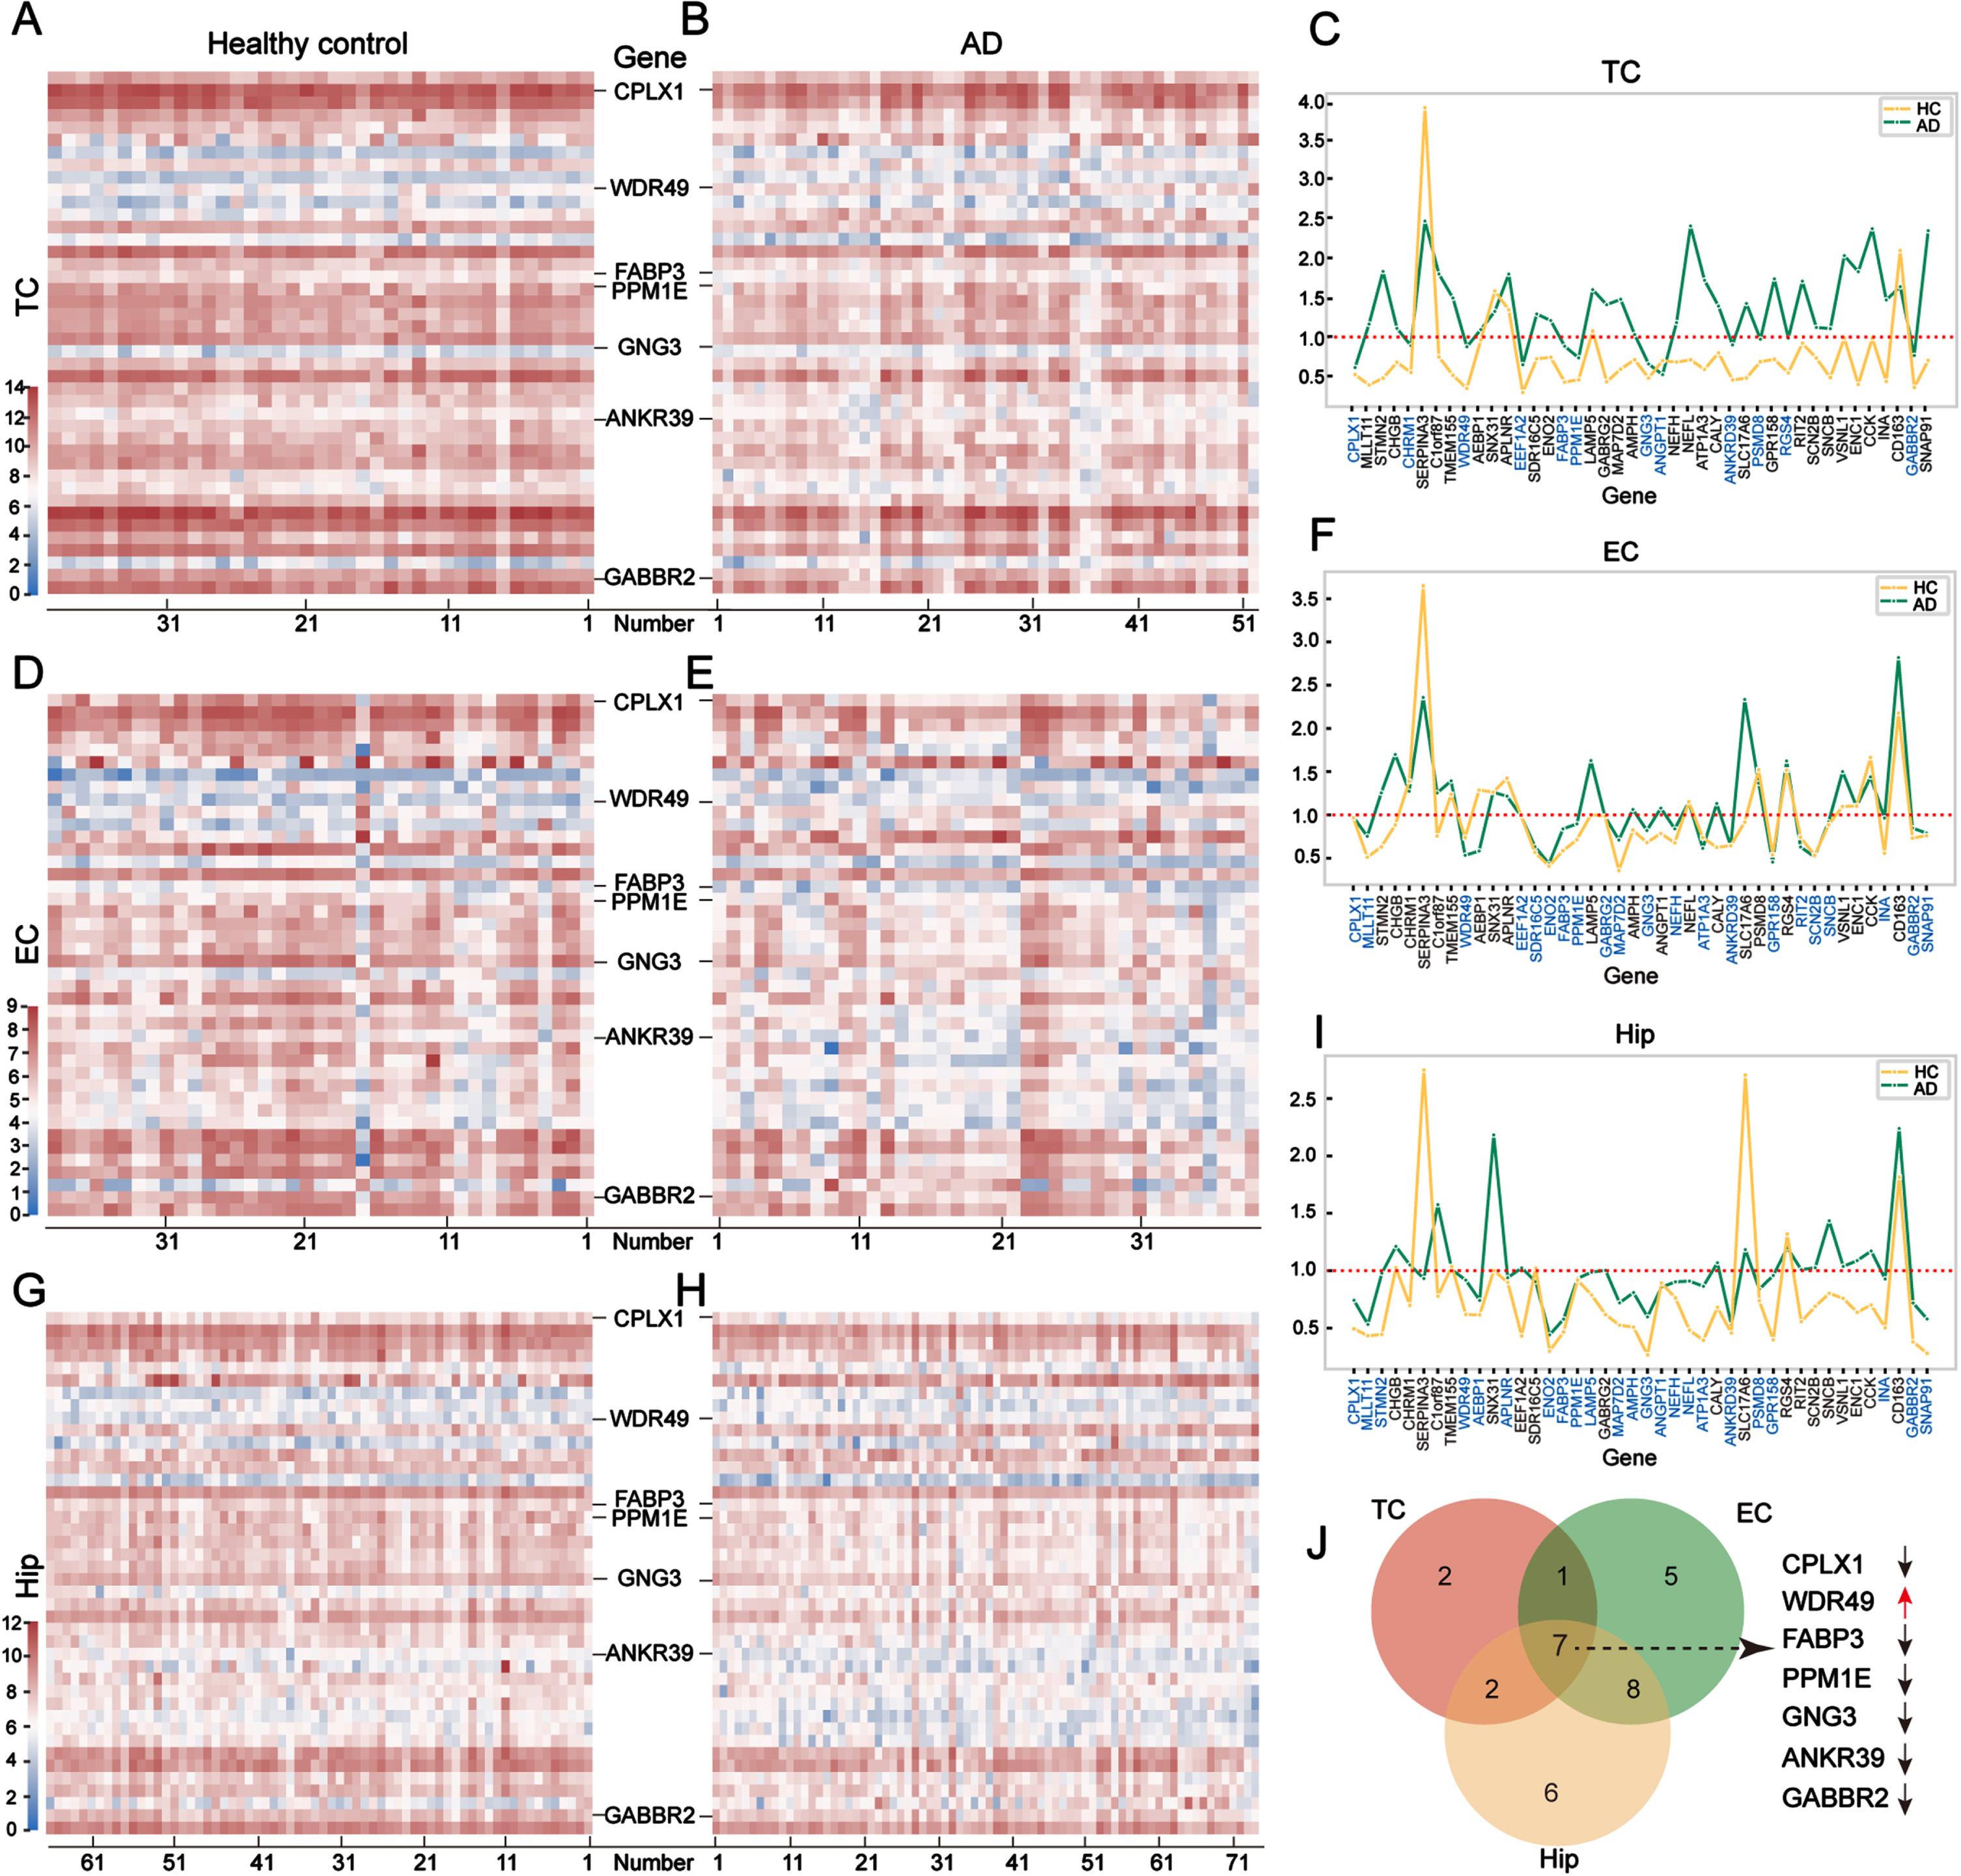
To obtain the most pivotal DEGs in AD, we used heatmaps to show the expression patterns of the 42 DEGs in the TC (Fig. 3A, B), EC (Fig. 3D, E), and Hip (Fig. 3G, H) regions in the AD and control groups. These heatmaps displayed an overview of the 42 DEGs. The expression profiles of each gene were the same in both groups, indicating the consistency of expression of the 42 DEGs in the brain tissues. To eliminate the genes with big variations in each group, we calculated the variance of each gene in two groups and selected genes with variances of less than 1.0 for further study. Twelve genes were selected in the TC (Fig. 3C), 21 genes in the EC (Fig. 3F), and 23 genes in the Hip (Fig. 3I). Of these stably expressed DEGs, seven were identified as overlapped genes, including ANKRD39, CPLX1, FABP3, GABBR2, GNG3, PPM1E, and WDR49 (Fig. 3J). Of the overlapped genes, WDR49 was the only one that was upregulated in AD; the other six were downregulated. Because the seven overlapped genes were stably expressed in the tissues of both the AD and control groups, we regarded them as possible candidates for training the deep learning model.
Validation of the correlation between the target DEGs and AD using the MLP model
To further verify the correlation between the seven selected genes and AD, we generated a new MLP model using the expression levels of the seven genes in 70% of the mixed samples. If the fitting parameters obtained by training were able to model the relationship, it would be possible to conclude that the seven DEGs are highly correlated with AD.
Big deep learning models typically require substantial data to learn meaningful patterns and parameters effectively. Owing to the limited size of the AD dataset, training large deep-learning models poses challenges and may not yield optimal results. Therefore, we chose a compact MLP as our model for training the datasets. This MLP network comprised of four layers with 10, 16, 4, and 1 neuron in the input layer, two hidden layers, and an output layer (10×16×4×1) (Fig. 4A). The proposed model was trained using the 70% pre-processed datasets.

Both the training loss and validation loss during the training process are presented in Fig. 4B. As depicted, the two metrics demonstrated a steady decline with increasing iterations, indicating the convergence of the model without evidence of significant overfitting. However, the validation accuracy rose consistently as the iterations progressed (Fig. 4C). When training was complete, we evaluated our model using the test dataset. The test accuracy of the model consistently exceeded 80% (Fig. 4D). This suggested that the proposed model is capable of predicting an individual’s risk of developing AD using the selected seven DEGs and emphasizes their significant correlation. Furthermore, the selected DEGs can be seen as representative of the primary features associated with AD and can be regarded as drug targets.
Screening potential drugs targeting the seven DEGs
We hypothesized that the seven target genes would allow us to identify potential drugs for the treatment of AD. To validate this hypothesis, we searched for potential drugs associated with the above seven genes (ANKRD39, CPLX1, FABP3, GABBR2, GNG3, PPM1E, and WDR49) in four drug databases: connectivity map (CMap), the Drug-Gene Interactions Database (DGIdb), the L1000 fireworks display (L1000FWD), and DrugBank. Among the seven target genes, GABBR2 and FABP3 were found to interact with drugs in the four drug databases (Fig. 5A). Eleven molecules interacted with GABBR2: arbaclofen placarbil, arbaclofen, and baclofen from DGIdb and DrugBank; lesogaberan and sodium oxybate from DGIdb; SGS-742, γ-aminobutyric acid (GABA), and clozapine from DrugBank; and YC-1, BRD-K72883421, and BML-259 from L1000FWD (Fig. 5B). Meanwhile, three molecules interacted with FABP3: oleic acid, palmitic acid, and stearic acid from DrugBank (Fig. 5B). The detailed information about these compounds can be found in Supplementary Table 3. Arbaclofen placarbil, arbaclofen, baclofen, lesogaberan, and sodium oxybate are agonists of the GABAB receptor; they are capable of activating it and subsequently inhibiting neuronal excitotoxicity. YC-1, BRD-K72883421, and BML-259 are primarily predicted as adrenergic receptor antagonists, PI3K inhibitors, cyclooxygenase inhibitors, and PARP inhibitors. SGS-742, GABA, and clozapine mediate G-protein coupled GABA receptor activity. Furthermore, oleic acid, palmitic acid, and stearic acid bind with zinc ions and lipids, and mediate phospholipase a2 activity.
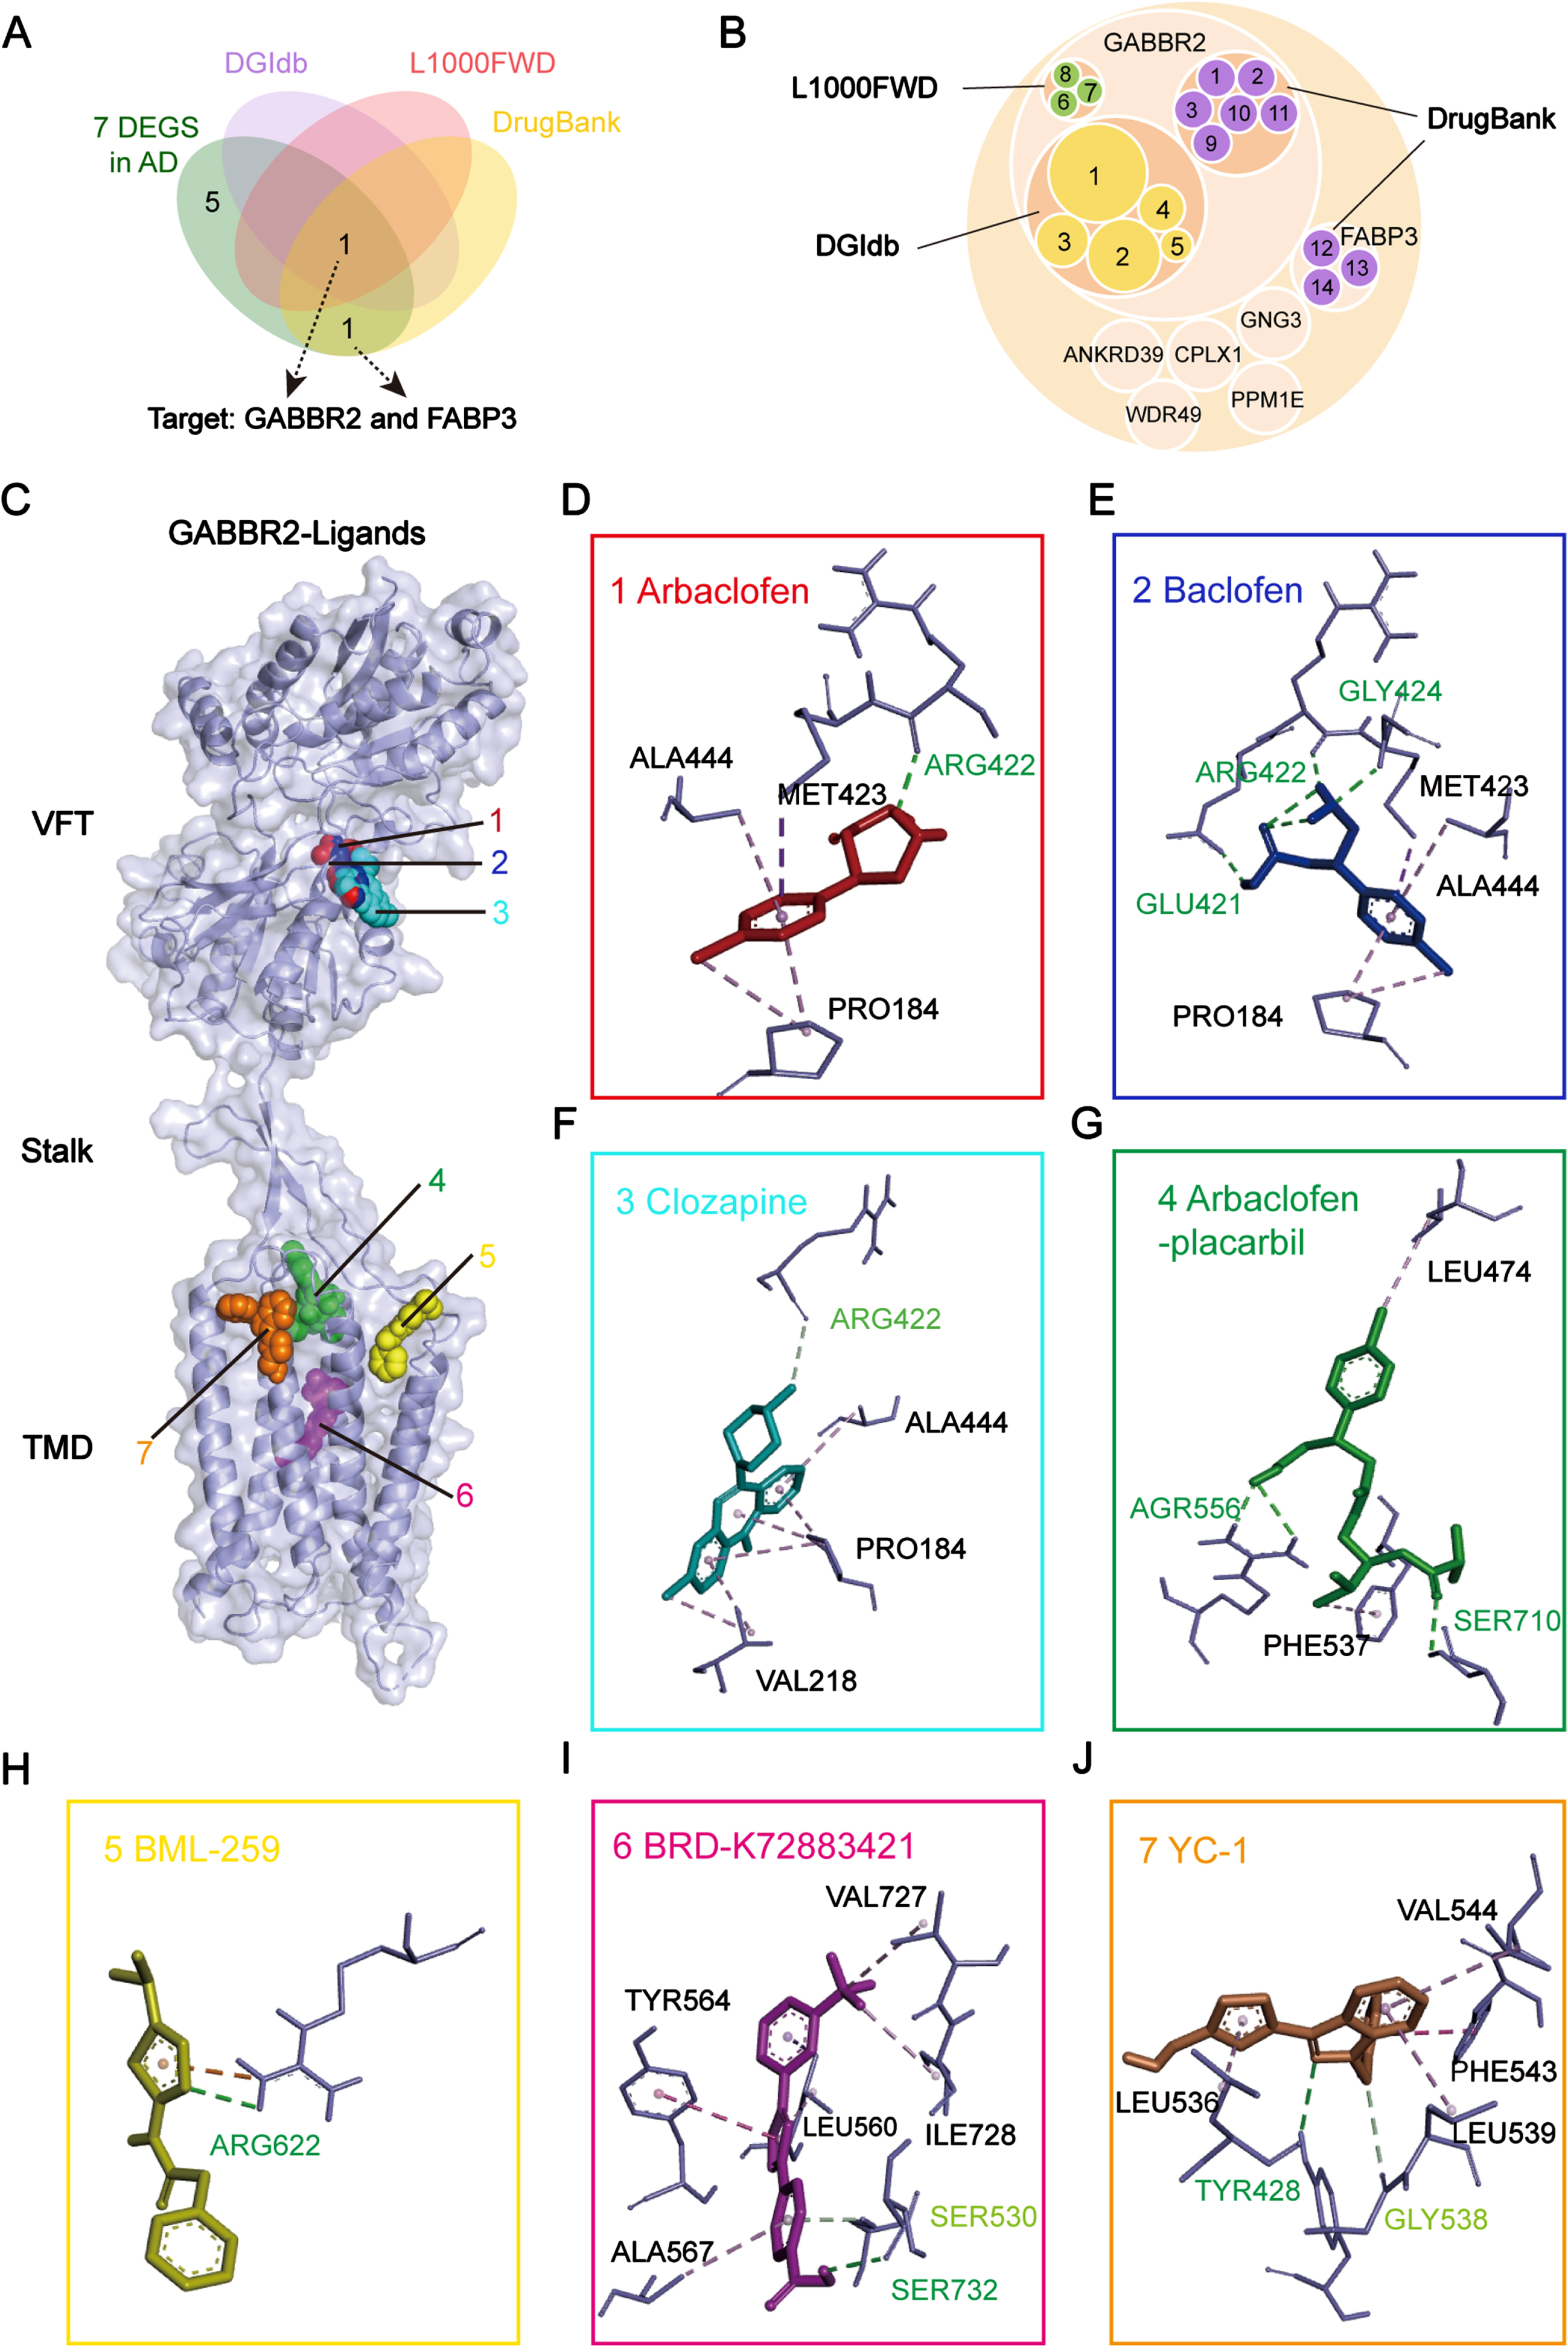
To further investigate the molecular mechanisms underlying the differential pharmacological effects of these small-molecule compounds and the two proteins, we used molecular docking to predict the binding modes. The γ-aminobutyric acid type B receptor subunit 2 (GB2) is encoded by GABBR2 and is the secondary subunit of the γ-aminobutyric acid type B (GABAB) receptor. The GABAB receptor plays a crucial role in assembling the complete GABAB receptor complex and mediating the neurotransmission of GABA [18]. The GB2 consists of an extracellular Venus flytrap (VFT) domain and seven-transmembrane domain (TMD), which are connected by a linker called a stalk. It actively facilitates TMD activation, leading to GABAB receptor activation and subsequent G protein signaling. The seven compounds identified in the present study, i.e., arbaclofen, baclofen, clozapine, arbaclofen placarbil, BML-259, BRD-K72883421, and YC-1, bound to GB2 with the following binding energies: –5.2, –5.2, –6.2, –7.3, –5.0, –8.4, and –6.6 kcal/mol, respectively (Table 2). We also found ligand-specific interaction with GABBR2. Arbaclofen, baclofen, and clozapine bound to the VFT domain of GABBR2 via hydrogen bonds and van der Waals forces (Fig. 5D–F, Supplementary Figure 1A–C). In contrast, arbaclofen placarbil, BML-259, BRD-K72883421, and YC-1 bound to the TMD of GABBR2 through distinct hydrogen bonding and van der Waals interactions (Fig. 5G–J, Supplementary Figure 1D–G). These two binding modes suggested that these drugs may differentially modulate the GABBR2 signaling pathways.
The binding affinity of compounds to targets
Docking energy values less than –4.25 kcal/mol suggest some level of binding activity; – less than –5.0 kcal/mol signify good binding activity; less than –7.0 denote strong binding activity.
Fatty acid-binding protein 3 (FABP3), which is encoded by FABP3, is a critical regulator of fatty acid metabolism and transport within the brain. Previous studies have demonstrated the binding of oleic, palmitic, and stearic acids to FABP3 with a consistent binding mode (PDB IDs: 3WVM, 7WE5, and 4TKJ, Supplementary Figure 2), and palmitic acid modulated the level of p-tau in the AD neurons [19]. Although the structures of the three compounds bound to FABP3 have been studied, the mechanisms and pharmacological profiles remain unclear. A comparison of the binding sites and energies of the drugs implied that arbaclofen, baclofen, clozapine, arbaclofen placarbil, BML-259, BRD-K72883421, and YC-1, oleic acid, palmitic acid, and stearic acid may be more promising as potential candidates for the treatment of AD
Arbaclofen and YC-1 inhibited p-tau and Aβ through activation of GABAB, potentially via distinct signaling pathways
To evaluate the potential therapeutic effects of GABBR2 partners in AD, we initially performed a biological evaluation of seven drugs. These drugs targeted distinct binding sites within the full-length GABBR2, classified as VFT and TMD domain interactors. To represent each binding class, arbaclofen and YC-1 were selected based on their well-characterized interaction profiles with GABBR2. The cytotoxicity of arbaclofen and YC-1 was assessed using the MTT assay in both N2a and N2a-AβPPsw cells, established AD model cell lines. While arbaclofen exhibited a viability-enhancing effect at 50μM in N2a cells (Fig. 6A), YC-1 demonstrated a contrasting viability-reducing effect at the same concentration (Fig. 6B). As is well-known, N2a-AβPPsw cells, which simulate key in vitro features of AD, exhibit a generally enhanced sensitivity compared to N2a cells. To identify optimal working concentrations, a dose-response analysis was performed using a narrower concentration range (0-100μM for arbaclofen and 0-10μM for YC-1) in N2a-AβPPsw cells (Fig. 6C, D). Notably, both drugs displayed minimal cytotoxicity within this range, suggesting a narrower safety window in N2a-AβPPsw cells compared to N2a cells. Consequently, 50μM arbaclofen and 10μM YC-1 were selected for further investigations into their functional effects.
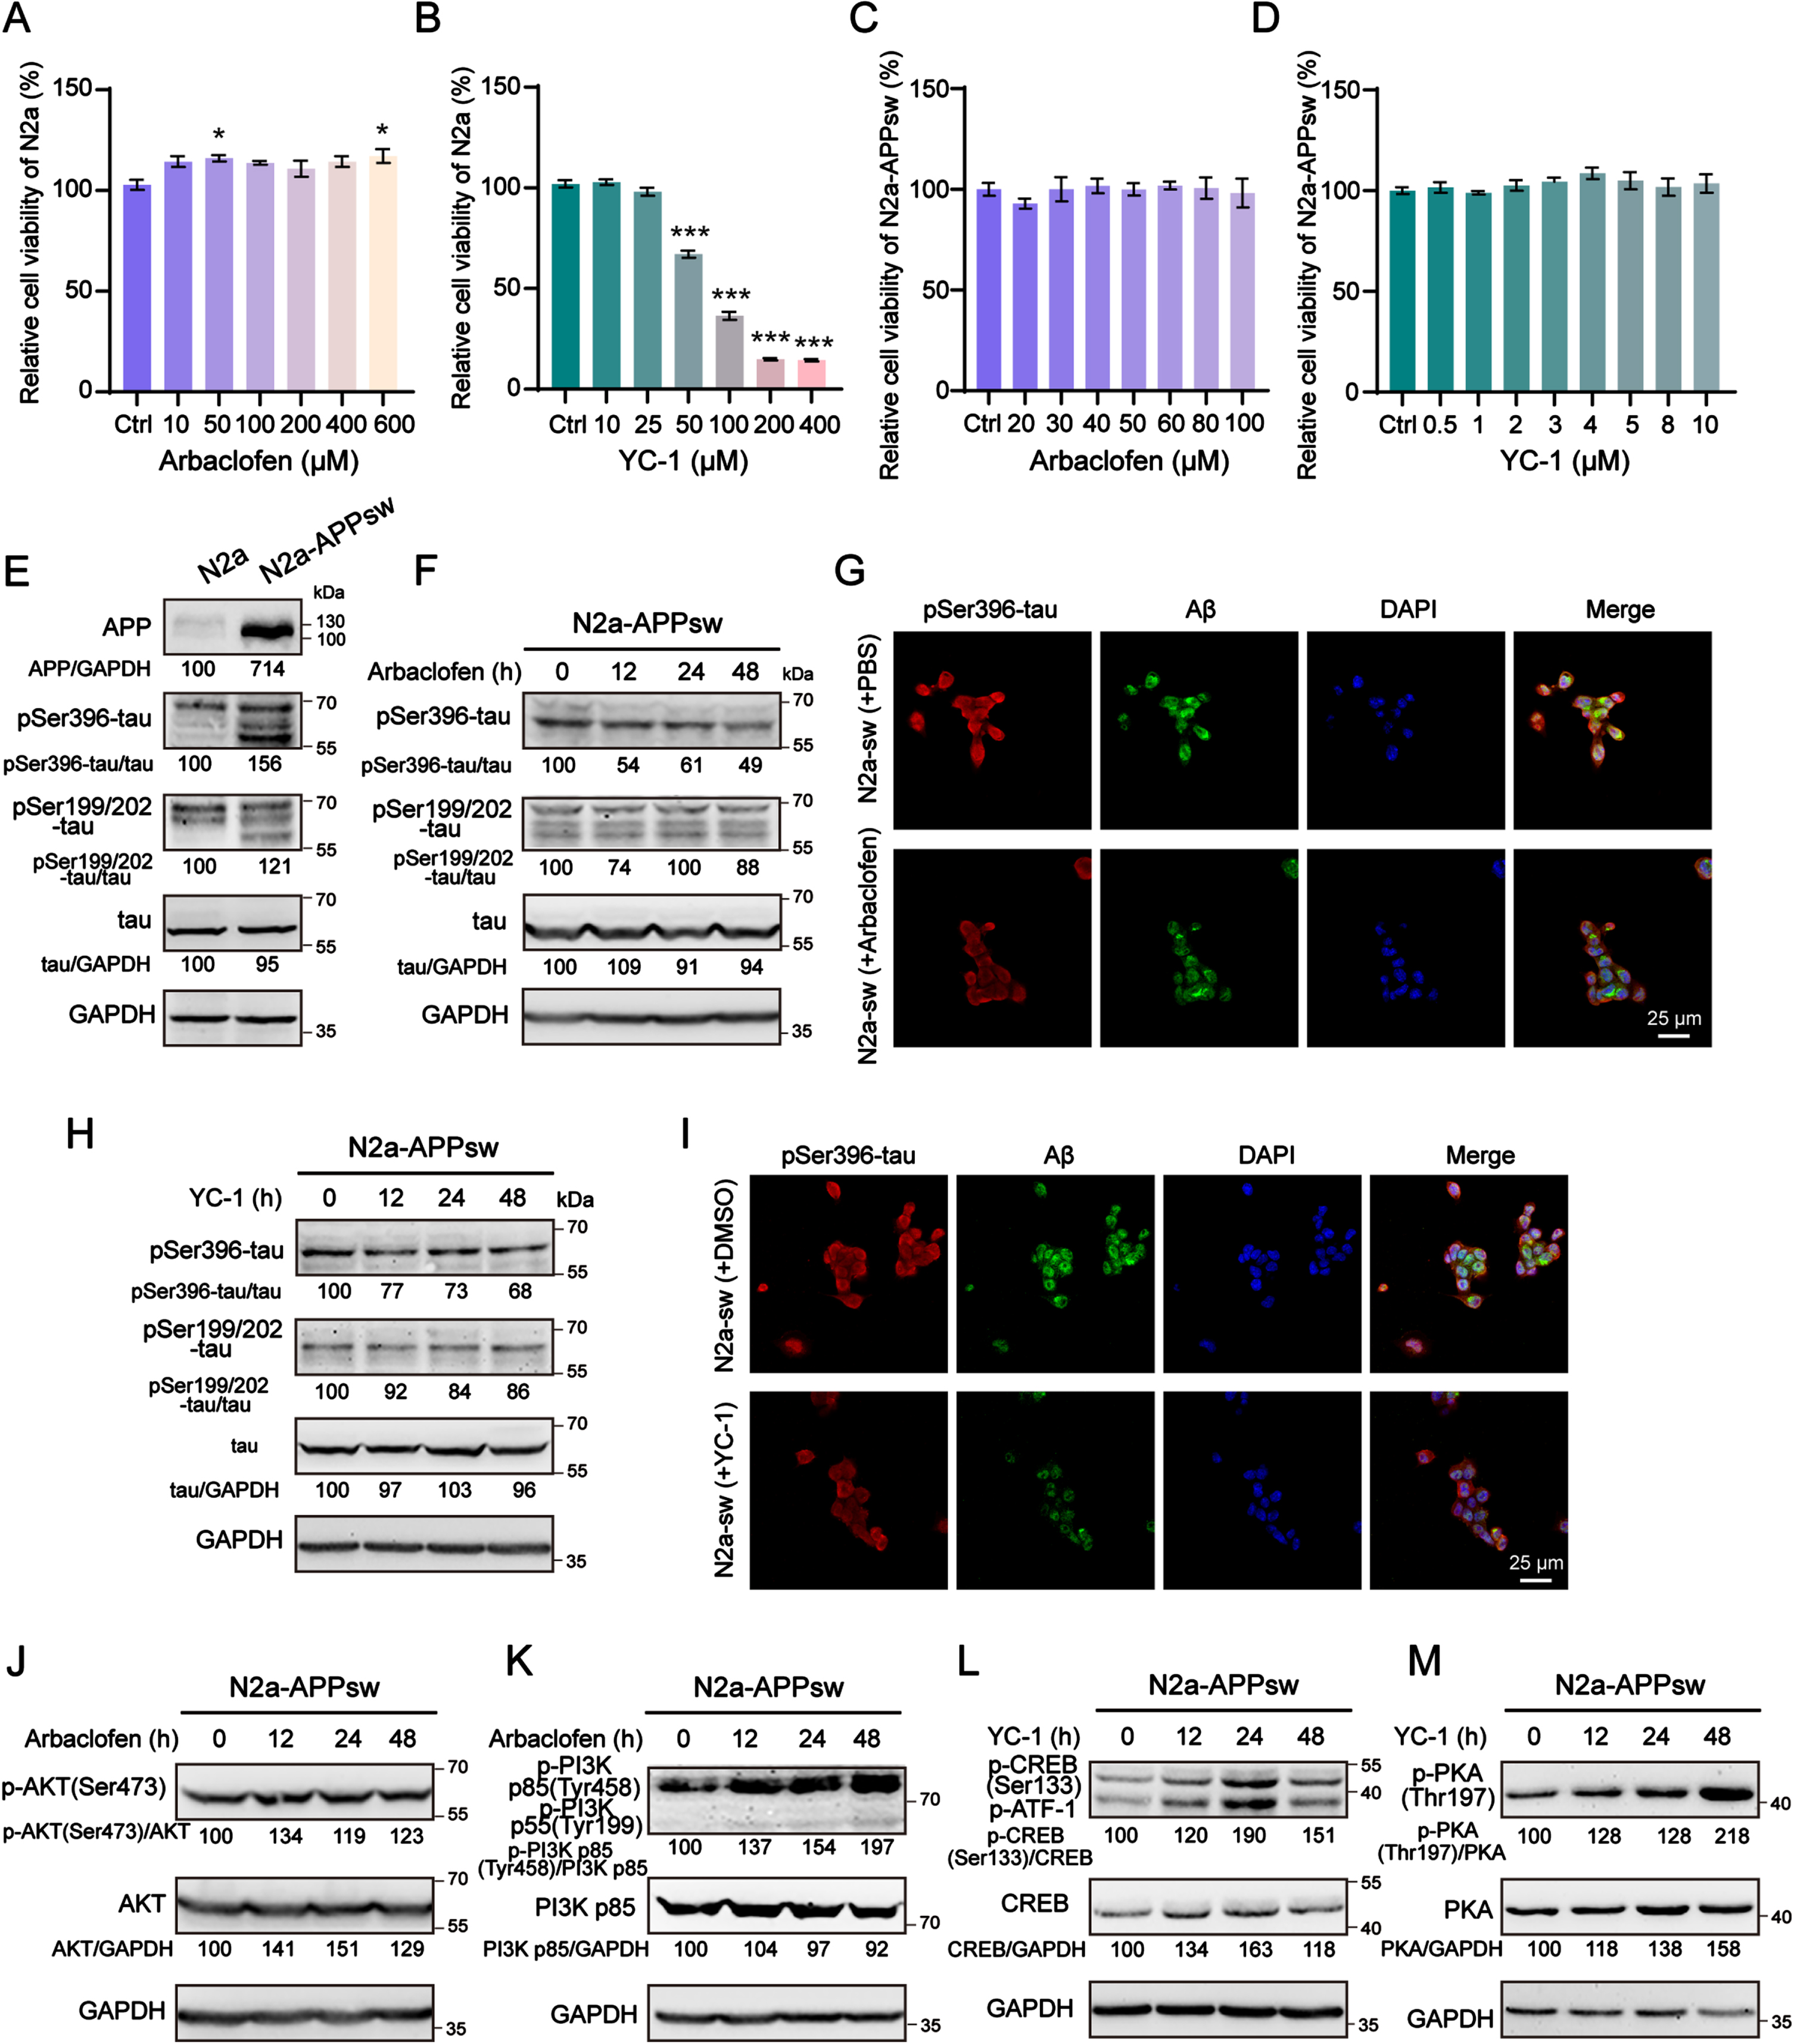
Based on GABBR2, arbaclofen and YC-1 were selected to assess their ability to activate GABAB receptor. This activation was hypothesized to promote neuronal anti-apoptotic effect and inhibit the formation of tau phosphorylation (p-tau) and Aβ, key hallmarks of AD pathogenesis. To test this hypothesis, we investigated the levels of p-tau and Aβ in N2a-AβPPsw cells treated with arbaclofen and YC-1 (Fig. 6E–I) for 12 h, 24 h, and 48 h. Western blot and IF analyses revealed that both arbaclofen (Fig. 6F, G) and YC-1 (Fig. 6H, I) significantly reduced the levels of pSer396-tau and Aβ in N2a-AβPPsw cells. In particular, the intracellular accumulation of Aβ in N2a-AβPPsw cells was clearly eliminated by arbaclofen and YC-1. Interestingly, YC-1 displayed a more remarkable effect on suppressing hyperphosphorylation at Ser199/202 of tau compared to arbaclofen (Supplementary Figure 3A, B). These findings collectively revealed that arbaclofen and YC-1 may exert therapeutic benefits in AD by inhibiting the formation of p-tau and Aβ. To elucidate the mechanism by which arbaclofen and YC-1 exert their effects on AD pathology, we investigated the different signaling pathways of GABAB receptor activation. Notably, we observed elevated phosphorylation of PI3K and AKT in N2a-AβPPsw cells treated with arbaclofen (Fig. 6J, K), while YC-1 treatment resulted in increased phosphorylation of PKA and CREB (Fig. 6L, M). Remarkably, cross-activation of signalling pathways between arbaclofen and YC-1 was not observed (Supplementary Figure 4A, B). The data suggested that arbaclofen activated the PI3K/AKT pathway, whereas YC-1 activated the PKA/CREB pathway. Collectively, these results implied that activation of the GABAB system through distinct signaling pathways promote neuronal anti-apoptotic function and inhibit p-tau and Aβ formation.
DISCUSSION
As a common neurodegenerative disease caused by multiple factors, AD faces big challenges in effective treatments and therapeutic targets. Here, we provided a novel deep learning method for screening therapeutic targets, and identified seven potential targets for AD: ANKRD39, CPLX1, FABP3, GABBR2, GNG3, PPM1E, and WDR49. Finally, we selected seven reagents target GABBR2 and three reagents target FABP3 as potential drugs for treating AD.
The pathological processes of AD are the main targets for traditional drug screening. New methods for drug screening emphasize the complicated relationships within biological molecular networks to identify prospective therapeutic targets. Although MLP is widely used in medical image analysis [20–22], bioinformatics data interpretation [23, 24], clinical outcome predictions [25–27], and drug discovery [28–30], it is rarely incorporated in AD drug target screening. In this work, we combined a MLP with differential expression analysis, variance assessment and molecular docking to screen targets and drugs for the treatment of AD. All seven screened targets were directly or indirectly related to the function of neurons or AD processing. FABP3 serves as a lipid metabolism-related biomarker in cerebrospinal fluid in the early stages of AD, it has a weak ability to distinguish AD from other brain disorders [31–33]. WDR49 is involved in the assembly and maintenance of cellular structures and organelles that play a pivotal role in protein folding and processing [34, 35]. The other five targets are all related to the basic function of neurons. The serine/threonine phosphatase PPM1E mediates the inactivation of p21-activated kinase and multifunctional calcium/calmodulin-dependent protein kinases and may regulate the development and plasticity of neurons [36]. ANKRD39 [37] and GNG 3 [38, 39] are hub genes that are associated with AD; both are engaged in signaling transduction pathways related to neurotransmitter release. CPLX1 and GABBR2 serve as the inhibitory neurotransmitter receptors during the neurotransmitter release. CPLX1 prevents the fusion of SNARE complexes, thereby delaying the fusion of synaptic vesicles with the cell membrane, which decelerates neurotransmitter release [40, 41]. GABBR2 encoded the subunit (GB2) of the GABAB receptor and was recognized as a therapeutic target for AD according to the tissue data from the FC obtained in a previous study [42]. The ligands of the GABAB receptor, such as GABA, initially bind to GB1 and subsequently activate the GABAB receptor by promoting the interaction between GB1 and GB2, which reduce neurotransmitter release and prevent neurons from excitotoxicity. In AD sufferers, the levels of both CPLX1 and GABBR2 are reduced in the brain, leading to persistent neurotoxicity and worsening of the disorder. Notably, GABBR2 levels decrease as AD progresses (Supplementary Figure 5), indicating neurotoxicity accumulation in the later stages of the disease. Therefore, activating the GABAB receptor by targeting GB2 would protect neurons from excitotoxicity in the early stages of AD.
In the selected compounds, arbaclofen placarbil and arbaclofen were designed based on the function of baclofen. Baclofen is a GABA derivative that works as a GABAB agonist and is approved in the United States of America for treating muscle spasms. A combination drug combining low-dose acamprosate and baclofen has been used in clinical studies for the treatment of mild AD (clinical trial identifiers NCT02361242 and NCT02361424). Arbaclofen is the R-enantiomer of baclofen and is believed to have therapeutic potential for the treatment of the autism spectrum disorders, fragile X syndrome, and gastroesophageal reflux disease. Arbaclofen placarbil is a prodrug of arbaclofen with an improved pharmacokinetic profile [43]. It has been subjected to clinical trials for the treatment of gastroesophageal reflux disease, multiple sclerosis, and alcohol use disorder. Owing to its low toxicity, high efficacy, and absorption rate, baclofen and its derivative are promising candidates for treating AD. In vivo, baclofen is recognized by GB1, triggering an inhibitory signaling pathway downstream of the GABAB receptor with the assistance of GB2, which cause sustained neuronal excitotoxicity. GABBR1 and GABBR2 encode GB1 and GB2 and have different expression patterns in AD patients: the level of GABBR1 expression does not change as AD progresses, whereas that of GABBR2 is reduced, suggesting the pivotal role of GABBR2. The level of GABBR2 decreases in the middle and late stages of AD. Therefore, therapeutic strategies to reduce neuronal excitotoxicity by activating GABAB receptors should be considered as early as possible in the early stages of AD.
YC-1 and BRD-K72883421, which are listed in the L1000FWD drug database, have the highest binding affinities for GABBR2. YC-1, which is also known as lificiguat, has two major therapeutic targets, HIF-1α and soluble guanylate cyclase (sGC) [44]. It can cause cell cycle arrest, decreased proliferation, and enhanced apoptosis by inhibiting HIF-1α, indicating a potential role in cancer therapy. However, YC-1 has not been used in clinical studies for cancer treatments. Instead, it is currently being explored as a drug targeting HIF-1α of treating bronchiectasis (NCT05582798). Riociguat [45] and vericiguat [46] are both derivatives of YC-1 that target sGC. They have already been established as clinical treatments for pulmonary arterial hypertension and heart failure. However, the role of YC-1 in AD remains unclear. YC-1 may play a role in treating AD in two ways. First, YC-1 stimulates sGC and activates the NO/cGMP/CREB signaling pathway, thereby enhancing the learning and memory capabilities of aged rats [47, 48]. Second, it inhibits inflammation by hindering NO, PGE2, iNOS, COX-2, inflammatory factors, NF-kB activation, and the vascular endothelial growth factor [49, 50]. Therefore, owing to its simple structure and synthesis, and because it has many derivatives, YC-1 has broad potential for the treatment of AD. BRD-K72883421 was first synthesized in 2008. However, its properties were not determined until 2021. Therefore, its mechanism of action in AD requires further investigation. Clozapine is a widely used atypical antipsychotic drug that was approved by the FDA in 1989 for the treatment of recalcitrant schizophrenia. It has also shown promise in pre-clinical studies for other disease from DrugBank. Notably, a previous study reported that clozapine improved memory impairment and psychobehavioral symptoms in a mouse model of AD [51]. These findings suggest that clozapine could be repurposed as a therapeutic agent for AD.
GABAB receptor is a heterodimeric member of the G protein-coupled receptor family. Subunits GB1 and GB2 both comprise three distinct structural domains: the VFT, the TMD, and a connecting stalk region. Recent high-resolution structural studies have revealed the crucial activation mechanism by which GABAB receptor function. When a agonist bind to the VFT domain, a series of conformational rearrangements are transmitted to the TMDs of both subunits, which are ultimately responsible for triggering the G protein signaling cascades [52]. The GABAB receptor complex functions through coordinated interactions between the GB1 and GB2 subunits. Occupancy of the VFT domain in the GB2 subunit by a compound enhances its affinity for the GB1 subunit. Conversely, ligand binding to the TMD domain of GB2 induces a rearrangement of its transmembrane helices, creating a shallow cleft that facilitates G protein interaction. Interestingly, our data demonstrated that, regardless of the binding site (VFT or TMD), ligand interaction with GB2 leads to GABAB receptor activation through distinct downstream signaling pathways. Therefore, ligands bind to the VFT and TMD domains of GB2, thereby activating the GABAB system.
In summary, in contrast traditional methods that identify target genes and drugs, our study not only identified GABBR2 and FABP3 as the drug targets for AD but also screened the drugs that directly interact with them, such as arbaclofen, baclofen, clozapine, arbaclofen placarbil, BML-259, BRD-K72883421, and YC-1, oleic acid, palmitic acid, and stearic acid. We also used molecular docking to predict the sites at which GABBR2 and FABP3 interacts with these drugs, respectively. In addition to GABBR2 and FABP3, the proteins encoded by five other genes, ANKRD39, CPLX1, GNG3, PPM1E, and WDR49, for which no matched drugs are currently available in the database, have been identified as potential targets for AD.
Limitations
There is scope for improvement in our model for predicting correlations between genes and AD. There are two compelling factors pertaining to this issue. First, any study requires a large enough sample size to ensure the accuracy of the results. We used various sizes in our study: the largest sample was obtained from the FC (total number (N) = 232; number of normal controls (NC) = 128; number of patients with AD (AD) = 104) and the smallest was obtained from the EC (N = 78, NC = 39, AD = 39) (Table 1). Second, the brain is a highly complex organ with various functions that take place in various regions. Therefore, conducting targeted studies on the transcriptomics data of each brain region can improve the accuracy of the model. Considering all these factors, our results merely change the statistical correlation and do not imply causality. The ten drugs identified in this study should be further validated through cell, animal and clinical trials. An investigation of gene-drug interactions require a more comprehensive molecular network. The ten genes identified in the present study could possibly be targeted in an undiscovered network or algorithm, which could eventually be paired them with a matching drug. A comprehensive gene-drug interaction network would greatly help the drug screening of drugs for the treatment of AD.
Conclusion
In summary, in the present study we identified potential therapeutic targets for the treatment of AD, i.e., ANKRD39, CPLX1, FABP3, GABBR2, GNG3, PPM1E, and WDR49, by establishing MLP model. By searching current online databases, we identified ten compounds that interact with GABBR2 and FABP3, i.e., arbaclofen, baclofen, clozapine, arbaclofen placarbil, BML-259, BRD-K72883421, and YC-1, oleic acid, palmitic acid, and stearic acid. We hope these targets and therapeutic drugs will advance the treatment of AD.
AUTHOR CONTRIBUTIONS
Ya-Hong Zhang (Conceptualization; Data curation; Formal analysis; Validation; Visualization; Writing – original draft; Writing – review & editing); Pu Zhao (Funding acquisition; Project administration; Writing – original draft; Writing – review & editing); Hui-Ling Gao (Data curation; Resources; Validation; Visualization); Man-Li Zhong (Software; Validation; Visualization); Jia-Yi Li (Funding acquisition; Project administration; Writing – review & editing).
Footnotes
ACKNOWLEDGMENTS
The authors have no acknowledgments to report.
FUNDING
This work was supported by the National Natural Science Foundation of China 81971015 (P.Z.), U1801681 (J.L.).
CONFLICT OF INTEREST
The authors have no conflict of interest to report.
DATA AVAILABILITY
The data analyzed in this article are fully documented within the main text and its supplementary materials. However, the original code is available from the corresponding author upon reasonable request.