



Abstract
Background:
Long noncoding RNAs (lncRNAs) regulate the pathogenesis of Alzheimer’s disease (AD).
Objective:
To identify lncRNAs in the peripheral blood as potential diagnostic biomarkers for amnestic mild cognitive impairment.
Methods:
In the discovery group, a microarray was used to screen for significant differences in lncRNA expression between patients with mild cognitive impairment (MCI) caused by AD and normal controls (NCs) (n = 10; MCI, 5; NC, 5). Furthermore, two analytic groups were assessed (analytic group 1: n = 10; amnestic MCI (aMCI), 5; NC, 5; analytic group 2: n = 30; AD, 10; aMCI, 10; NC, 10) and finalized in the validation group (n = 150; AD, 50; aMCI, 50; NC, 50). In the analytic and validation groups, real-time quantitative reverse-transcription polymerase chain reaction was used to identify differentially expressed lncRNAs between the aMCI and NC groups.
Results:
We identified 67 upregulated and 220 downregulated lncRNAs among the expression profiles. The panel with lncRNAs T324988, NR_024049, ENST00000567919, and ENST00000549762 displayed the highest discrimination ability between patients with aMCI and NCs. The area under the receiver operating characteristic curve of this combined model was 0.941, with a sensitivity of 92.00% and specificity of 84.00%.
Conclusions:
This study reports on a panel of four lncRNAs as promising biomarkers to diagnose aMCIs.
INTRODUCTION
Alzheimer’s disease (AD) is a neurodegenerative disease characterized by extracellular amyloid-β (Aβ) plaque accumulation, and intracellular neurofibrillary tangles resulting from phosphorylated tau (p-tau) aggregation, which results in neuronal loss [1, 2]. According to the World Health Organization, approximately 50 million people are living with AD worldwide, and this number is projected to increase to 152 million by 2050 [3]. The rapid global progression of AD is of great concern, thus increasing the need for novel and improved diagnostic methods.
Clinicians and neurologists must recognize AD symptoms to diagnose it accurately and promptly [4]. It is critical to define biomarkers and/or the cognitive profile that best predicts the progression from the preclinical to clinical stages of AD, namely, in the prodromal phase [4–5]. In the prodromal phase of AD, individuals present with cognitive decline, but no impairment of activity daily living. Prodromal AD is the most critical period for diagnosis because of the apparent symptoms associated with cognitive functional decline. The clinical characteristics of prodromal AD are the same as those of amnestic mild cognitive impairment (aMCI) [6], which was defined by Peterson [7] and is the intermediate stage between normal cognition and AD dementia, but with a different conversion trend [8]. Approximately 10–20% of patients with aMCI develop dementia annually [9, 10]. Early identification of aMCI can bring great benefits to people with aMCI, because of its high likelihood of developing into AD. Researchers have developed improved diagnostic techniques for AD, including positron emission tomography (PET) and cerebrospinal fluid (CSF) testing [11–13]. Testing CSF has led to the discovery of several AD-related biomarkers. Biomarkers refer to biochemical alterations suggestive of disorders in human tissues and fluids [13, 14]. Techniques such as PET and CSF testing can provide an accurate profile of AD and the later stage of MCI, but cannot discriminate the early stage of MCI [15]. In addition, PET scanning is relatively expensive, and CSF testing involves invasive procedures [12–14]. Furthermore, these methods cannot monitor the MCI stage, particularly the early stage of MCI. Our team has focused on identifying new pathways to diagnose aMCI using epigenetic regulatory markers in the peripheral blood.
Long noncoding RNAs (lncRNAs) are RNA molecules of more than 200 nucleotides, some of which play a significant role in AD pathology by upregulating age-related genes, thus increasing Aβ production, synaptic impairment, inflammation, mitochondrial dysfunction, neurotrophic depletion, and the stress response [16–18]. Typically, lncRNAs can be detected in the peripheral blood and thus are substantially more easily accessible than the CSF [19]. Bruna et. al. reported a group of significantly deregulated lncRNAs in patients with MCI [20]. Despite reports on the effects of altered RNA levels, few studies [13, 16] have compared lncRNA expression levels among cohorts of older adults with different cognitive functions or have evaluated their potential as biomarkers for diagnostic and prognostic purposes. In this study, we aimed to investigate whether plasma lncRNAs can be used to diagnose aMCI.
MATERIALS AND METHODS
Participants
The participants were Han Chinese and recruited from the Shanghai Mental Health Center, Shanghai Jiao Tong University School of Medicine, and the community of Xuhui District, China. This study is registered with the clinical trial registry number NCT04509271. Two attending psychiatrists diagnosed the normal controls (NCs), and patients with aMCI and AD, independently using the criteria of the National Institute on Aging and Alzheimer’s Association (NIA-AA 2011) [21]. The discovery group included 5 patients with aMCI and 5 NCs. Analytic group 1 included 5 patients with aMCI and 5 NCs. Analytic group 2 included 10 patients each with AD and aMCI, and 10 NCs. The validation group included 50 patients each with AD and aMCI, and 50 NCs. All participants underwent an extensive screening process, which included laboratory tests, physical examinations, the Mini-Mental State Examination (MMSE) [22, 23], Montreal Cognitive Assessment (MoCA) [24, 25], the Neuropsychological Tests Battery and assessment using the Activities of Daily Living Scale [26], and the Clinical Dementia Rating (CDR) Scale [27]. The CDR scores of the NC, aMCI, and AD groups were 0, 0.5 and 1, respectively, among all the study participants. We also screened the participants using the Geriatric Depression Scale [28] and the Hachinski Ischemia Scale [29]. Patients with depression were excluded from the study. This study was approved by the Institutional Ethics Committee of Shanghai Mental Health Center. All the participants or their legal guardians provided written informed consent. Figure 1A depicts the workflow of the study.
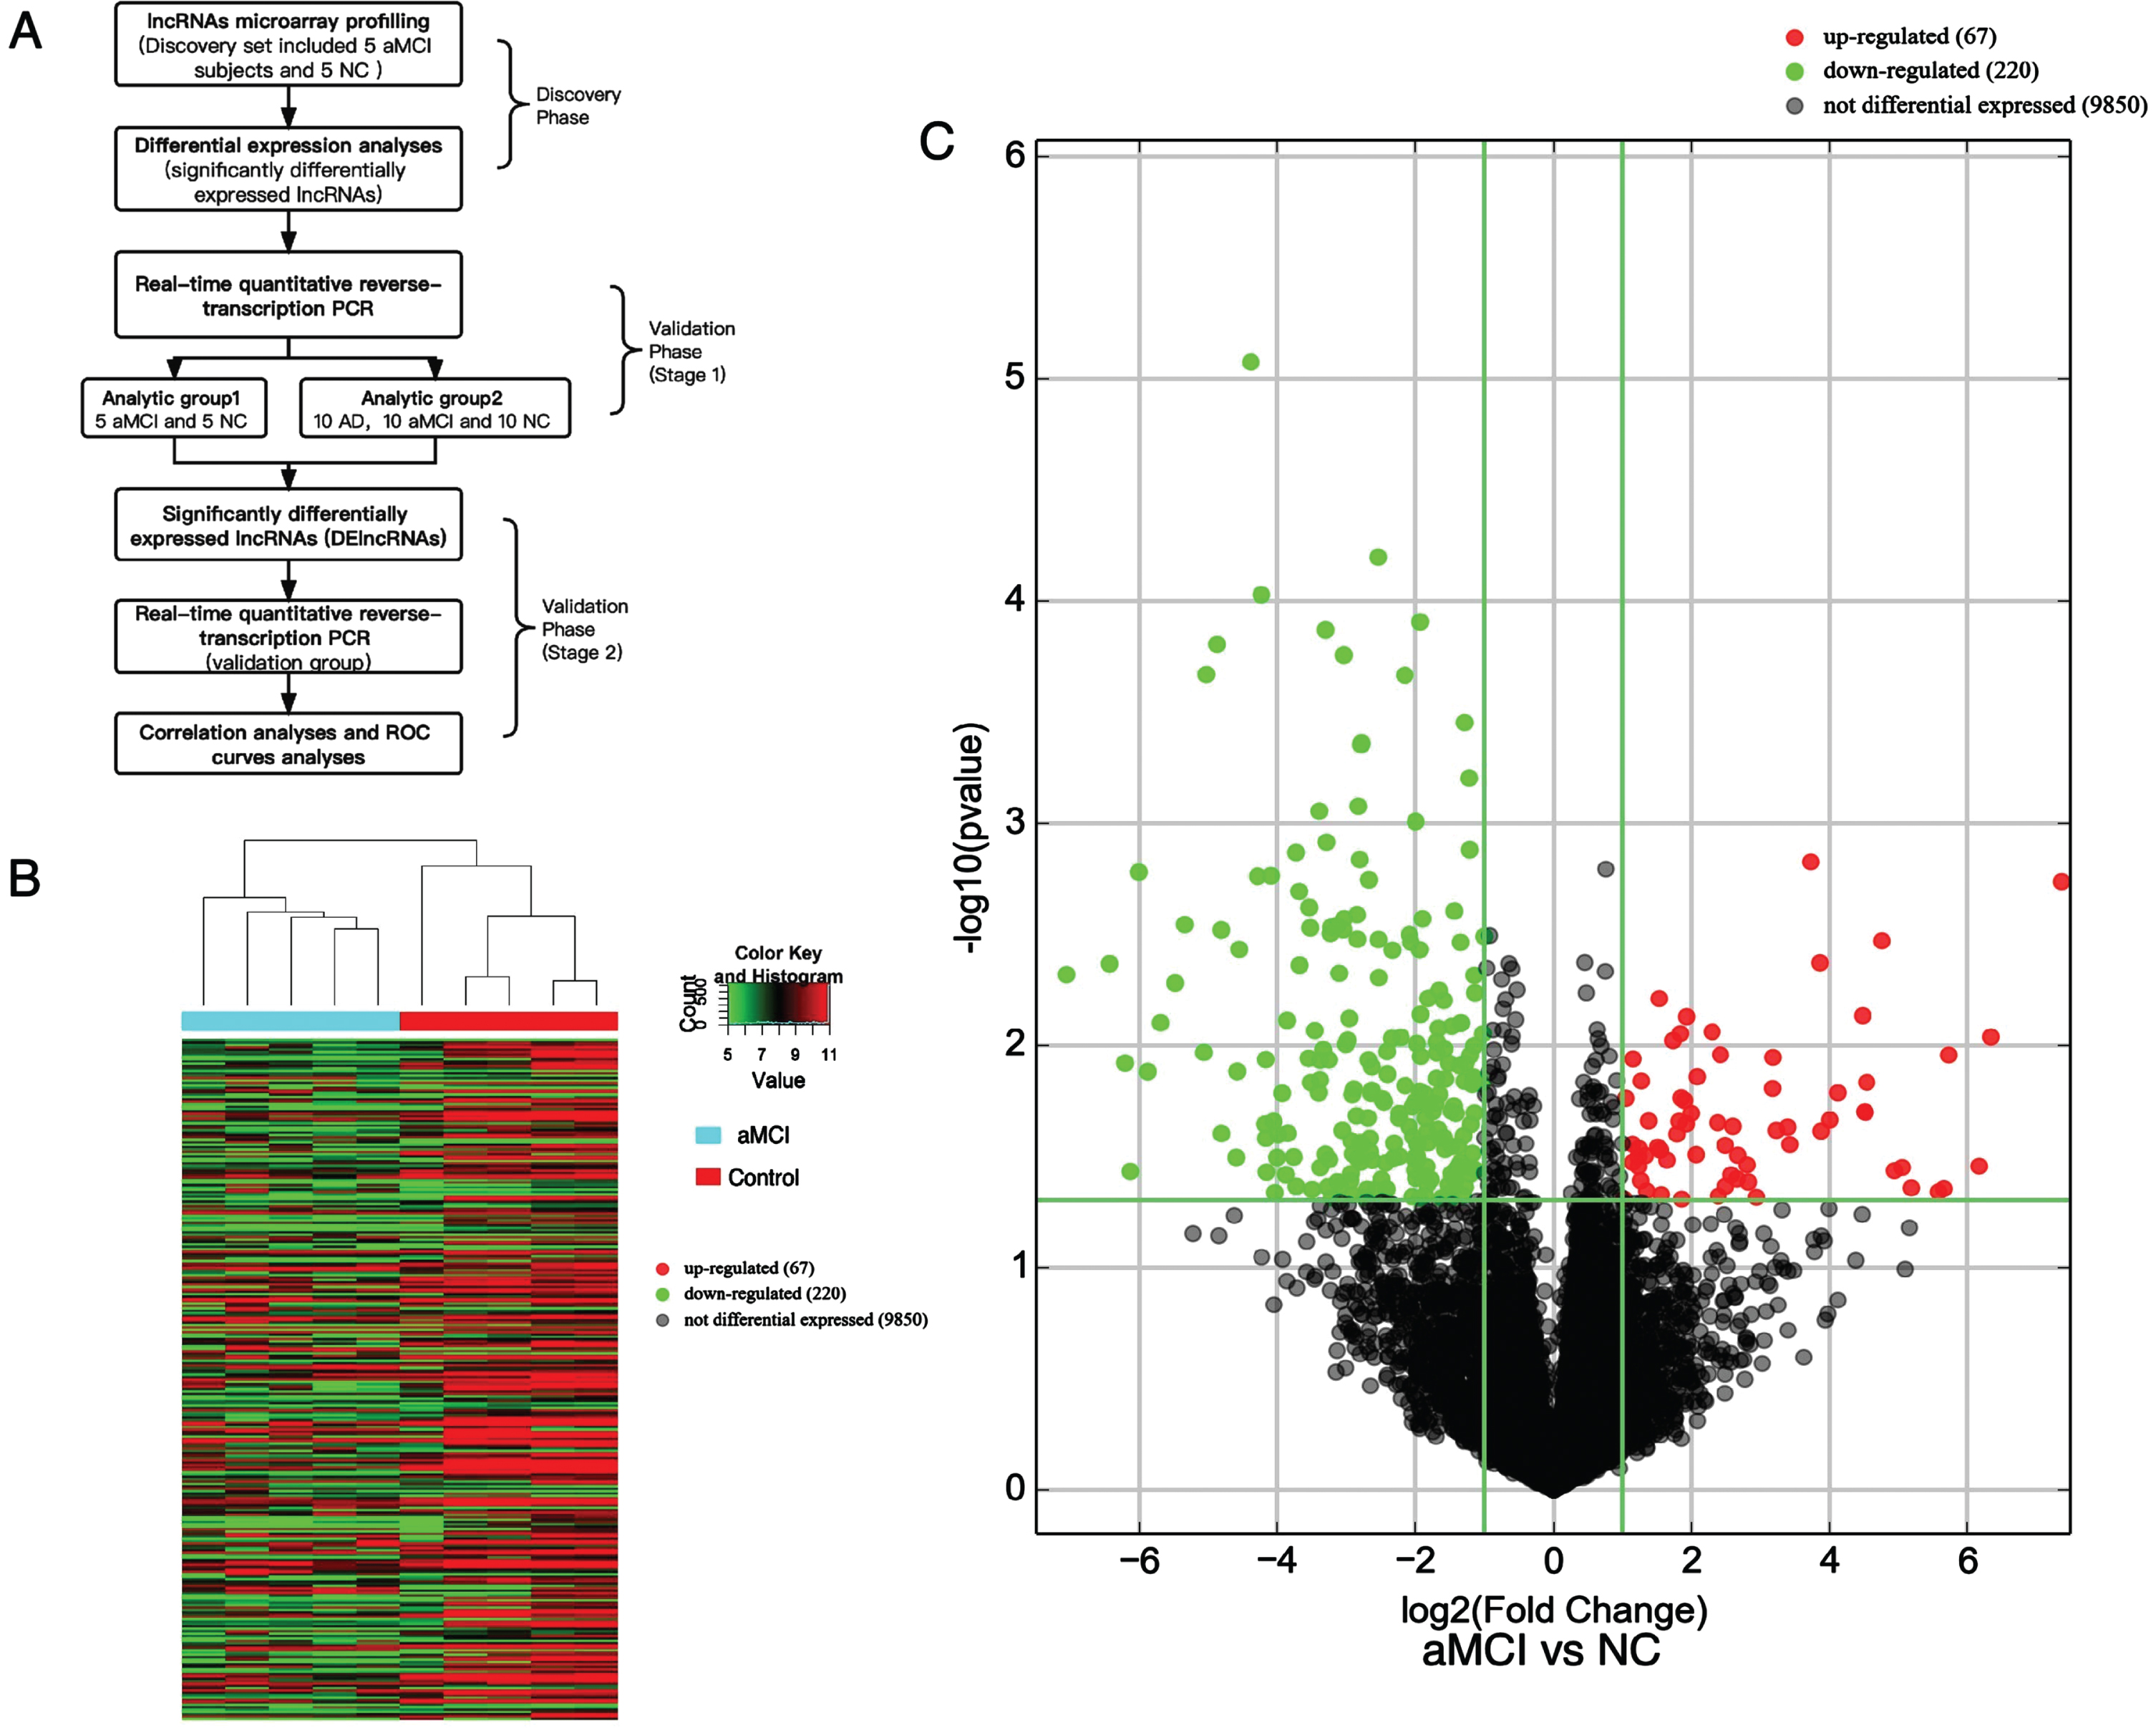
A) Workflow of the present study. B) Heatmap of DElncRNAs detected using the microarray. C) Volcano plots of all lncRNAs detected using the microarray in the discovery group. aMCI, amnestic mild cognitive impairment; AD, Alzheimer’s disease; NC, normal control.
Sample collection
Peripheral blood was collected from each participant after fasting for 12 h. Whole blood from the AD, aMCI, and NC groups was collected by venipuncture, placed in ethylenediaminetetraacetic acid anticoagulant tubes, and centrifuged at 3,000×g for 15 min. We performed density gradient centrifugation to separate the plasma from blood, which was stored at 80°C until use.
lncRNA microarray expression profiling
The expression of lncRNAs in the blood of the NCs and patients with aMCI was profiled using ArrayStar Human lncRNA Microarray analysis (Arraystar, Rockville, MD, USA). RNA was extracted from the plasma using the TRIzol Reagent (Invitrogen, Carlsbad, CA, USA). An Agilent ND-1000 instrument (Agilent Technologies, Santa Clara, CA, USA) was used to quantify the concentration and purity of the RNA. We calculated the expression levels of lncRNAs in each sample using the Arraystar Human LncRNA Microarray 4.0 (Arraystar). Sample labeling and array hybridization were performed according to the Agilent One-Color Microarray-based Gene Expression Analysis Protocol (Agilent Technologies). The hybridization solution was dispensed onto a gasket slide and assembled on the lncRNA expression microarray slide. The hybridized arrays were rinsed, fixed, and scanned using an Agilent DNA Microarray Scanner (Agilent Technologies). Primary data analysis was performed using Agilent Feature Extraction software (version 11.0.1.1; Agilent Technologies). We performed quantile normalization and subsequent data processing using GeneSpring GX v12.1 software package (Agilent Technologies). After normalization, differentially expressed lncRNAs (DElncRNAs) between the groups were identified based on the fold change (FC) and p-values.
Replicating results in the analytic and validation group and RT-qPCR
We determined the signatures of highly upregulated lncRNAs in a cohort of patients with aMCI using real-time quantitative reverse-transcription polymerase chain reaction (RT-qPCR) and compared them using bioinformatic analysis. Upon acquiring the lncRNA expression profiles from the microarray analysis, the upregulated lncRNAs were selected for further verification using RT-qPCR. The TRIzol reagent (Invitrogen) was used to extract the total RNA from the plasma. We used the Agilent ND-1000 instrument (Agilent Technologies) to quantify and determine the purity of the RNA. First-strand cDNA was synthesized using SuperScript III Reverse Transcriptase (Invitrogen), followed by treatment with an RNase Inhibitor (Epicenter, Madison, WI, USA). After selecting an appropriate cDNA template, we prepared a PCR standard curve using the Arraystar PCR Master Mix (Arraystar) using 2μL of cDNA. The PCR reaction was carried out according to the following procedure: 95°C, 10 min; followed by 40 PCR cycles (95°C, 10 s; 60°C, 60 s (collecting fluorescence)). After the amplification reaction was completed, the reactions were heated at 95°C for 10 s; 60°C for 60 s; and 95°C for 15 s. The reactions were then slowly heated from 60°C to 99°C (the instrument automatically performs a Ramp Rate of 0.05 C/s) to establish a melting curve for the PCR product. The DNA concentration of each sample was generated directly using the Rotor-Gene Real-Time Analysis Software 6.0 (Qiagen, Hilden, Germany). The relative levels of lncRNAs were then determined in terms of their FC, using the 2–ΔΔCT method [30], with 18 S rRNA as the endogenous control [31–33].
Statistical analysis
Quantitative variables are presented as means (standard deviations). We performed Mann–Whitney U tests, t-tests, analysis of variance (ANOVA), Student–Newman–Keuls (SNK) tests, and Kruskal–Wallis tests to compare the quantitative variables according to data normality. The chi-squared test was performed for the qualitative variables. A p-value < 0.05 indicated statistical significance. Univariate and multivariate logistic regression analyses were performed for the plasma levels of each lncRNA. A predictive model was constructed based on the multivariate logistic regression results. We assessed the specificity and sensitivity of each lncRNA and combined lncRNAs using receiver operating characteristic (ROC) curves. The optimal value was determined using the Youden’s index. Spearman’s correlation coefficients were calculated for the plasma lncRNA levels and the MoCA scores of patients with aMCI and NCs in the validation group. Statistical analyses and data processing were performed using SPSS 22.0 (IBM Corp., Armonk, NY, USA) and the R software [34], version 3.5.2. A single-blind approach was used for the statistical analysis. The experts carrying out the statistical analysis were blinded to the grouping.
RESULTS
Demographic and clinical characteristics of participants
The discovery group was used to identify DElncRNAs in five patients with aMCI and five NCs. There were no significant differences in the age, sex, or years of education between the aMCI and NC groups. In this group, all patients with aMCI were confirmed to present with positive brain Aβ deposition on 18F-Flumetamol PET-CT scans. Analytic group 1 comprised five patients with aMCI and five NCs. Analytic group 2 comprised 10 patients with AD, 10 patients with aMCI, and 10 NCs. No significant differences were observed between the groups in terms of the age, sex, or years of education. The validation group comprised 50 patients with AD, 50 patients with aMCI, and 50 NCs (Table 1). A significant difference in the MoCA scores (p < 0.05) was observed among the groups. Correlation analysis was conducted for the validation group. No correlation was observed for age, sex, years of education, and target lncRNA values in the validation group.
Clinical characteristics of the subjects
aData were analyzed using a two sample independent t-test; bData were analyzed using the 2test; cData were analyzed using the Mann-Whitney U test; dBrain Aβ location was detected using an 18F-Flumetomal PET-CT scan; e Data were analyzed using the ANOVA test; f Data were analyzed using the Kruskal–Wallis test among groups; aMCI, amnestic mild cognitive impairment; NC, normal control. AD, Alzheimer’s disease. MoCA, Montreal Cognitive Assessment. *p<0.05.
Overview of lncRNA data and varying lncRNA expression
lncRNA expression in the plasma of the patients with aMCI and NCs was profiled using a microarray in the discovery group (the data are openly available in the GEO database, reference number [GSE225304]). The microarray analysis generated 40,173 lncRNAs, comprising 32,667 with high confidence and 7,506 that have been studied previously. Using an FC threshold≥2.0 and a p-value<0.05, we identified 287 significantly dysregulated lncRNA transcripts, including 67 upregulated and 220 downregulated transcripts, in the patients with aMCI compared with the NCs. The results of clustering analyses of lncRNA expression were visualized using heatmaps and volcano maps (Fig. 1B, C). We selected 12 lncRNAs, namely, ENST00000567919, ENST00000413063, ENST00000425194, ENST00000532961, ENST00000549762, ENST00000567091, ENST00000462717, NR_024049, NR_040772, NR_131237, T324988, and T093863, based on their high FC values and significant p-values. Next, RT-qPCR was used to detect lncRNA expression in the peripheral blood samples of participants in the analytic and validation groups. In analytic group 1 and 2, ENST00000567919, ENST00000549762, NR_024049, NR_040772, and T324988 were identified as statistically significant DElncRNAs in the aMCI group compared with the NC group (Table 2). In the validation group, T324988, NR_024049, ENST00000567919, and ENST00000549762 showed significant differences (p < 0.001) in expression between the aMCI and NC groups, and were thus used to create a predictive model to diagnose aMCI (Table 3, Fig. 2).
Plasma lncRNA levels (–log10 (2ΔΔCT)) in analytic group 1 and 2
Analytic group 1 shows the expression of lncRNAs in the plasma separately, compared using a t-test; data for analytic group 2 was compared using analysis of variance (ANOVA), Student–Newman–Keuls (SNK) test was used for post-comparisons between the two groups. *p < 0.05. aMCI, amnestic mild cognitive impairment; NC, normal control; AD, Alzheimer’s disease.
Plasma lncRNA levels (–log10 (2ΔΔCT)) in the validation group
The expression of lncRNAs in the plasma among the three groups was compared using analysis of variance (ANOVA) (accounting to age, sex, and education years). The Student-Newman-Keuls (SNK) test was used for post-comparisons between the two groups. *p<0.05. aMCI, amnestic mild cognitive impairment; NC, normal control; AD, Alzheimer’s disease.

The relative expression levels of candidate biomarkers in the validation group, calculated using the 2ΔΔCT method. ***p<0.001. aMCI, amnestic mild cognitive impairment; ns, not significant; NC, normal control.
Panel comprising four lncRNAs as biomarkers for aMCI
The MoCA scores correlated significantly with plasma lncRNA expression levels (Fig. 3). In the validation group, we used ROC analysis to reveal the diagnostic efficacy of plasma lncRNA expression as an aMCI biomarker. LncRNA T324988 displayed the highest diagnostic efficiency for aMCI, with an area under the ROC curve of 0.900 (95% confidence interval: 0.833–0.966, p < 0.001). According to the Youden index, the optimal cutoff value was 0.243, with a sensitivity of 92.00% and specificity of 82.50% (Fig. 4). The predictive effects of the four lncRNAs were assessed using logistic regression analysis. Based on the multivariate logistic regression results, we constructed the following predictive model: 4.749 + 7,972.194 (the expression level of ENST00000549762)+5,609.072 (the expression level of NR_024049)+5.073 (the expression level of T324988)+961.747 (the expression level of ENST00000567919). This predictive model could discriminate patients with aMCI from the NCs. The area under the ROC curve for the combined model was 0.941. According to the Youden index, the optimal cutoff value was 0.839, with a sensitivity of 92.00% and specificity of 84.00% (Fig. 4).
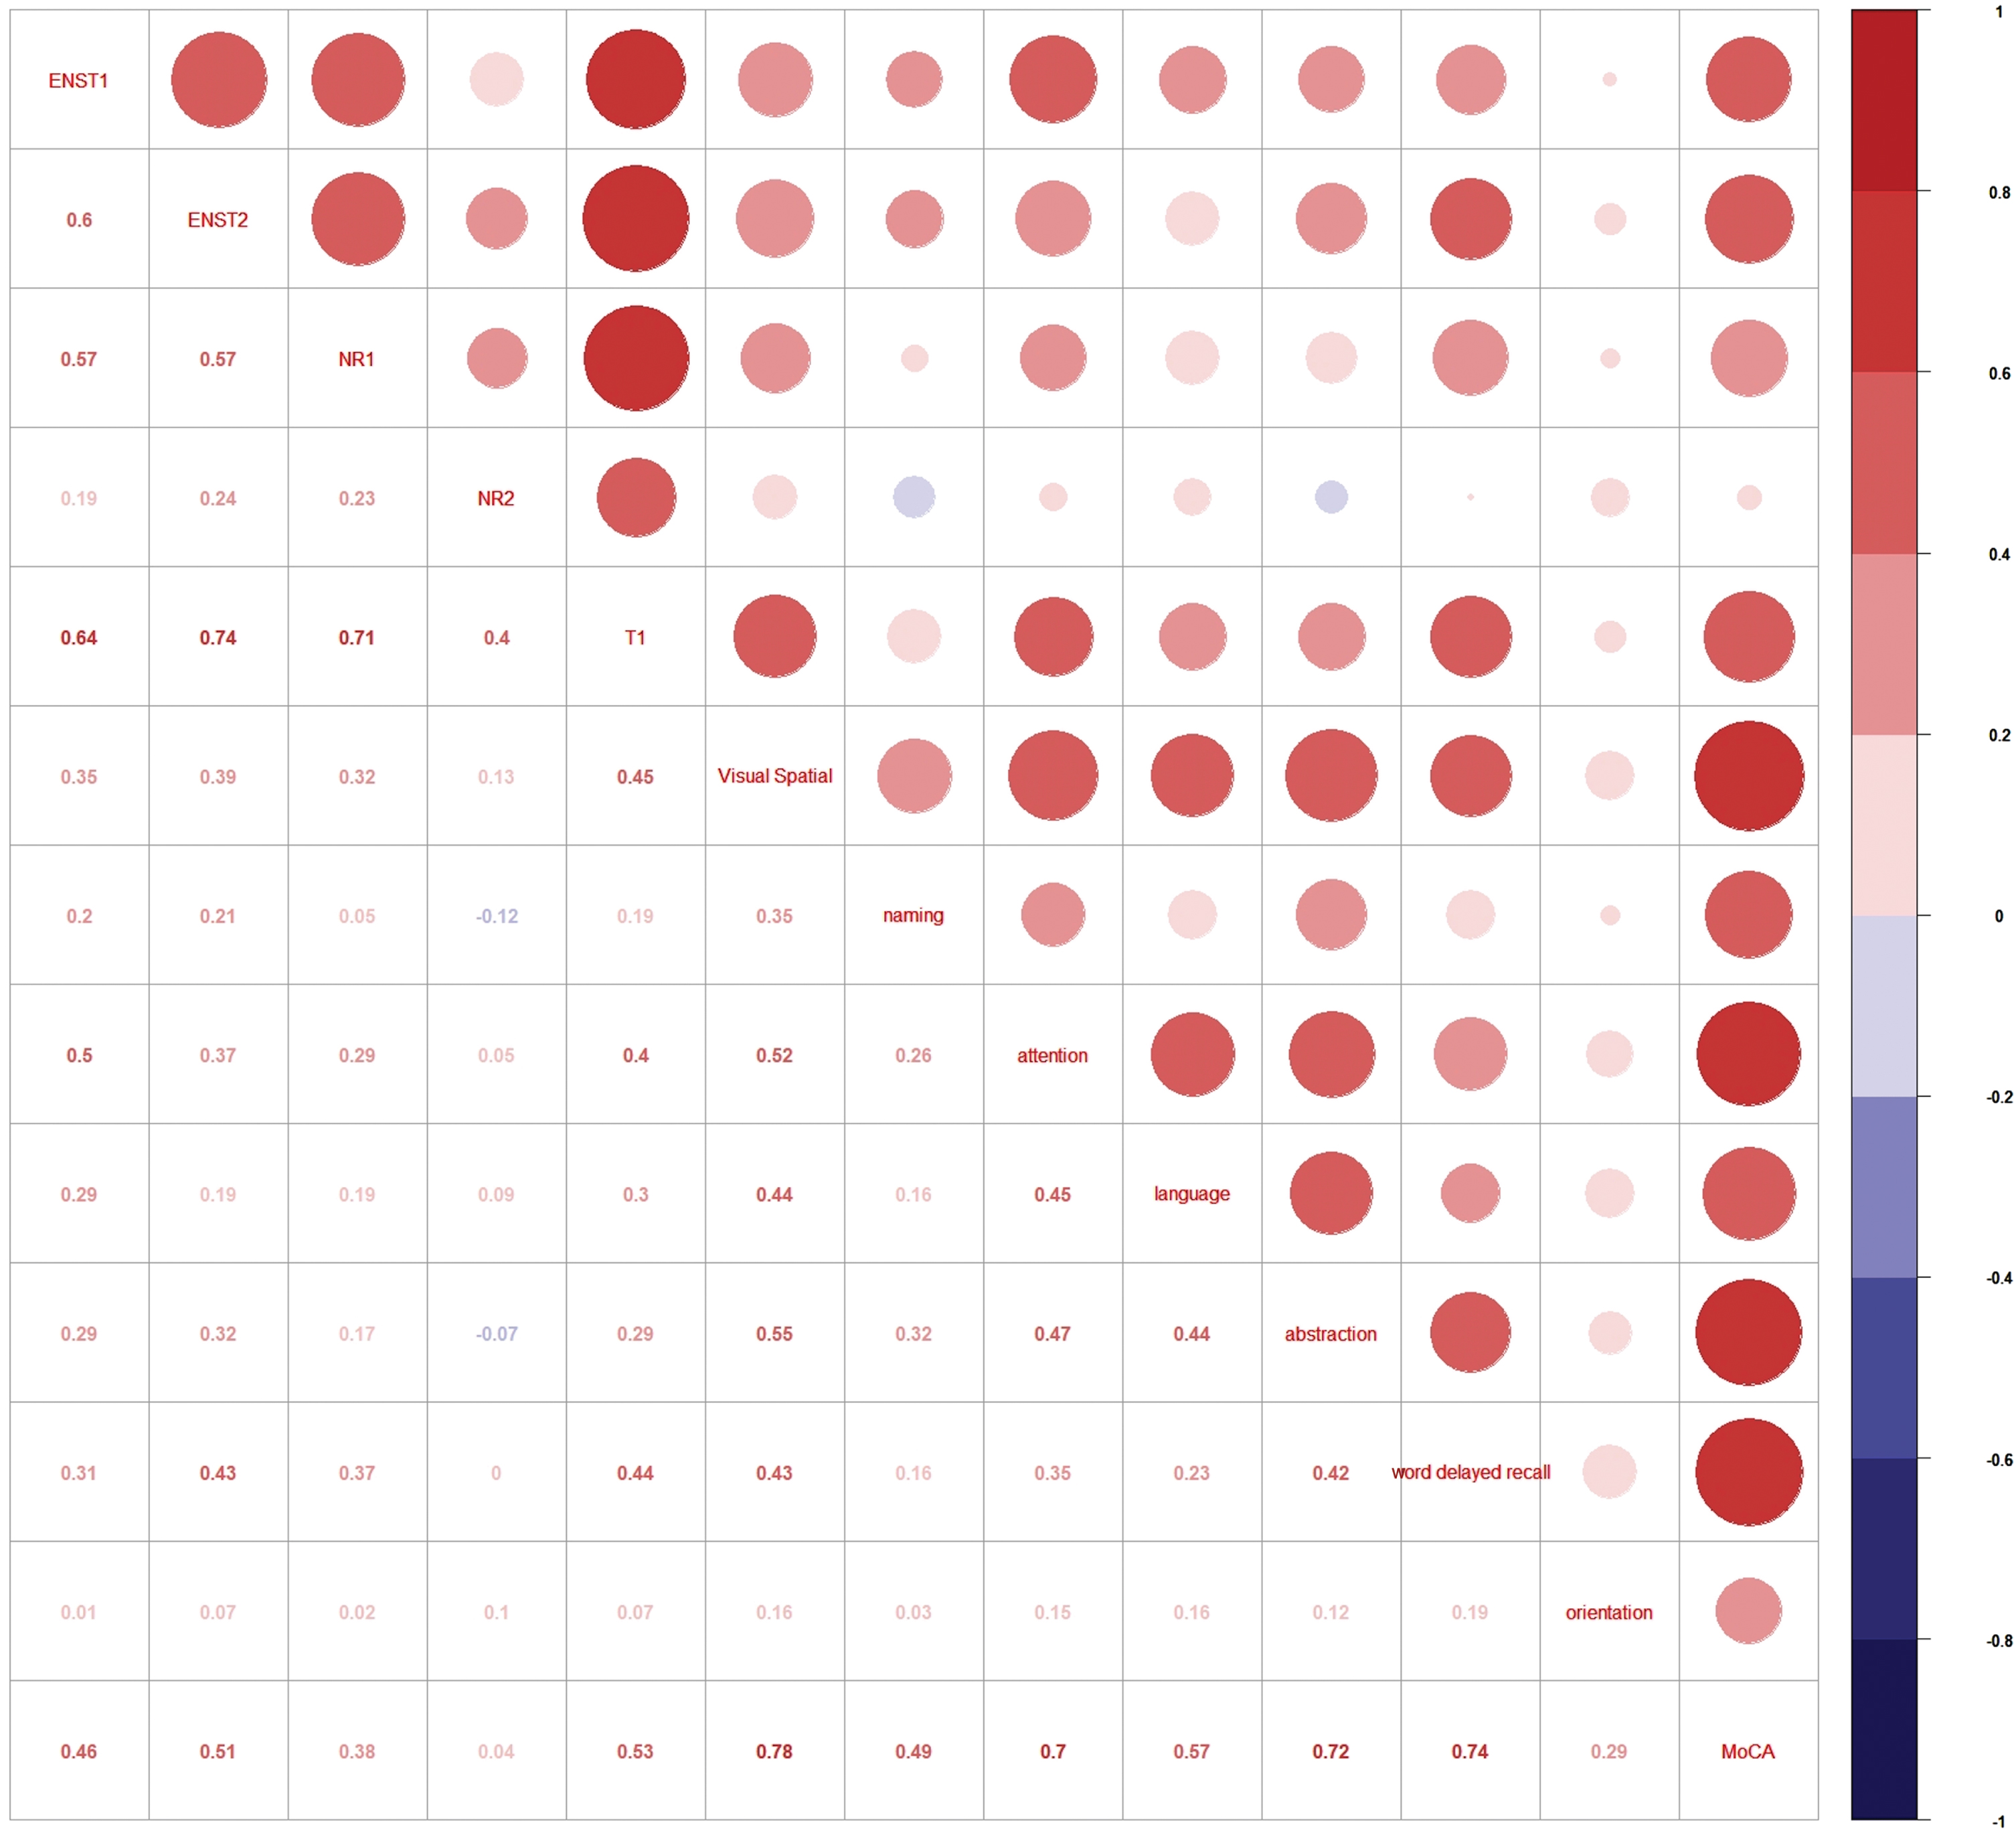
Spearman correlation of candidate biomarkers (ENST00000567919, ENST1; ENST00000549762, ENST2; NR_024049, NR1; NR_040772, NR12; T324988, T1) with their MoCA scores (visual spatial, naming, attention language, abstraction, world delayed recall, and orientation) in the validation group. Red circles indicate a positive correlation. MoCA, Montreal Cognitive Assessment.
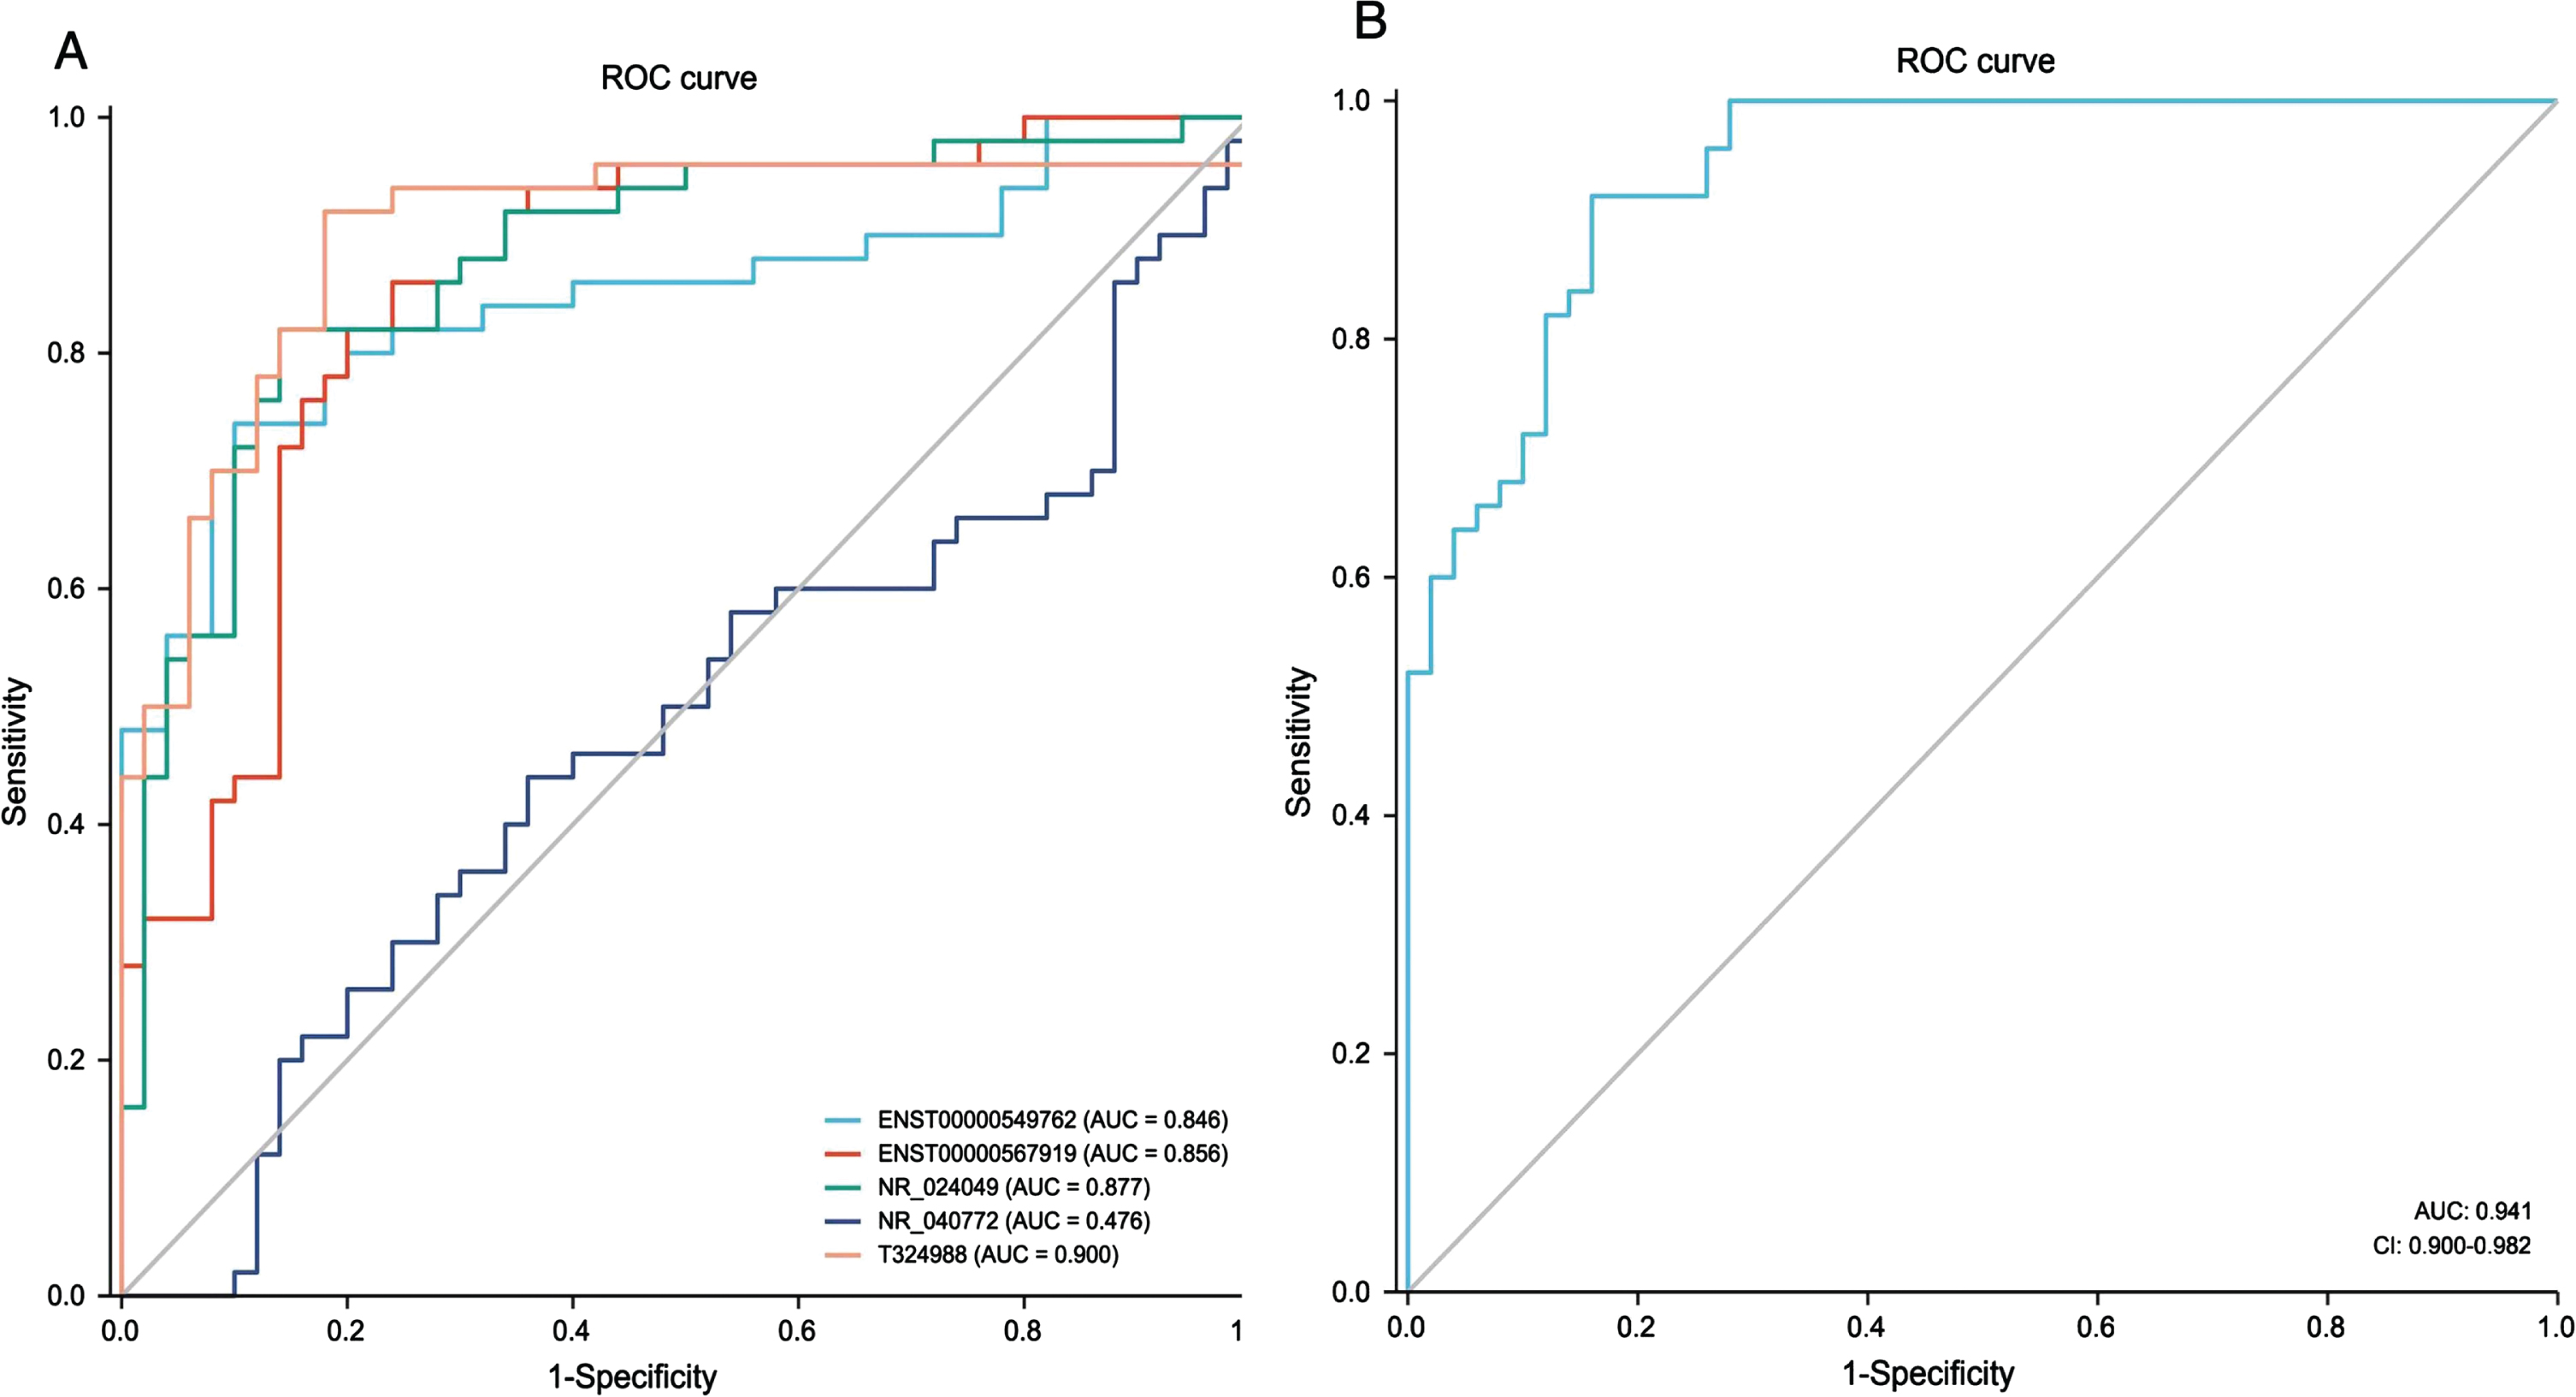
Receiver operating characteristic (ROC) curves of each candidate biomarker to discriminate patients with aMCI from NC in the validation group. ROC curve results of the predictive model (ENST00000567919, ENST00000549762, NR_024049, and T324988) for aMCI diagnosis. aMCI, amnestic mild cognitive impairment; NC, normal control.
DISCUSSION
Aβ plaque and p-tau level detection can distinguish accurately patients with clinical AD from individuals with normal cognition [35]. Even during the prodromal stage of AD, biomarkers such as the Aβ_ 42/Aβ_ 40 ratio, p-Tau181, and p-Tau217, have been suggested to detect AD pathology and predict disease progression [36]. The value of plasma biomarkers in detecting AD pathology has been demonstrated, even during the prodromal stage [37]. However, Weiner reported that cognitively normal individuals and patients with MCI are heterogeneous, and include groups typified not only by the “classic” AD pathology, but also by normal biomarkers, accelerated decline of the disease, and suspected non-Alzheimer’s pathology [38]. Jansen reported that amyloid pathology prevalence increased from 10% to 44%, and from 27% to 71%, in individuals with normal cognition and patients with MCI, respectively, aged from 50 to 90 years old [15]. Most drug development studies incorporate fluid- or imaging-based biomarkers to recruit participants and validate the efficacy of drugs [39–41]. However, novel biomarkers are required for the early and effective diagnosis of AD. Particularly, molecular biomarkers that can detect atrisk individuals at the early stages of changes that affect their cognitive status should be identified. This approach applies to other neurodegenerative pathologies that can be evaluated using blood [42]. Circulating lncRNAs are potentially interesting biomarkers of aMCI because they can reflect complex alterations in numerous cellular processes, which might indicate multiple pathologies [43]. Herein, we observed and identified altered lncRNA profiles in the plasma of patients with aMCI. The signatures of four lncRNAs correlated significantly with cognitive decline, as indicated by the FC analysis. This correlation supports the potential of lncRNAs as peripheral blood biomarkers of aMCI. Our findings identified lncRNAs that might serve as effective supplements to the existing AD plasma biomarkers.
This study reports dysregulated lncRNAs in the plasma of patients with aMCI and addresses the diagnostic shortcomings of current methodologies using lncRNAs. Microarray analysis was performed on the peripheral blood of patients with aMCI. We identified 287 significantly dysregulated lncRNAs in these patients compared with those in the NCs. We performed RT-qPCR to assess and compare the stability of these lncRNAs between the analytical and validation groups. Five upregulated lncRNAs in the analytical group were identified as viable biomarkers: T324988, NR_024049, ENST00000567919, NR_040772, and ENST00000549762. Finally, four of the five upregulated lncRNAs were determined as statistically significant and were included in the predictive model: T324988, NR_024049, ENST00000567919, and ENST00000549762. In the validation group, the MoCA scores correlated positively with plasma lncRNA expression levels. Thus, these four lncRNAs are likely involved in changes in the cognitive status of patients with aMCI and with its underlying molecular and cellular mechanisms.
The pathological processes associated with neurodegenerative diseases are complex; therefore multiple pathways can lead to the occurrence of AD. To improve the diagnostic accuracy of these biomarkers, we created a predictive model based on the four upregulated lncRNAs. In the validation group, these four lncRNAs were statistically significant independent risk factors for aMCI, as indicated by the multivariate analysis. Overall, these lncRNAs are promising peripheral blood biomarkers to distinguish patients with aMCI from NCs. The diagnostic methods for AD include cognitive assessment, PET or CSF marker detection, and neuroimaging; however, we still lack aMCI diagnostic methods [44].
CSF biomarkers appear to reflect biochemical alterations in the brain caused by changes in CSF Aβ_ 42, total-tau, and p-tau levels in the early stages of AD. However, CSF collection involves an invasive procedure, which limits its use in primary care and longitudinal studies [35]. Plasma phosphorylated tau181 could represent an accessible tool to identify AD in individuals with symptoms of cognitive or behavioral decline, but not in those with MCI [45]. Our approach is rapid, easy to screen, accurate, and cost-effective to identify the aforementioned four lncRNAs in high-risk individuals in primary care settings. LncRNAs are particularly interesting as potential biomarkers because changes in their levels are central to several diseases in humans, including neurodegenerative diseases, cardiovascular diseases, and cancers [46]. In addition, lncRNAs, such as lncRNA 51A, brain-derived neurotrophic factor (BNDF)AS, and BC200, exhibit diverse biological characteristics and functions. lncRNA 51A is associated with the dysregulation of sorting-related receptor 1 [47]. BNDF-AS might interact with Aβ plaques found in AD, thereby negatively affecting brain-derived neurotrophic factor levels [47]. lncRNA BC200 is primarily expressed in the hippocampus and neocortex, and might play a role in regulating protein synthesis [47, 48]. Thus, several lncRNAs are involved in the occurrence and development of AD and have the potential to be used as drugs to treat neurodegenerative diseases.
The signatures of the four circulating lncRNAs correlated with cognitive function and are associated with cognitive decline. TaqMan technology was used to evaluate lncRNA expression, and RT-qPCR was used to evaluate lncRNA stability. RT-qPCR is one of the most commonly used methods to quantify lncRNA expression, owing to its high specificity. The results of the present analysis highlighted that blood lncRNAs as suitable molecular biomarkers for neurodegenerative diseases.
To date, a few studies have identified and validated appropriate lncRNAs in the plasma samples of patients with aMCI. For example, a recent research only identified certain lncRNAs in the blood of patients with MCI compared with control samples; however, the study had not provided specific diagnostic value [20]. Our study provides novelty lncRNAs model with potential diagnostic ability for aMCI in clinical practice. Age-associated cognitive diseases, including AD, are multifactorial. Our results are preliminary, and the mechanisms of action of these four lncRNAs have not been confirmed. Further studies are required to determine the underlying molecular mechanisms of the involvement of lncRNAs in pathological processes of the central nervous system, particularly in neurodegenerative diseases. Moreover, this pilot study was based on a cross-sectional analysis that confirmed its ability to distinguish aMCI from NC; however, it did not demonstrate the ability of the model to be used throughout the progress of AD pathology. To further validate our predictive model, a longitudinal study should be performed in the future. Finally, researchers should consider aMCI and AD in terms of AD pathology, particularly Aβ pathology. Several patients with clinical aMCI do not present with positive Aβ deposition [37]. In patients with clinical AD, the positive rate of Aβ PET imaging ranges from 79% to 91.5% [15]. The core clinical diagnostic criteria for AD (NIA-AA 2011) have high overall diagnostic accuracy. In this study, we examined the amyloid pathology in the discovery group. We recruited patients with aMCI and AD for the analytic and validation groups, according to the key clinical criteria (NIA-AA 2011), instead of relying solely on pathological diagnosis, to achieve the most universally feasible early diagnosis. In the future, we intend to conduct multicenter research with identical clinical criteria and combine reference pathological markers to confirm this novel aMCI peripheral blood diagnostic biomarker panel.
In conclusion, lncRNA analysis in the peripheral blood revealed a novel source of viable biomarkers that can be used to diagnose the early stages of AD in high-risk patients. Specifically, upregulation of T324988, NR_024049, ENST00000567919, and ENST00000549762 indicates aMCI pathology. Accessing these molecules is conducive to primary care or home-based test applications, being minimally invasive, more affordable, and better able to detect individuals at risk of cognitive decline.
AUTHOR CONTRIBUTIONS
Tao Wang (Conceptualization; Methodology; Resources; Data Curation; Writing – Original Draft; Writing – Review & Editing; Supervision; Project administration; Funding acquisition), Wei Zhang (Methodology; Validation; Investigation; Data Curation; Writing – Original Draft; Visualization), Joshua M.A. Maclin (Writing – Original Draft; Visualization), Hua Xu (Investigation; Data Curation), Bo Hong (Investigation; Data Curation), Feng Yan (Investigation; Data Curation), Yuanyuan Liu (Investigation; Data Curation), Haining He (Investigation; Data Curation), Huafeng Liang (Resources), Chunbo Li (Supervision), Yiru Fang (Supervision), Shifu Xiao (Supervision).
Footnotes
ACKNOWLEDGMENTS
We thank all investigators, participants, caregivers, and families who participated in this study.
FUNDING
This work was supported by the National Key Research and Development Program [grant number 2022YFC3600600]; the National Natural Science Foundation of China [grant number 81571298]; the Shanghai Municipal Education Commission-Gaofeng Clinical Medicine Grant Support [grant number 20172029]; and the Innovative Research Team of High-level Local Universities in Shanghai.
CONFLICT OF INTEREST
The authors have no conflict of interest to report.
DATA AVAILABILITY
The datasets generated and/or analyzed in the current study are available in the Gene Expression Omnibus (GEO) database (GSE225304).