
Abstract
Background:
Although sporadic Alzheimer’s disease (AD) is a neurodegenerative disorder of unknown etiology, familial AD is associated with specific gene mutations. A commonality between these forms of AD is that both display multiple pathogenic events including cholinergic and lipid dysregulation.
Objective:
We aimed to identify the relevant lipids and the activity of their related receptors in the frontal cortex and correlating them with cognition during the progression of AD.
Methods:
MALDI-mass spectrometry imaging (MSI) and functional autoradiography was used to evaluate the distribution of phospholipids/sphingolipids and the activity of cannabinoid 1 (CB1), sphingosine 1-phosphate 1 (S1P1), and muscarinic M2/M4 receptors in the frontal cortex (FC) of people that come to autopsy with premortem clinical diagnosis of AD, mild cognitive impairment (MCI), and no cognitive impairment (NCI).
Results:
MALDI-MSI revealed an increase in myelin-related lipids, such as diacylglycerol (DG) 36:1, DG 38:5, and phosphatidic acid (PA) 40:6 in the white matter (WM) in MCI compared to NCI, and a downregulation of WM phosphatidylinositol (PI) 38:4 and PI 38:5 levels in AD compared to NCI. Elevated levels of phosphatidylcholine (PC) 32:1, PC 34:0, and sphingomyelin 38:1 were observed in discrete lipid accumulations in the FC supragranular layers during disease progression. Muscarinic M2/M4 receptor activation in layers V-VI decreased in AD compared to MCI. CB1 receptor activity was upregulated in layers V-VI, while S1P1 was downregulated within WM in AD relative to NCI.
Conclusions:
FC WM lipidomic alterations are associated with myelin dyshomeostasis in prodromal AD, suggesting WM lipid maintenance as a potential therapeutic target for dementia.
Keywords
INTRODUCTION
Alzheimer’s disease (AD) is the most common type of dementia, characterized by a progressive deterioration of cognitive function. In addition to the amyloid-β (Aβ) plaques, neurofibrillary tangles, and cholinergic deficits, clinical and epidemiological investigations have linked disrupted lipid metabolism with the pathogenesis and progression of AD [1]. Previous studies using lipid extractions have shown decreases in cortical polyunsaturated fatty acids and monounsaturated fatty acids in AD [2]. Docosahexaenoic acid (DHA) and arachidonic acid (AA), which are the most abundant brain polyunsaturated fatty acids are downregulated in hippocampus [3], cortical levels of phosphatidylcholine (PC), phosphatidylinositol (PI), and phosphatidylethanolamine (PE) are reduced, while diacylglycerols (DG) increase [4, 5] in AD. Sphingomyelin (SM), galactosylceramides, and sulfatides, important components of myelination, are lower in cortical areas in AD and subjects with very mild dementia [6–9]. In addition, a loss of ceramide synthase 2, that produces very long acyl chain lipids of myelin, precedes neurofibrillary tangle pathology in temporal and frontal cortical grey matter (GM) in AD [10]. Despite evidence of lipidomic dysregulation, its role in the pathogenesis of AD remains unexplored. During the past several years the development of matrix-assisted laser desorption/ionization mass spectrometry imaging (MALDI-MSI), which is capable of the simultaneous visualization of the spatial distribution of hundreds of thousands of lipids in a label-free manner [11–13] provided a new tool for the investigation of lipids in AD. For example, MALDI-MSI was employed to investigate the spatial correlation of lipids within Aβ plaques [14, 15] and to discover novel therapeutic approaches centered around the modulation of lipid signaling in AD animal models [16–18]. The application of MALDI-MSI based lipidomic research reported a reduction of sulfatides, myelin specific lipids in the FC [19] and a decrease of DHA-containing PC in temporal GM of late-stage AD patients [20, 21].
The FC, a component of the default mode network [22], which plays a key role in the modulation of episodic memory, displays cholinergic deficits and alterations in choline-containing lipids (e.g., PC and SM) in AD [23, 24]. However, the relationship between lipid and cholinergic dysregulation during the onset of AD remains unknown. Disruption in lipid homeostasis may lead to cholinergic dysfunction, due changes in phospholipid and sphingolipid pathways that are critical for cell membrane repair and production of the neurotransmitter acetylcholine (ACh), which are affected in AD [25, 26]. Since cannabinoid 1 (CB1) and sphingosine 1-phosphate 1 (S1P1) receptors are the most widespread lipidic neuromodulators within the central nervous system and their endogenous ligands are derived from membrane lipid precursors, changes in the activity of these receptors likely play a key role in the modification of lipid homeostasis [27–29], which may be altered in AD. In this regard, CB1 activity is increased following basal forebrain cholinergic denervation [30] and the modulation of the release of ACh in rat cortex [31], suggesting an interaction between cannabinoid and cholinergic systems resulting from cannabinoid activation via muscarinic receptors [32, 33]. Although FC CB1 receptor activity is alter in AD [34] and even upregulated in the early stages of the disease [35, 36], others report no change or a decrease in sporadic AD [37, 38]. However, lysophospholipid S1P1, which is also activated after cholinergic muscarinic signaling [33] is decreased in the superficial layers of the FC in severe AD [39]. Therefore, to develop new strategies of pharmacological intervention for the treatment of AD, the aim of the present study was to identify early lipid dysregulation within GM and white matter (WM) and their relationship with CB1, S1P1 and muscarinic receptor activity in the FC during the onset of AD, using MALDI-MSI and functional autoradiography.
MATERIALS AND METHODS
Subjects
The study included 15 cases with a premortem clinical diagnosis of no cognitive impairment (NCI, n= 5; 86.27±4.8 years), mild cognitive impairment (MCI, n= 5; 83.32±7.4 years), and mild to moderate AD (AD, n= 5; 92.04±5.4 years) from the Rush Religious Orders Study (RROS) and 6 younger-aged controls (YAC, 68.83±7.9 years) non cognitively impaired Braak stage 0 cases obtained from the Biobank of the Basque Country and Asturias Central University Hospital (see Table 1).
Demographic, cognitive, and neuropathological variables stratified by clinical group
*n= 5, n/a: not applicable, ns, non-significant; CERAD, Consortium to Establish a Registry for Alzheimer’s Disease.
The Human Research Committees of Rush University Medical Center and Dignity Health approved this study and written informed consent for research and brain autopsy was obtained from the participants or their family/guardians. The YAC samples were obtained at autopsy following informed consent in accordance with the ethics committees of the University of the Basque Country (UPV/EHU) (CEISH/244MR/2015/RODRIGUEZ PUERTAS), following the Code of Ethics of the World Medical Association (Declaration of Helsinki) and warranting the privacy rights of the human subjects. Samples and data from donors included in this study were provided by the Principado de Asturias BioBank (PT13/0010/0046), integrated in the Spanish National Biobanks Network and they were processed following standard operating procedures with the appropriate approval of the Ethical and Scientific Committees.
Clinical and neuropathological evaluation
The demographic, clinical, and neuropathological characteristics of the cases provided by the RROS and the Biobank of the Basque Country and Asturias Central University Hospital are presented in Table 1. Although a similar detailed clinical evaluation was not available for the YAC cases, there was no evidence of cognitive difficulties or neurological disease in their medical records. Clinical criteria for NCI, MCI, and AD RROS cases have been reported in numerous previous publications [40, 41]. The RROS clinical evaluation was designed to determine the presence of dementia and its etiology, with particular attention paid to AD. Examination of medical history included uniform, structured questions about cognitive decline, stroke, Parkinson’s disease, head injury, tumor, depression, and other medical problems. Medications used within the previous 14 days of examination were reviewed. A uniform structured neurologic examination was carried out by trained nurse clinicians and neuropsychology technicians administered a battery of cognitive tests. Tests were chosen to assess a range of cognitive tasks with an emphasis on those affected by aging and AD (e.g., Mini-Mental State Examination (MMSE) [42], Consortium to Establish a Registry for Alzheimer’s Disease (CERAD) neuropsychological test measures: Verbal Fluency, Boston Naming, Word List Memory, Word List Recall and Word List Recognition [43], oral version of Symbol Digit Modalities Test [44], Logical Memory (Story A) and Digit Span subtests of the Wechsler Memory Scale-Revised [45], Complex Ideational Material [46], Judgment of Line Orientation [47], and subsets of items from the Standard Progressive Matrices [48]. A caveat of neuropsychological tests is that they do not measure cognition uniformly across different levels of education, educationally adjusted cut points were used for rating impairment on each test based on prior test use and existing reports in the literature. A computer algorithm applies these cut points uniformly and converted each participant’s score into deficit ratings in five cognitive domains (orientation, attention, memory, language, and perception) [49, 50]. An impaired score was developed for each domain that entailed dysfunction on several tests within that domain. A board-certified neuropsychologist, blinded to a participant’s demographics, clinical data except education, occupation, and information about sensory or motor deficits used these findings to summarize deficits in each of the five cognitive domains as probable, possible or not present. For those cases with borderline dementia an opinion regarding the probability of dementia and AD is made by the neuropsychologist. A clinical diagnosis was then made by a board-certified neurologist with expertise in the evaluation of older people in combination with a neuropsychologist’s opinion of cognitive impairment and the presence of dementia. The diagnosis of dementia and AD was made based upon the recommendations of the joint working group of the National Institute of Neurological and Communicative Disorders and the Stroke and the Alzheimer’s Disease and Related Disorders Association (NINCDS/ADRDA) [51]. MCI criteria are compatible with those used by many others to describe persons who are not cognitively normal but fail to meet accepted criteria for dementia [52–54]. Here, MCI was defined as those persons rated as impaired on neuropsychological testing by the neuropsychologist but were not determined to be demented by the examining neurologist. Average time from the last clinical evaluation to death was ∼8 months.
Postmortem neuropathology for the RROS cases was performed as reported previously [41, 55], which included Braak staging [56], NIA-Reagan [57], and CERAD [58] criteria. A board-certified neuropathologist excluded cases with other pathologies (e.g., cerebral amyloid angiopathy, vascular dementia, dementia with Lewy bodies, hippocampal sclerosis, Parkinson’s disease, and large strokes) and those treated with acetylcholinesterase inhibitors.
Cortical samples
Frontal cortex samples from Brodmann area 9, which contained the superior longitudinal WM tract, were immediately frozen at –80°C, cut into 20 μm thick sections onto gelatin-coated slides using a cryostat (Microm HM550, Walldorf, Germany) and stored at –25°C prior autoradiography and MALDI-MSI assay. Functional autoradiography of M2/M4, CB1, and S1P1 receptors were performed using tissue from NCI, MCI, and AD cases. MALDI-MSI was performed using tissue from the YAC, NCI, MCI, and AD groups.
MALDI-MSI
We used matrix-assisted laser desorption ionization as an imaging mass spectrometry method (MALDI–MSI) for the analysis of the lipid composition and anatomical distribution within FC GM and WM. Prior to the lipid analysis, sections from all cases, were sprayed (six passes) with cyano-4-hydroxycinnamic acid (CHCA) as a chemical matrix at 10 mg/ml concentration in 50% methanol using a Tissue MALDI sprayer (TM sprayer, HTX Technologies, LCC, Carrboro, NC, USA) with a flow rate of 120 ml/min at 70°C. We scanned the samples in both positive and negative ionization mode, in the range of m/z 500–1300 with a LTQ–Orbitrap–XL mass spectrometer (Thermo Fisher Scientific, San Jose), equipped with a nitrogen laser of λ= 337 nm, using a repetition rate = 60 Hz and a spot size = 80×120 μm. The scanned parameters were 2 μscans/step with 10 laser shots and a raster step size of 100 μm at laser fluency of 15–40 μJ.
The area scanned in each group included all cortical layers and WM (Fig. 1A-D, region outlined by black box). For statistical analysis, lipid intensities in the WM and GM delimited by red circles (Fig. 1A-D) were exported separately in positive and negative ions using MSiReader software [59], as the average of absolute intensity in arbitrary units from each area and ionization mode. In addition, we exported the intensities from 5 lipid islands and 5 areas not containing similar accumulation within the GM in the positive ion mode. Lipid assignment was performed based on the m/z values with a 5-ppm mass accuracy as the tolerance window [60] using Lipid Maps (http://www.lipidmaps.org) or the Human metabolome Database (http://www.hmdb.ca) [59, 61] and reported previously [62–66]. For illustrative purposes, a section from each group was first scanned and then counterstained with thionine to aid in cytoarchitectonic determination [60] (see Fig. 1).

MALDI-MSI ion lipid species distribution showing significant differences in frontal cortex WM intensities between YAC, NCI, MCI, and AD cases. In the thionine-stained sections the rectangle (black box) indicates the area scanned by MALDI-MSI and the red oval denotes the area exported for analysis from a YAC (A), NCI (B), MCI (C), and an AD (D) case. MALDI-MSI color images of the distribution of diacylglycerol (DG) 36:2 (E-H), 38:5 (I-L), phosphatidic acid (PA) 40:6 (M-P), phosphatidylinositol (PI) 38:5 (Q-T), 38:4 (U-X) in the FC. Note that all lipids displayed an increase in intensity in the older NCI (F, J, N, R, and V) compared to YAC (E, I, M, Q, and U) cases. WM intensity of DG 36:2, 38:5 and PA 40:6 was significantly higher in MCI (G, K, and O) compared to NCI (F, J, and N) cases while WM intensity of PI 38:5 and 38:4 was significantly lower in AD (T and X) compared to NCI (R and V). Scale bar = 4 mm. Multi-colored ion intensity scale values: DG 36:2 = 0 – 4×10⁵ A.U, DG 38:5 = 0 – 2×10⁵ A.U, PA 40:6 = 0 – 3×10⁵ A.U, PI 38:5 = 0 – 2×10⁵ A.U and PI 38:4 = 0 – 3×10⁷ A.U.
Functional autoradiography of activated Gαi/o proteins using a [35S] GTPγS binding assay
Frozen sections from each case were dried, followed by two consecutive incubations in HEPES-based buffer (50 mM HEPES, 100 mM NaCl, 3 mM MgCl2, 0.2 mM EGTA and 1% BSA, pH 7.4) for 30 min at 30°C to remove endogenous ligands. Briefly, sections were incubated for 2 h at 30°C in the same buffer supplemented with 2 mM GDP, 1 mM DTT (Sigma, St. Louis, MO, USA) and 0.04 nM [35S] GTPγS (initial specific activity 1250 Ci/mmol, Perkin Elmer, Boston, MA, USA). Basal binding was determined in two consecutive sections in the absence of the agonist. Agonist-stimulated binding using the same reaction buffer was determined in a consecutive cut section in the presence of the corresponding receptor agonists, WIN55,212-2 (10 μM) for CB1 receptors, carbachol (100 μM) for M2/M4 receptors and CYM-5442 (10 μM) for S1P1 receptors (Sigma-Aldrich, St. Louis, MO, USA). Non-specific binding was defined by competition with GTPγS (10 μM) in a consecutively cut section. Sections were then washed twice in cold (4°C) 50 mM HEPES buffer (pH 7.4), dried and exposed to β-radiation sensitive film (Kodak Biomax MR, Sigma. St. Louis, MO, USA) together with a set of [14C] standards calibrated for 35 S [17].
Statistical analysis
The Kruskal-Wallis test was used to assess between-group comparisons on demographic, cognitive, lipidomic variables and autoradiographic data for NCI, MCI, and AD cases. The Dunn’s test was used to identify statistically significant groupwise comparisons. Since a formal adjustment for multiple comparisons was not applied to the lipidomic variables, we used a nominal significance level of alpha = 0.01 to balance a Type I error rate with the need to identify associations with possible biological relevance. The total number of lipids analyzed in each area of the FC in both positive and negative ionization mode were: WM positive, n= 393; WM negative, n= 69; GM positive, n= 588; GM negative, n= 169. The five lipids that exhibited changes in FC WM in the NCI subjects, were compared to the values obtained from the YAC cases using a Mann-Whitney test with a significance level set at p = 0.05. Analysis comparing areas with lipid accumulation versus those without accumulation in all RROS cases was performed using a Mann-Whitney test with a nominal significance level of alpha = 0.01. This analysis revealed a reduced number of significantly different lipids (see Supplementary Figure 1). We conducted groupwise comparisons across clinical groups using a Kruskal-Wallis test followed by Dun’s test, with the p-value set at 0.05. Spearman correlation significance was set to 0.01 to account for multiple comparisons, while still allowing for an adequate number of associations to be deemed significant. Statistical analysis was conducted using R 4.2.3. Data was graphically represented using GraphPad Prism 9 (GraphPad Software, San Diego, CA, USA).
RESULTS
Subject characteristics
The demographic, clinical, and neuropathological characteristics of the 15 RROS participants were summarized in Table 1. There were no significant differences in age, sex, years of education, postmortem interval (PMI), brain weight, semantic memory, working memory, visuospatial speed z-score, or possession of at least one apolipoprotein (APOE) ɛ4 allele across cases. MMSE scores were significantly lower in the AD compared to the NCI and MCI groups. Global cognition, episodic memory and perceptual speed score were lower in AD compared to NCI. The YAC subjects were significantly younger than the RROS NCI cases (68.83±7.9 versus 86.27±4.8 years, respectively; Mann-Whitney test; p = 0.004). Although a similar clinical evaluation was not available for the YAC cases, a review of their medical records did not reveal evidence of cognitive difficulties or neurological disease. Moreover, all YAC cases had a postmortem neuropathological Braak score of 0, while the NCI cases displayed an average Braak score of 3.2±0.8 (see Table 1). A Braak score of 0 has been used to select control cases for analysis in clinical pathological studies [67].
Frontal cortex MALDI-MSI analysis in NCI, MCI, and AD
We conducted MALDI-MSI analysis on frozen FC tissue obtained from elderly participants of the RROS that died with a clinical diagnosis of NCI, MCI, and AD and YAC cases with no cognitive impairment from the University of the Basque Country to identify phospholipids and sphingolipids by measuring the charged lipids in both positive and negative ions. Significant lipid changes were found only in the WM between clinical groups. The relative intensity levels of diacylglycerol (DG) 36:2 (Fig. 1E-H, Fig. 2A, p < 0.05), DG 38:5 (Fig. 1I-L, Fig. 2B, p < 0.05), and phosphatidic acid (PA) 40:6 (Fig. 1M-P, Fig. 2C, p < 0.05) were significantly higher in MCI compared to elderly NCI cases, while PI 38:5 (Fig. 1Q-T, Fig. 2D, p < 0.05) and PI 38:4 (Fig. 1U-X, Fig. 2E, p < 0.01) were lower in AD compared to NCI subjects. DG 36:2, DG 38:5, and PA 40:6 intensities were greater in WM compared to GM (Fig. 1E-P), while PI 38:5 and PI 38:4, were more intense in GM than WM (Fig. 1Q-X) in all experimental groups.

Histograms showing MALDI-MSI lipid intensity in frontal cortex WM for YAC, NCI, MCI, and AD cases. A-E) Significant differences of lipids, obtained by the average of absolute intensities in arbitrary units (A.U.) of WM between NCI, MCI, and AD were shown in panels, while (F-J) significant differences between YAC and NCI were shown in panels. **p < 0.01, *p < 0.05. DG, diacylglycerol; PA, phosphatidic acid; PI, phosphatidylinositol.
In addition, we also assessed the effect of differences in age between the NCI and YAC cases had upon FC lipid intensity. Here we found lower intensity levels of DG 36:2 (Fig. 1E-F, Fig. 2F, p < 0.01), DG 38:5 (Fig. 1I-J, Fig. 2G, p < 0.01), PA 40:6 (Fig. 1M-N, Fig. 2H, p < 0.01), PI 38:5 (Fig. 1Q-R, Fig. 2I, p < 0.05), and PI 38:4 (Fig. 1U-V, Fig. 2J, p < 0.05) in YAC compared to NCI subjects.
Frontal cortex lipid accumulations in GM in NCI, MCI, and AD
There was no difference in lipid composition in the GM across the groups. However, MALDI image analysis revealed discrete lipid patches in the supragranular layers of the GM (Supplementary Figure 1), which displayed increased lipid intensity (%) for PC (PC 30:0, PC 32:0, PC 34:0, PC 32:1, PC 36:4, and PC 38:4); DG (DG 30:0, DG 32:0, PC 34:0, DG 32:1, DG 34:3, DG 36:3, and DG 38:4); PA (PA 36:5, PA 36:4, PA 40:5, and PA 34:4); SM (SM 36:1 and SM 38:1); ceramides (CER 36:1); and PE (PE 40:7 and PE 44:12); and a downregulation of PA 36:2 and SM 42:2 compared to areas lacking patches across all clinical groups (Supplementary Figure 1). Conversely, only three lipids were increased between clinical groups. Specifically, PC 32:1 (Fig. 3A-C, J, p < 0.05) and SM 38:1 (Fig. 3G-I, L, p < 0.05) showed greater intensity in AD compared to NCI, while PC 34:0 (Fig. 3D-F, K, p < 0.05) exhibited a significant elevation in MCI compared to NCI.
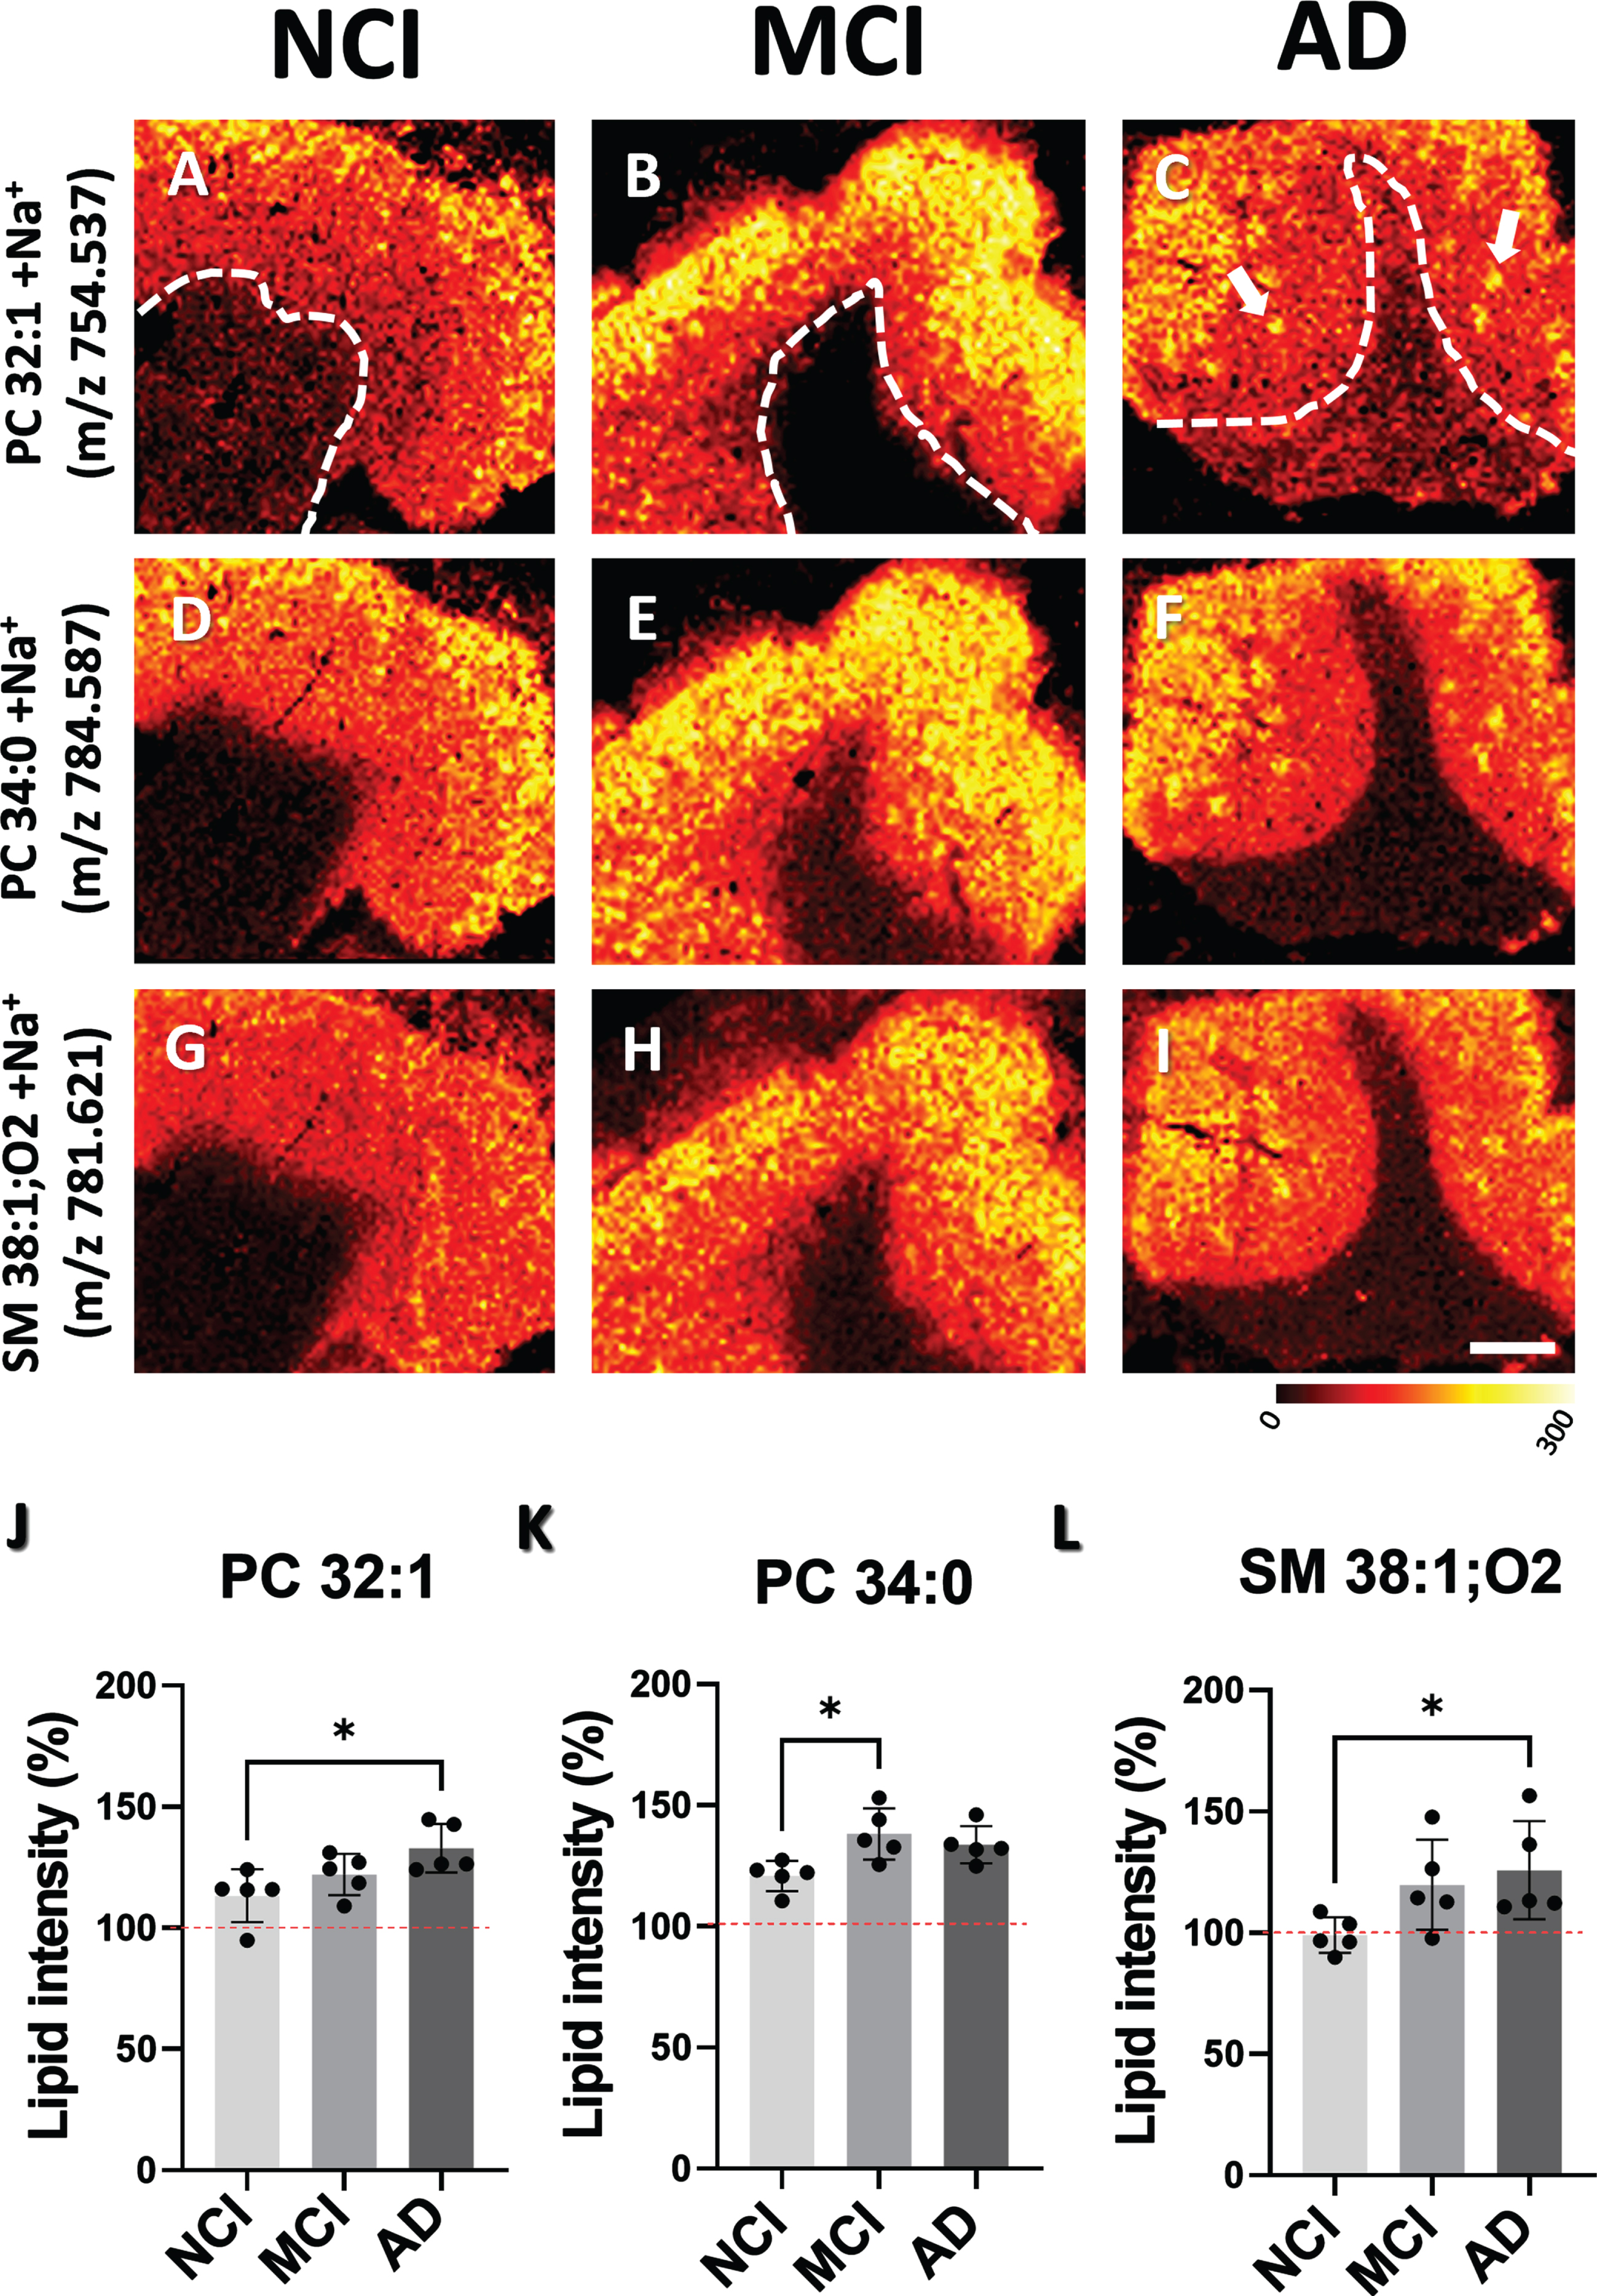
MALDI-MSI ion distribution images and histograms showing differences in the intensities of lipid patches in GM between NCI, MCI, and AD cases. A-C) GM images, above dashed line, show the distribution of PC 32:1, (D-F) SM 38:1 and (G-I) PC 34:0. J-L) Histograms display percentage of changes in lipid intensity across NCI, MCI, and AD cases. Percent change in lipid intensity was determined by comparing areas within the GM with no accumulation (100%) to those with lipid accumulations. Red dashed line indicates background level. Scale bar in panel I = 4 mm. Multicolored scale bar below panel I indicates changes in intensity level. PC, phosphatidylcholine; SM, sphingomyelin.
Frontal cortex functional autoradiography of activated Gαi/o proteins by the [35S]GTPγS binding assay in NCI, MCI, and AD cases
Functional coupling induced by carbachol for M2/M4-mediated receptor activity, was decreased in the FC GM in AD, specifically in layer V-VI compared to MCI. Additionally, [35S]GTPγS binding induced by WIN55,212-2, primarily mediated by CB1 activity, was increased in FC layer V-VI in AD compared to NCI. Lastly, functional coupling of S1P1 receptors to Gi/o proteins, induced by the specific agonist CYM5442, was reduced in FC WM in AD compared to NCI (Fig. 4 and Table 2).
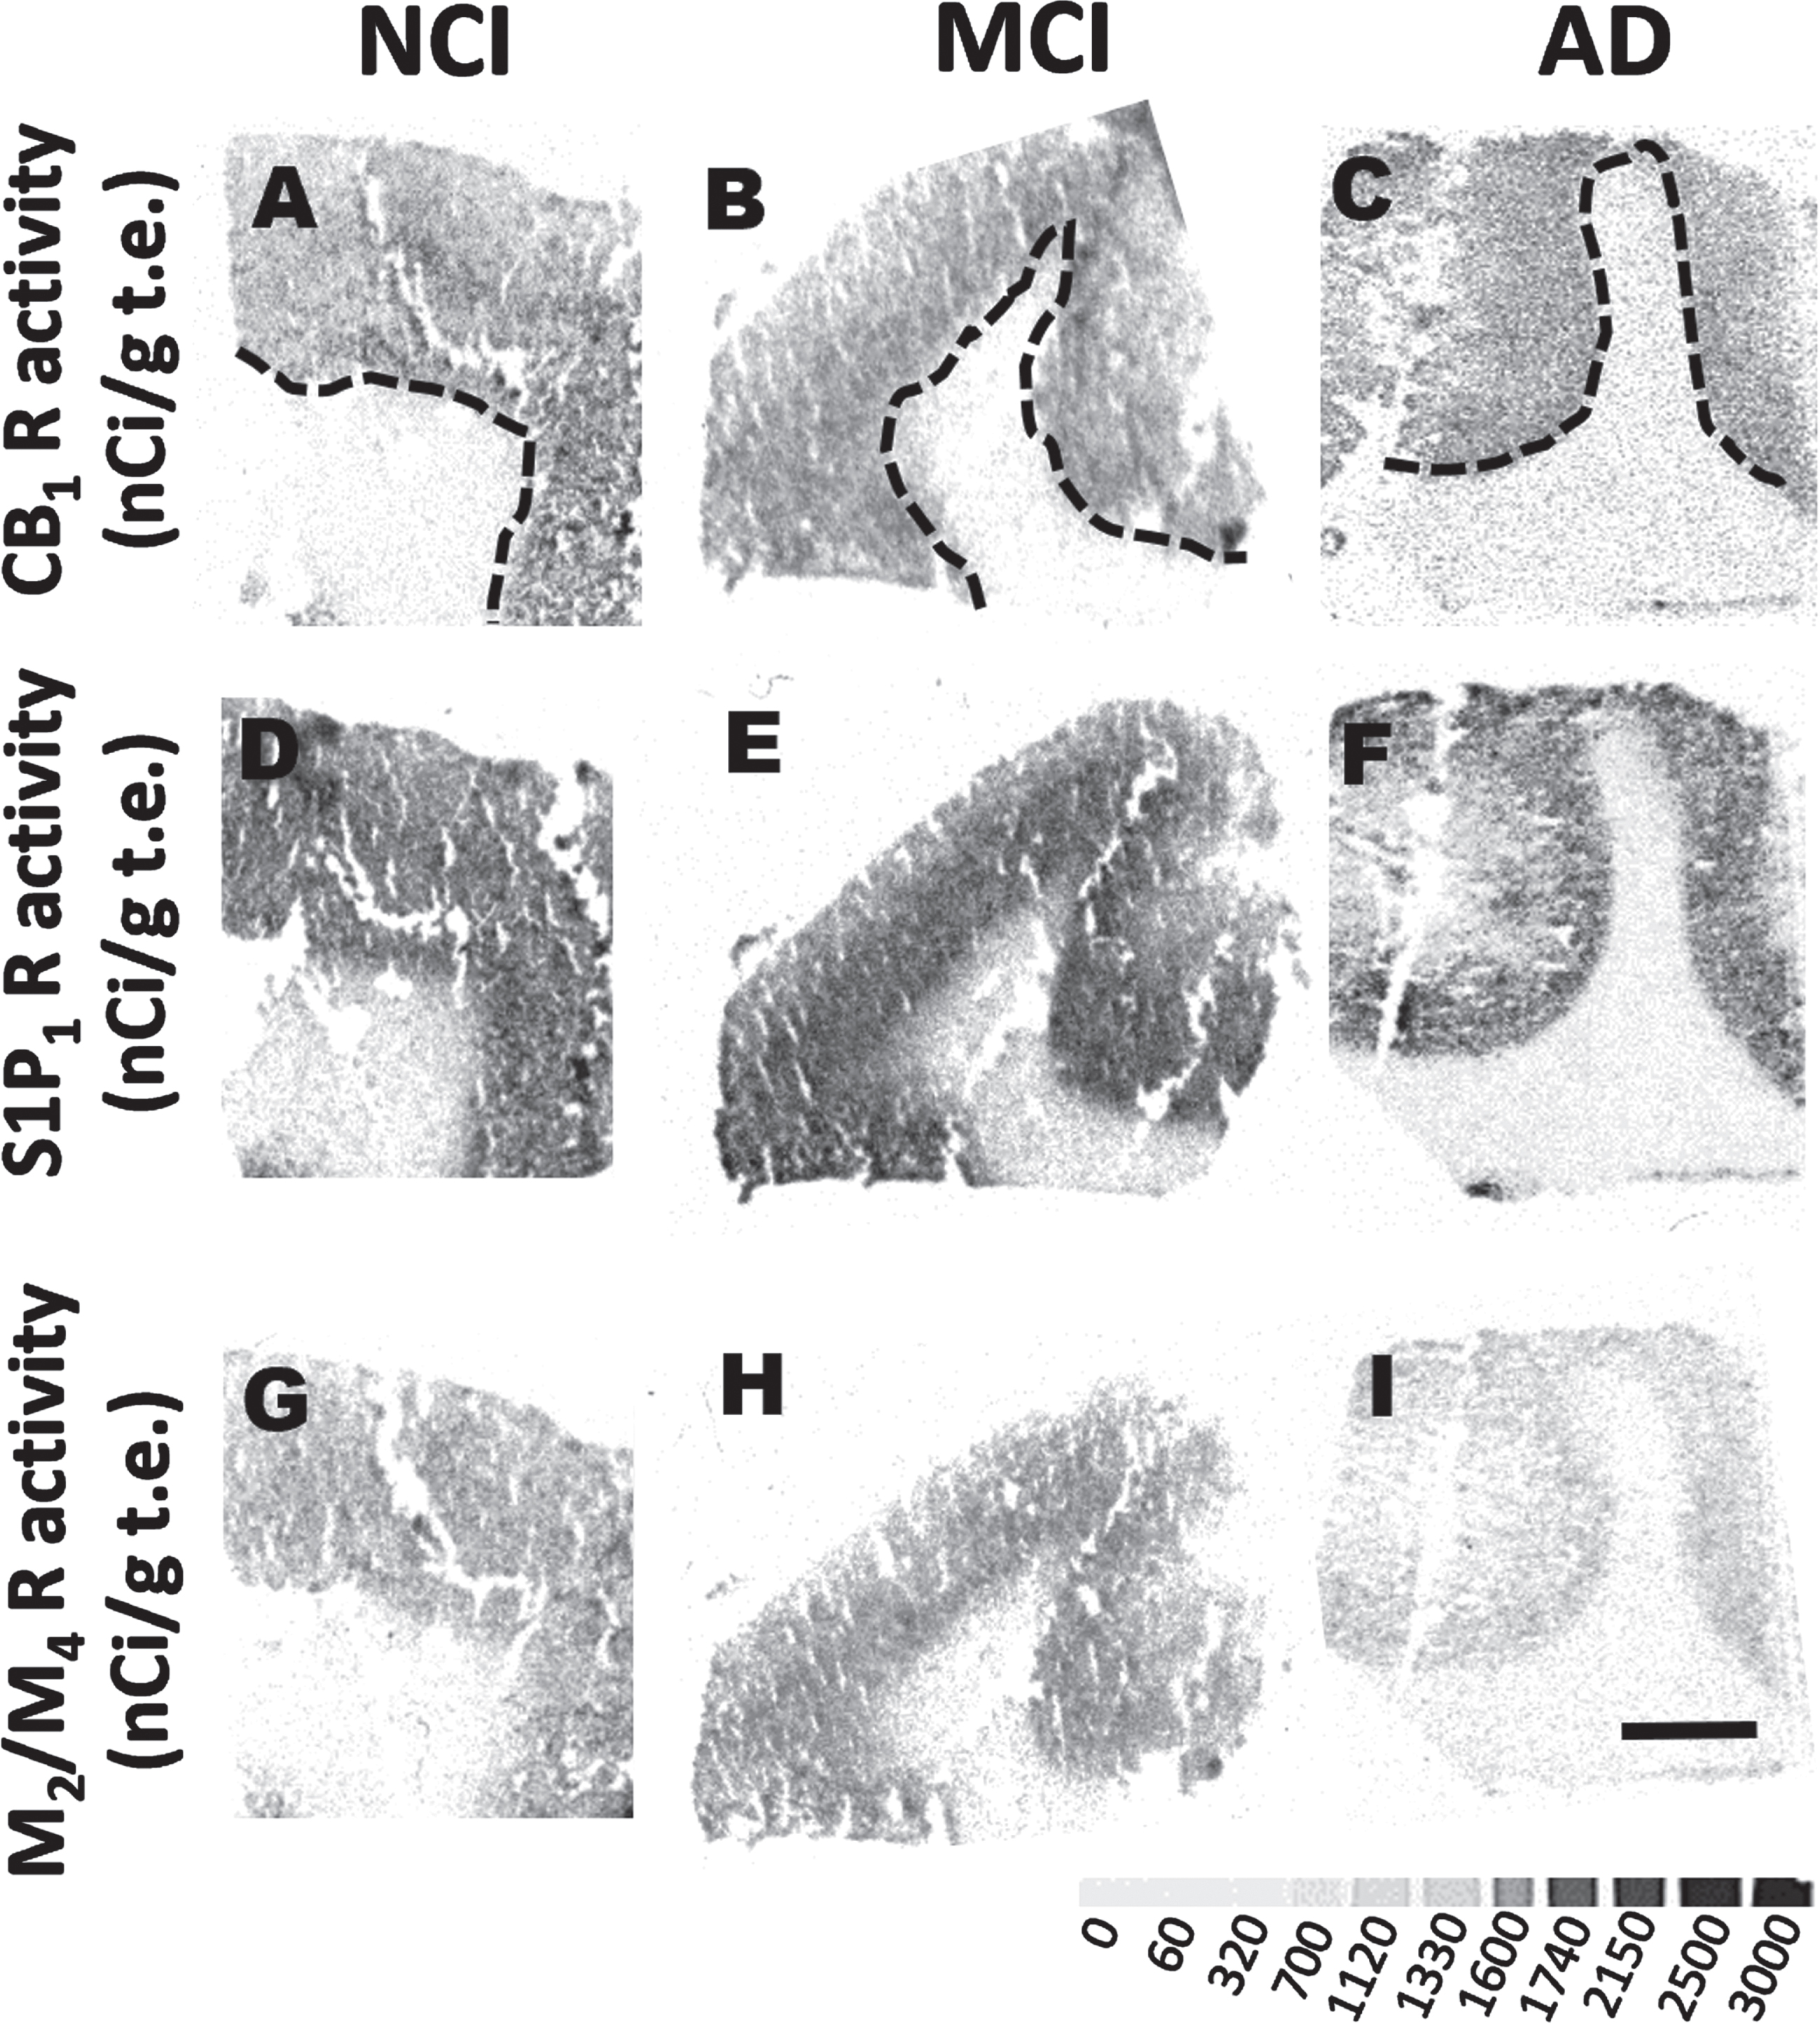
Functional autoradiographic images of lipid related receptors. Representative autoradiographic images of frontal cortex activity for CB1R (A-D), S1P1R (E-J), and M2/M4 activity stimulated by WIN55,212-2, CYM-5442 and carbachol (K-L) showing differences in GTPγS binding in GM and WM in NCI, MCI and AD cases. Dashed line differentiates GM from WM. Scale bar in I = 4 mm. Grayscale bar below panel I indicates levels of GTPγS binding (nCi/g t.e.).
[35S]GTPγS binding induced by WIN55,212-2 (10 μM), CYM-5442 (10 μM) and Carbachol (100 μM) in frontal cortex lamina and white matter of NCI, MCI and AD expressed in nCi/g t.e
Data is presented as the mean±SEM, *p < 0.05 AD versus NCI,
Associations between lipids, receptor activity and demographic variables
A significant positive correlation was observed between PI 38:5 and perceptual speed (Fig. 5A, r= 0.66, p = 0.009), while PE 42 : 9 (Fig. 5C, r= –0.75, p = 0.002) and PE 42 : 10 (Fig. 5C, r= –0.7, p = 0.004) GM intensity levels negatively correlated with perceptual speed z-score values across clinical groups. PE 42 : 9 in GM correlated negatively with MMSE scores (Fig. 4E, r= –0.89, p < 0.0001). In addition, we found a positive correlation between the lipid intensity of the discrete oval accumulations of PC 32:1 and CB1 stimulation in GM layers V-VI (Fig. 5H, r= 0.83, p = 0.0002). A negative correlation was found between PC 32 : 1 and perceptual speed across clinical groups (Fig. 5B, r= –0.62, p = 0.016). A negative correlation was found between SM 38 : 1 (Fig. 5F, r= –0.74, p = 0.002) and MMSE across groups.
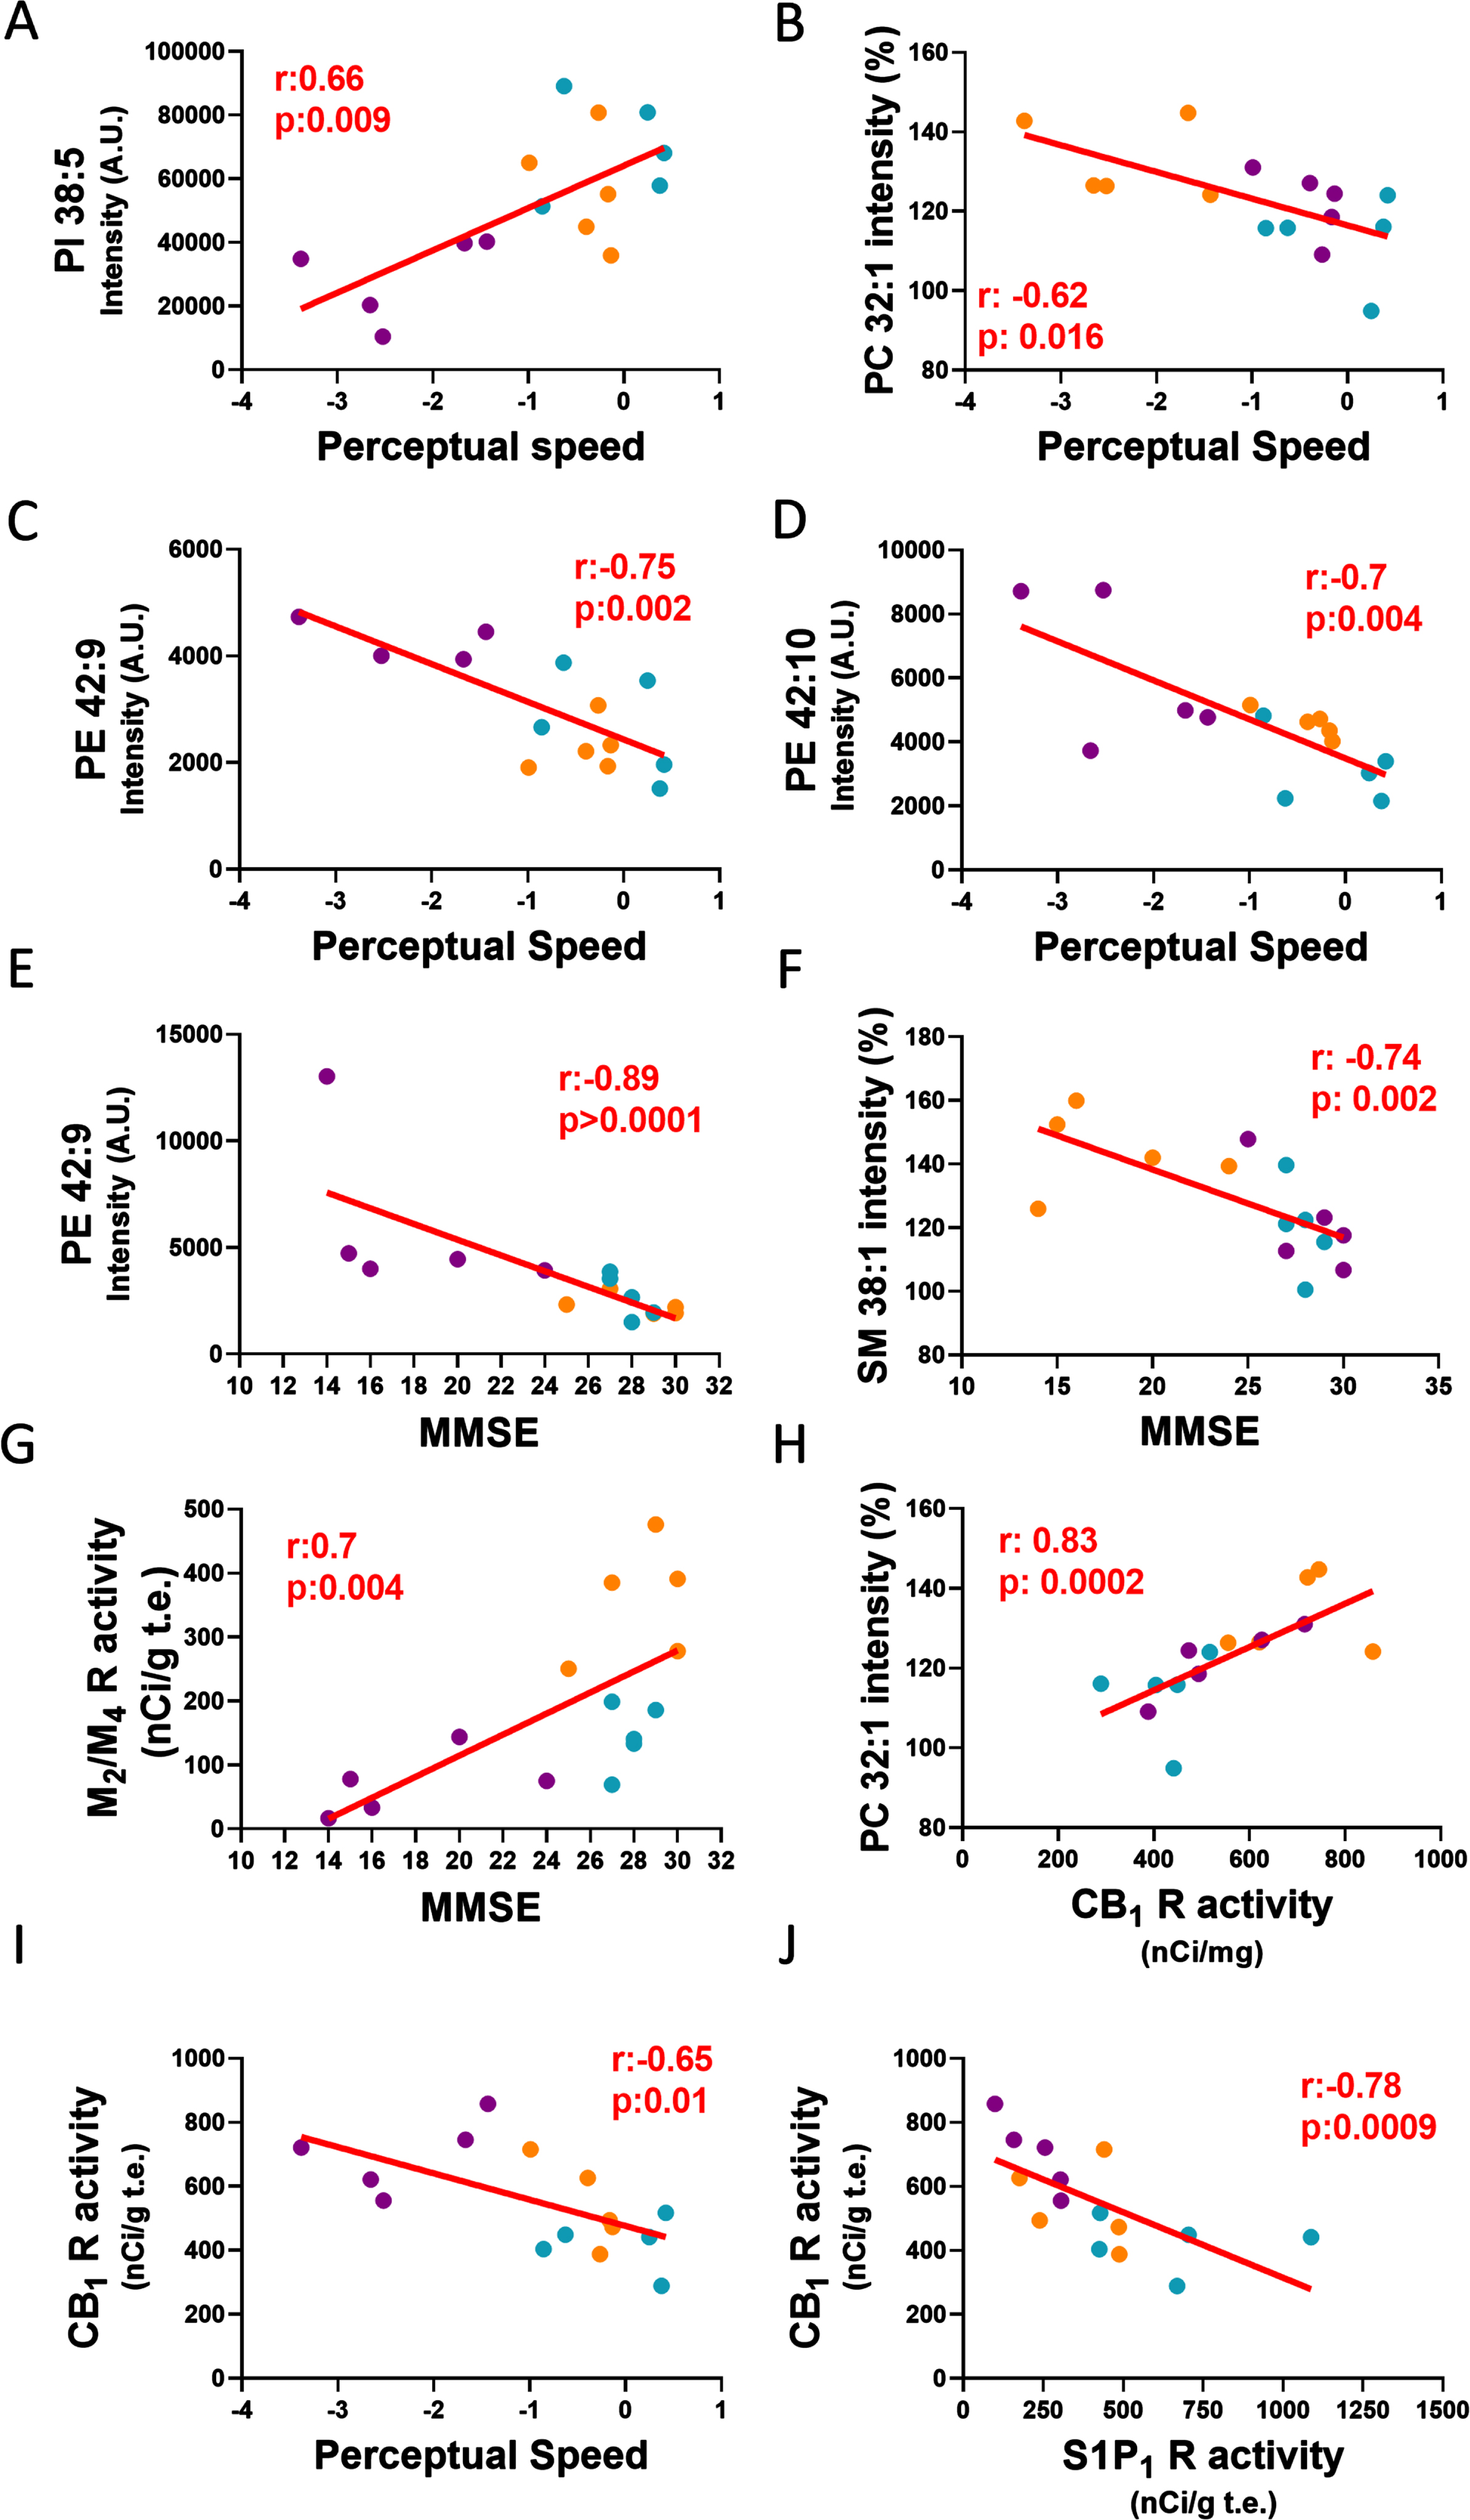
Linear regression graphs show associations between lipids intensities, receptor activity and cognitive performance tests. A) Associations between perceptual speed and PI 38:5 intensity A.U., B) PC 32:1 intensity (%), C) PE 42:9 intensity A.U. D) PE 42:10 intensity A.U. E) MMSE and PE 42:9 intensity A.U., F) SM 38:1 intensity (%), G) M2/M4 receptor activity. H) CB1 receptor activity in GM layers V-VI and PC 32:1 intensity (%), I) perceptual speed, and J) S1P1 receptor activity in WM. Blue dots correspond to NCI, orange dots to MCI and purple dots to AD. PI, phosphatidylinositol; PE, phosphatidylethanolamine; PC, phosphatidylcholine; SM, sphingomyelin.
DISCUSSION
While multiple studies have demonstrated lipid alterations in the AD brain, the involvement of neurolipids together with their lipid precursors remain under-investigated during the progression of AD [68]. Here we showed significant lipid alterations in the WM in MCI, suggesting an early role in the onset of AD. Specifically, we found an increase in PA 40:6 and DG 36:2 and DG 38:5 in MCI compared to NCI, and a decrease of PI 38:5 and PI 38:4 in AD compared to NCI. The intensity of DGs and PA were higher in the WM compared to GM. Regarding the metabolic origins of DG and PA, phospholipid degradation emerges as a significant lipidomic pathway. PA and DG are important membrane lipids and second messengers that contribute to cellular processes either by their biophysical effect directly on the cell membrane or by recruiting proteins to the membrane [69]. The main pathway that regulates the formation and levels of these lipids is the phosphorylation of PI and activation of phospholipase C to generate DG, which remains associated with the plasma membrane and generates PA [70]. Although numerous studies have documented the elevation of DGs in MCI [9, 72], we found an increase within the WM in this prodromal stage suggesting that DGs are early indicators of WM damage. However, the precise mechanism(s) underlying the heightened levels of DG in the FC WM in MCI require further investigation. Additionally, we demonstrated decreased activity of M2/M4 receptors, stimulated by carbachol, in layers V-VI in AD compared to MCI. Previous studies have shown a reduction in the density of total muscarinic receptors in cortical areas in AD [73]. In particular, pre-synaptic M2 receptor density and G-protein coupling of this receptor was decreased in AD cortex [74, 75], supporting the current reduction of cortical muscarinic receptor activity in AD. In contrast, we found a non-significant trend for an increase in M2/M4 activity in MCI compared to NCI. Interestingly, muscarinic receptors are known to mediate lipid signaling via the neurotransmitter ACh, which activates phospholipases to generate DG in synaptosomes both in in vivo and in vitro [76–78]. However, lipid signaling can be initiated through diverse pathways and receptors including cholinergic and non-cholinergic receptors [27–29] that modify phospholipases resulting in a localized accumulation of PA and DG. Accumulations of these lipid have been reported to modify the recruitment of these proteins and fission processes related to WM membrane stability, which is detrimental to the maintenance of axonal connectivity [79, 80], results in a negative curvature to membrane bilayers due to their conical shape [81]. Perhaps increased levels of DG and PA are early indicators of WM dysfunction that, in part, underlie the cognitive deficits seen in prodromal AD.
Whether lipid modifications are associated with the onset of deficits in cognitive performance in AD is an under investigated area. In this regard, we found a downregulation of WM PI 38:5/38:4, which corresponds to arachidonic acid-enriched phosphatidylinositol (PI-AAs) (PI 18:0_20:4 and PI 18:1_20:4) [62, 63] in AD compared to NCI that correlated with impaired perceptual speed performance across groups. Evaluation of PI (18: 0_20:4) images revealed more intense labeling in GM than WM. It has been reported that PIP2 (18:0_20:4), resulting from the degradation of the PI-AA (18:0_20:4), was greater in WM myelin-enriched fractions [82] supporting the suggestion that alterations in phosphoinositide’s and their respective regulatory pathways, play a role in WM and axon signaling dysfunction [83]. Another crucial regulatory pathway for PI (18:0_20:4) involves phospholipase A2 (PLA2), which maintains a balance between the conversion of AA into proinflammatory mediators and reincorporation into PI-AA [84, 85]. AA, a key mediator of neuroinflammation, is elevated in AD and predominantly accumulates in the outer membrane of neurons and the myelin sheath [86] suggesting that the integrity of myelinated axons is compromised early in AD. Damage to the WM, which is comprised of 80% lipids, may disrupt neural transmission resulting in sensory, motor, and cognitive impairments [86]. These findings are consistent with studies demonstrating disruption of WM in prodromal AD [87, 88]. We observed that the WM displayed a reduction of S1P1 receptor activity, while CB1 receptor activity within the infragranular layers of the GM which also contains heavily myelinated fibers [89, 90] are increased in AD compared to NCI. An imbalance between CB1 and S1P1 has been suggested to play a role in the maintenance of myelin integrity in AD [91, 92]. In this regard, alterations in the activity of these receptors may be attributed to changes in their endogenous agonists. For example, levels of the S1P1 receptor agonist sphingosine 1 phosphate (S1P) are decreased in cortical GM and WM in early and advanced AD [93, 94], while signaling for the 2-arachidonoylglycerol (2-AG) an endocannabinoid endogenous CB1 receptor agonist increases in response to Aβ plaques [95]. Both, CB1 and S1P1 receptor activity negatively correlated, while the temporal relationship or signaling crosstalk between these receptors remain unknown [96]. However, activation of CB1 receptors drives the breakdown of sphingomyelin into ceramide, followed by its conversion to sphingosine. Subsequently, sphingosine is phosphorylated by sphingosine kinases to generate S1P, which binds to S1P1 receptors [97, 98] suggesting that CB1 receptors activate S1P1 pathways in response to WM dysfunction.
Here, we also demonstrated that PA 40:6, DG 36:2, DG 38:5, and PI-AAs, which play a key role in WM myelination and maintenance, were significatively increased in older NCI compared to younger YAC subjects. Since myelinated axons in WM deteriorate structurally and functionally with age and are associated with poorer cognitive ability [99–102], an increase in PA 40:6, DG 36:2, DG 38:5, and PI-AA in NCI, suggests that normal physiological aging affects axonal and myelin lipids metabolism in the FC [103]. Although, we do not rule out the possibility that differences in ethnicity and lifestyle (i.e., diet and exercise) between YAC and NCI may influence the observed lipid changes with age in the WM [104], further investigation is needed to evaluate these lipid changes.
In the supragranular layers of the FC, patches of lipid displayed a significant increase in the intensity of PC 32:1, PC 34:0 and SM 38:1. Interestingly, PC 34:0 containing aggregates were seen in MCI, while both SM 38:1 and PC 32:1 were increased in AD. However, only the latter two lipids correlated with cognitive decline in AD. Each of these lipids are found in activated microglia [105], gliomas [106] and Aβ plaques in human and animal models of AD [14, 107–110]. Perhaps the upregulation of PC 32:1, PC 34:0, and SM 38:1 plays a key role in the pathogenesis of AD.
It is important to discuss limitations associated with the current study. For example, the small number of cases warrant a conservative interpretation of the findings requiring validation in a larger cohort, which would allow for correlations with APOE genotypes, a major risk factor for the onset of AD and its neuropathologic lesions. It should be noted that the RROS participants were from a community-based population of highly educated retired clergy who had excellent health care and nutrition and were used in multiple clinical pathological [111, 112] and epidemiological investigations [41] of AD. However, other findings reported using tissue from the RROS cohort have not been found to be different from those derived from non-clerical populations [113, 114]. Individuals that volunteer may introduce bias by decreasing pathology, but this is partially overcome by the RROS high follow-up and autopsy rates [115]. Another caveat is that the YAC cases lacked a detailed pre-clinical evaluation. However, there was no evidence of impairment in cognition or adverse neurological disease documented in their medical records. YAC cases were neuropathologically classified as Braak stage 0, indicative of no cognitive impairment [56]. The possibility exists that differences in ethnicity and lifestyle (i.e., diet and exercise) may have influenced the observed difference in lipid values found between the YAC and NCI cases in the WM [103]. The influence that these cultural variables have upon lipid expression requires further investigation.”
Strengths of this study include uniform premortem clinical and postmortem pathological evaluation and that final pathologic classification was performed without knowledge of the clinical evaluation for the RROS cases.
In summary, the present findings provide evidence that lipidomic dysfunction is associated with the cognitive impairment in the prodromal phase of AD. The current findings indicate that modifications in WM myelin-related lipids and cholinergic receptors play a pivotal role in the onset of AD dementia and potentially serve as novel drug targets.
AUTHOR CONTRIBUTIONS
Elliott Jay Mufson (Conceptualization; Data curation; Funding acquisition; Project administration; Resources; Software; Writing – original draft; Writing – review & editing); Marta Moreno-Rodriguez (Conceptualization; Data curation; Formal analysis; Investigation; Methodology; Resources; Writing – original draft); Sylvia E. Perez (Data curation; Investigation; Writing – review & editing); Jonatan Martinez-Gardeazabal (Data curation; Methodology; Validation); Ivan Manuel (Data curation; Methodology); Michael Malek-Ahmadi (Data curation; Formal analysis); Rafael Rodriguez-Puertas (Funding acquisition; Methodology; Resources; Writing – review & editing).
Footnotes
ACKNOWLEDGMENTS
We are indebted to the nuns, priests, and lay brothers who participated in the Rush Religious Orders Study and to the members of the Rush ADC. Technical and human support provided by University of the Basque Country (UPV/EHU), Ministry of Economy and Competitiveness (MINECO), Basque Government (GV/EJ), European Regional Development Fund (ERDF), and European Social Fund (ESF) and the collaboration of Ivan Fernandez is gratefully acknowledged. J.M.-G. is the recipient of “Margarita Salas” fellowship.
FUNDING
This study was supported by grants PO1AG014449, RO1AG043375, P30AG010161 and P30AG042146, RF1AG081286 from the National Institute on Aging, Barrow Neurological Institute and Arizona Alzheimer’s Consortium. This work also was supported by grants from the regional Basque Government IT1454-22 to the “Neurochemistry and Neurodegeneration” consolidated research group and by Instituto de Salud Carlos III through the project “PI20/00153” (co-funded by European Regional Development Fund “A way to make Europe”) and by BIOEF project BIO22/ALZ/010 funded by Eitb Maratoia. The Principado de Asturias Bio iBank (PT13/0010/0046) was financed jointly by Servicio de Salud del Principado de Asturias, Instituto de Salud Carlos III and Fundación Bancaria Cajastur and integrated in the Spanish National Biobanks Network.
CONFLICT OF INTEREST
Elliott Mufson is an Editorial Board Member of this journal but was not involved in the peer-review process of this article nor had access to any information regarding its peer-review.
All other authors have no conflict of interest to report.
DATA AVALILABILITY
The data supporting the findings of this study are available within the article and in the supplementary material.