
Abstract
Background:
The causal relationships of late-life body mass index (BMI) with Alzheimer’s disease (AD) remains debated.
Objective:
We aimed to assess the associations of dynamic BMI features (ΔBMIs) with cognitive trajectories, AD biomarkers, and incident AD risk.
Methods:
We analyzed an 8-year cohort of 542 non-demented individuals who were aged ≥65 years at baseline and had BMI measurements over the first 4 years. ΔBMIs were defined as changing extent (change ≤ or >5%), variability (standard deviation), and trajectories over the first 4 years measured using latent class trajectory modeling. Linear mixed-effect models were utilized to examine the influence of ΔBMIs on changing rates of AD pathology biomarkers, hippocampus volume, and cognitive functions. Cox proportional hazards models were used to test the associations with AD risk. Stratified analyzes were conducted by the baseline BMI group and age.
Results:
Over the 4-year period, compared to those with stable BMI, individuals who experienced BMI decreases demonstrated accelerated declined memory function (p = 0.006) and amyloid-β deposition (p = 0.034) while BMI increases were associated with accelerated hippocampal atrophy (p = 0.036). Three BMI dynamic features, including stable BMI, low BMI variability, and persistently high BMI, were associated with lower risk of incident AD (p < 0.005). The associations were validated over the 8-year period after excluding incident AD over the first 4 years. No stratified effects were revealed by the BMI group and age.
Conclusions:
High and stable BMI in late life could predict better cognitive trajectory and lower risk of AD.
INTRODUCTION
Mid-life high body mass index (BMI) has been identified as a risk factor for late-life Alzheimer’s disease (AD),1,2, 1,2 while this association remains conflicting in late-life population.3,4,5, 3,4,5 In previous longitudinal studies, shared limitations are the rough grouping of BMI status and assumed “one-off” BMI measurement as the surrogate for exposure levels over follow-up. This would lead to an elevated risk of bias due to incorrect estimation of accumulative exposures. In contrast, investigating BMI trajectories could offer deeper insights into depiction of high-risk populations and provide invaluable information for potential intervention targets. Prior studies have explored dynamic BMI features in older adults. Generally, BMI decrease is associated with an increased risk of incidence of AD.6,7,8,9, 6,7,8,9 These studies concluded that BMI decrease precedes AD since BMI decrease may be a causal factor or a prodromal symptom of AD. However, the evidence is still insufficient due to the inconsistent results. Some even suggested that only BMI increase was associated with AD risk.10,11, 10,11 Due to the extreme low levels of BMI carries a high AD risk, 12 whether that losses from higher BMI levels might be less harmful than losses from lower BMI levels is still unclear. Further, BMI decrease may be a clinical feature of the AD pathological process, 13 thus the inverse causal relationship should also be considered. 14 Crucially, long-term retrospective trajectories or variability of BMI start in people before AD onset have not been described among populations aged ≥65 years, apart from few studies with younger population explored higher BMI variability was associated with increased AD risk.15,16, 15,16 Based on these findings, we reasonably inferred that maintaining a stable higher BMI in late-life might lower the risk of incident AD. The relationship of this hypothetical association with initial BMI and various cognitive status is yet to be determined. Herein, to validate the hypothesis and tackle these issues, we for the first time utilized various definitions of late-life BMI dynamic features, including changing trends, variability, and a relative novel methodology, trajectory-based approach. 17 Using longitudinal data from the Alzheimer’s Disease Neuroimaging Initiative (ADNI), we conducted this multimodal study to assessed the role of these dynamic BMI features in predicting cognitive decline, changing rates of AD biomarkers, and incident risk of AD among non-demented older individuals.
METHODS
ADNI participants
Data were obtained from the ADNI database (http://adni.loni.usc.edu). The primary goal of ADNI is for early detection and tracking of AD using serial tools including magnetic resonance imaging (MRI), cerebrospinal fluid (CSF) markers, and neuropsychological assessments. Participants were volunteers aged 55–90 years and continuously recruited from multiple centers across North America. They were cognitively normal (CN), mild cognitive impairment (MCI), or mild AD dementia. 18 More information can be found at http://www.adniinfo.org. At study entry, each participant underwent a detailed medical history review, physical examination, and neuropsychological evaluation. Data on cognitive function and BMI were collected at 12-month intervals. 19 To serve the aim of the present study, we selected ADNI participant for our analyses if they simultaneously met the following criteria: (a) age ≥65 years; (b) non-demented individuals, according to the criteria of National Institute of Neurological and Communicative Disorders and Stroke and Alzheimer’s Disease and Related Disorders Association (NINCDS-ADRDA); 20 (c) BMI ranging from 19–50 kg/m 2 to minimize risk of bias from severe baseline diseases or artificial errors; (d) at least two measurements of cognition and BMI were available, including baseline and year 4. At baseline, a total of 628 participants were aged 65 years or older. We further excluded 18 diagnosed with AD at baseline, 58 lacking in 4-year follow-up data, and 10 with BMI outliers. Finally, 542 participants were included for the former analyses. The institutional review boards at each of the participating institutions approved it and all participants or authorized representatives wrote informed consents. 21
Measurements of dynamic BMI features (ΔBMI)
BMI was calculated by dividing weight in kilograms (kg) by squared height in meters (m 2 ) at baseline and follow-up. The baseline BMI is classified into two groups: normal (BMI < 25 kg/m 2 ) and overweight/obese (hereinafter referred to as “OB”, BMI≥25 kg/m 2 ) groups. 22
Dynamic features of late-life BMI were calculated based on BMI records over the first 4 years: (a) difference in BMI from baseline to year 4 (ΔBMI 4y - bl);23,24, 23,24 (b) difference between mean BMI over the 4 years and baseline BMI (ΔBMI mean - bl). 23 Given that 5% BMI change was defined as clinically significant in accordance with the Food and Drug Administration, 25 the changing extent of BMI was divided into stable (≤5% change), increase (>5% change), and decrease (>5% change) groups; (c) The standard deviation (SD) was used to quantify the within-individual BMI changes (ΔBMI SD) and quartiles were applied to serve analyses;23,26, 23,26 (d) BMI trajectories (ΔBMI trajectory) were determined using the latent class trajectory modeling (LTCM), a semi-parametric approach that ascertains groups sharing similar outcome trajectories over time (measured at baseline and years 1, 2, 3, and 4). 27 We evaluated the appropriate number of trajectories and trajectory shapes following the recommended procedures. 28 We selected an optimal model structure using the lowest Bayesian information criteria (BIC) value and satisfactory values from the model adequacy assessments. An average of these maximum posterior probability assignments above 70%, in all classes, is regarded as acceptable. These procedures indicated that a model with 3 trajectories was superior to other models (BIC = 12326). Due to this model yielded one trajectory with less than 5% of participants (n = 19), we excluded this trajectory and selected the other 2 trajectories (including the persistently high, and persistently low, Fig. 1B) for subsequent analyses.

A) Study Design Showing the Time Line of Analysis. The time line was used to investigate the association between dynamic BMI features over 4 years with AD biomarkers, cognitive trajectories and subsequent AD risk. B) BMI trajectories in first 4 years. Presented are the BMI trajectories over a 4-year period. C) BMI and Time to diagnosis AD. Compared to those who stayed free of dementia, those incident AD patients exhibited a lower and less stable BMI trajectory before AD diagnosis, particularly since the 4∼8 years before the diagnosis.
Assessments of general cognition and memory
The general cognitive function was evaluated using the Alzheimer Disease Assessment Scale-13 (ADAS-13), 29 which is a test battery assessing memory function, reasoning, language function, orientation and praxis. Memory evaluations included the ADNI-MEM and the Rey Auditory Verbal Learning Test (RAVLT). 29 The composite ADNI-MEM score was obtained from RAVLT, ADAS, Mini-Mental State Examination (MMSE), and logical memory. The RAVLT test included 1) the number of correct responses across the immediate recall of the five learning trials (immediate recall, RAVLT-Im) and 2) the score on the fifth learning trial minus the score on the long-delayed recall (forgetting, RAVLT-F). Higher scores were indicative of better cognitive performance across all neuropsychological tests except for ADAS-13 and RAVLT-F, where higher scores indicated poorer performance. The composite scores for ADNI-MEM have been validated previously. 29
Measurements of CSF AD biomarkers
The CSF procedural protocols in ADNI have been described previously. 30 In brief, an approximate 10 mL of CSF was collected via lumbar puncture and transported to the laboratory within a 2-h timeframe, with no more than two freeze-thaw cycles. The samples underwent centrifugation at 2000 g for 10 min, and the concentrations of amyloid-β 42 (Aβ42), total-tau (t-tau), and phosphorylated-tau (p-tau181) were quantified using the INNOBIA AlzBio3 immunoassay (Fujirebio, Belgium), which exhibited an intra-batch precision value of 10% (with respective ranges of 5.5–7.8%, 4.4–9.8%, and 5.1–8.8%). 31
MRI imaging of hippocampus
All participants underwent high-resolution MRI of the brain scan at study entry. 32 With FreeSurfer Version 5.1, morphometric analyses of brain structure were performed on 1 mm isotropic 3D T1 sequences without contrast injection. The original MPRAGE (T1-weighted) structural volumetric MRI files were downloaded from UCSF (https://ida.loni.usc.edu/pages/access/studyData.jsp). In the present study, we selected the hippocampus as our brain region-of-interest because of its strong association with AD. 33 Prior studies have described the acquisition of MRI. 34
Diagnosis of AD dementia
In accordance with the NINCDS/ADRDA criteria for probable AD, individuals presenting a MMSE score ranging from 20 to 26, as well as a Clinical Dementia Rating Scale score between 0.5 and 1.0, were diagnosed with AD. 20 Cognitive diagnosis was recorded at each annual follow-up visit. Progressors were defined according to changes in the latest follow-up diagnosis available in ADNI data, including NC to AD dementia and MCI to AD dementia. In the present study, 126 participants developed AD during the first 4-year follow-up period, with an additional 46 incident AD during the latter 4-year period.
Covariates
The covariates included in the basic models were baseline indicators, including age, sex (male = 0, female = 1), years of education, clinical diagnosis (CN = 0, MCI = 1), and APOE 4 carrier status (number of APOE 4 alleles: 0, 1, 2). Additionally, other potential covariates were ascertained through screening the medical history for acquired factors that could increase AD risk, including hypertension (yes or no), diabetes (yes or no), and current smoking status (yes or no). Intracranial volume (ICV) was additionally adjusted when hippocampus volume was considered as the dependent variable.
Statistical analyses
Population characteristics were compared among different ΔBMIs categories using Chi-square tests (for categorical variables) and one-way ANOVA (for continuous variables). First, linear mixed-effects (LME) models (with the “nlme” package in R software) were used to explore the relationships of ΔBMIs with changing rate of CSF biomarkers, hippocampal atrophy, and cognitive decline. LME models were chosen to handle unbalanced and censored data due to attrition during follow-up, as well as accommodate a continuous variable for time. 35 The LME models incorporated random intercepts and slopes nested within participants, with an unstructured covariance matrix for random effects. Regression diagnostics were conducted to indicate that all models met the necessary assumptions: model residuals appeared normally distributed and did not exhibit heteroscedasticity. For dependent variables with skewed distributions (Shapiro-Wilk >0.05), transformation was performed to approximate a normal distribution (using the “car” package in R software). Next, to further investigate the association between ΔBMIs and AD risk, we generated Kaplan-Meier survival curves and calculated the difference in curves using the log-rank test. Additionally, Cox proportional hazards regression models were employed to examine the independent effects utilizing the “survival” and “survminer” packages in R software. The models employed a time-dependent approach to estimate the hazard ratio (HR) along with its 95% confidence interval (CI).
Given that ΔBMIs were defined over the first 4 years to guarantee the sample size, analyses were conducted over the first 4 years and further over 8 years. All analyses were repeated after excluding those incident AD within the first 4 years to preclude the potential inverse causal effects. All analyses were performed using two models. Model 1 adjusted for age, sex, years of education, clinical diagnosis, and APOE 4 carrier status. Model 2 additionally adjusted for diabetes, hypertension, and current smoking status. Moreover, when hippocampal volume was considered as a dependent variable, ICV was also included as an additional adjustment in all models. Subgroup analyses were performed on baseline BMI categories (normal/ OB) and age (<75 /≥75). R version 4.2.3 and GraphPad Prism version 9.00 software were utilized to perform these statistical analyses and prepare figures. Two-tailed tests were performed with a significance level of 0.05.
RESULTS
Late-life BMI trajectory prior to AD diagnosis
During the 8-year follow-up, a total of 285 subjects were diagnosed with AD and 202 stayed free of dementia. We graphically depicted the BMI trend curves for these two groups to primarily investigate the dynamic features of BMI prior to the onset of AD. Compared to those who stayed free of dementia, those incident AD patients exhibited a lower and less stable BMI trajectory (t-test, p < 0.001, Fig. 1C) before AD diagnosis, particularly since the 4∼8 years before the diagnosis.
Population characteristics
Population characteristics were given according to categories of ΔBMIs at baseline (Table 1). The cohort had a mean age of 74.6 years (SD = 5.4), with 43% being female and 39.5% APOE 4 carrier. Group differences were observed for age, sex, education years, and diabetes (p < 0.05). As for the ΔBMI trajectory groups, group differences were also observed for baseline BMI (p < 0.001).
Population characteristics of participants according to late-life dynamic BMI features at baseline
aBMI change < 5% over 4 years; bBMI increase or decrease≥5% over 4 years; cBMI range: 31–32.5 kg/m2 over 4 years; dBMI range: 25–26 kg/m2 over 4 years; *Population characteristics were compared among late-life dynamic BMI features using1-way ANOVA (for continuous variables) and Chi-square (χ2) test (for categorical variables). APOE 4, apolipoprotein E ɛ4; BMI, body mass index; CN, cognitive normal; MCI, mild cognitive impairment.
Associations of late-life ΔBMI with cognitive decline
Over the 4-year period (Supplementary Table 1, Fig. 2), individuals who underwent significant decreases in BMI showcased a more rapid decline in memory compared to those whose BMI remained stable (RAVLT-Im, β=–0.305, p = 0.006, Fig. 2A; MEM, β=–0.032, p = 0.026, Fig. 2B; RAVLT-Im, β=–0.372, p = 0.035, Fig. 2C). These results remained robust even after eliminating participants diagnosed with AD within an 8-year period (Supplementary Tables 3 and 4). The significance was consistent across both subgroups (Supplementary Tables 5 and 6). However, no significant results were found in the relationship of increased BMI, BMI variability, or BMI trajectories with cognitive decline.
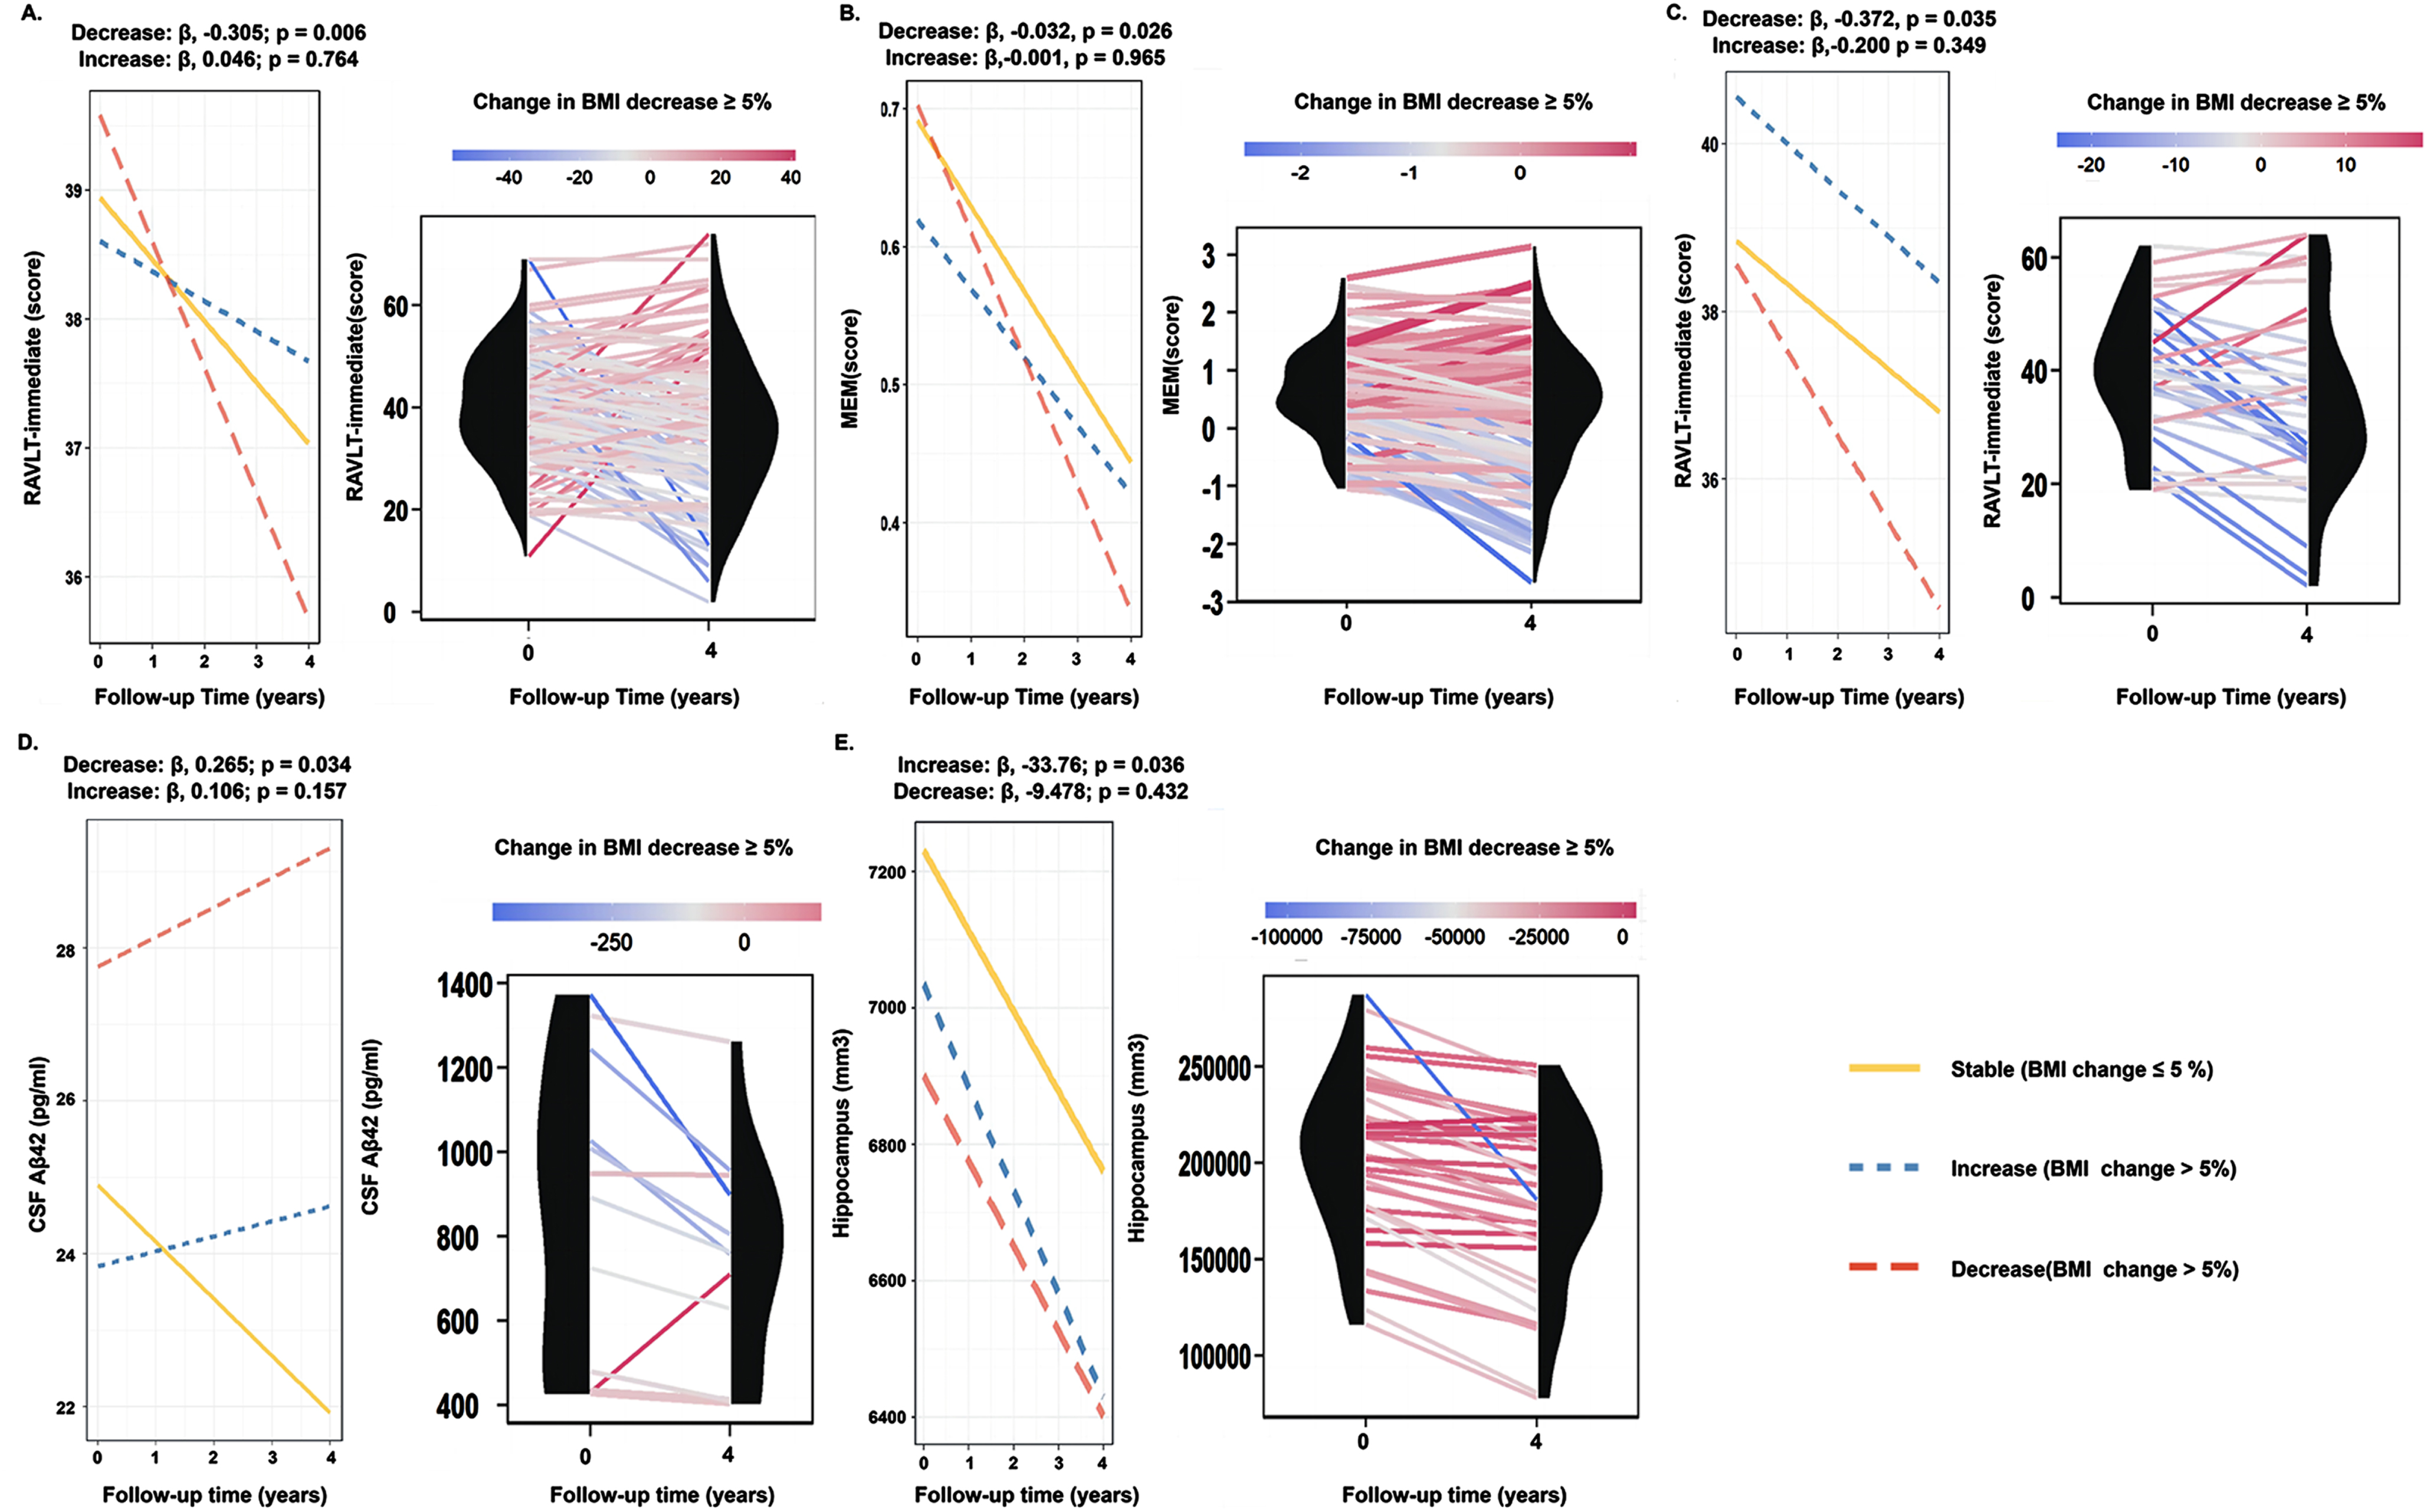
The associations of late-life ΔBMI with cognition and AD biomarkers in 4-year. In 4-year periods, compared to individuals with stable BMI, individuals who experienced a significant decrease in BMI exhibited accelerated rates of memory decline (A-C) and Aβ deposition (D), while individuals with increased BMI showed rapid hippocampal atrophy (E).
Associations of late-life ΔBMI with AD biomarkers trajectories
Over the 4-year period (Supplementary Table 1, Fig. 2), compared to individuals with stable BMI, individuals who experienced significant decreases in BMI exhibited accelerated rates of Aβ deposition (Aβ42, β= 0.265, p = 0.034, Fig. 2D) and while individuals with increased BMI exhibited accelerated hippocampal atrophy (β= –33.762, p = 0.036, Fig. 2E). These results were barely unchanged over the 8-year period (Supplementary Tables 2) and were consistent across all baseline BMI categories (Supplementary Tables 5 and 6). However, these noted associations disappeared after excluding AD participants within the initial 4 years (Supplementary Tables 3 and 4). No significant results were found in the relationship of increased BMI, BMI variability, or BMI trajectories with brain pathology.
Associations of late-life ΔBMI with incident AD risk
During the 4-year period (Table 2, Fig. 3), individuals who experienced notable changes (either increase or decrease) in BMI exhibited an elevated risk of incident AD compared to those with stable BMI (BMI increase group, HR = 1.86, 95% CI = 1.11 to 3.10, p = 0.018; BMI decrease group, HR = 1.92, 95% CI = 1.29 to 2.85, p = 0.001, Fig. 3A, Table 2). Moreover, we found higher variability of BMI was associated with increased risk of incident AD (HR = 2.83, 95% CI = 1.62 to 4.94, p < 0.001, Table 2, Fig. 3B). The above-mentioned findings were also validated over an 8-year period (Table 2, Fig. 3C, D). In addition, we also found that individuals with persistently low BMI (HR = 1.92, 95% CI = 1.16 to 3.18, p = 0.010, Fig. 3D) exhibited a higher risk of incident AD compared to those with persistently high BMI. Sensitivity analyses by excluding incident AD over the first 4 year (model 2 were shown in Supplementary Table 7) and stratified analysis by age did not change the primary results (Supplementary Tables 8 and 9).
Association between dynamic BMI features and incident AD risk in both 4-year and in 8-year periods
p value was computed by cox proportional hazards regression models, and the HR with its corresponding 95% CI was estimated. *Excluding AD participants in first 4 years. Covariates were adjusted for age, sex, years of education, APOE 4 status and clinical diagnosis (model 2 were shown in Supplementary Table 7). APOE 4, apolipoprotein E ɛ4; HR, hazard ratio; CI, confidence interval.
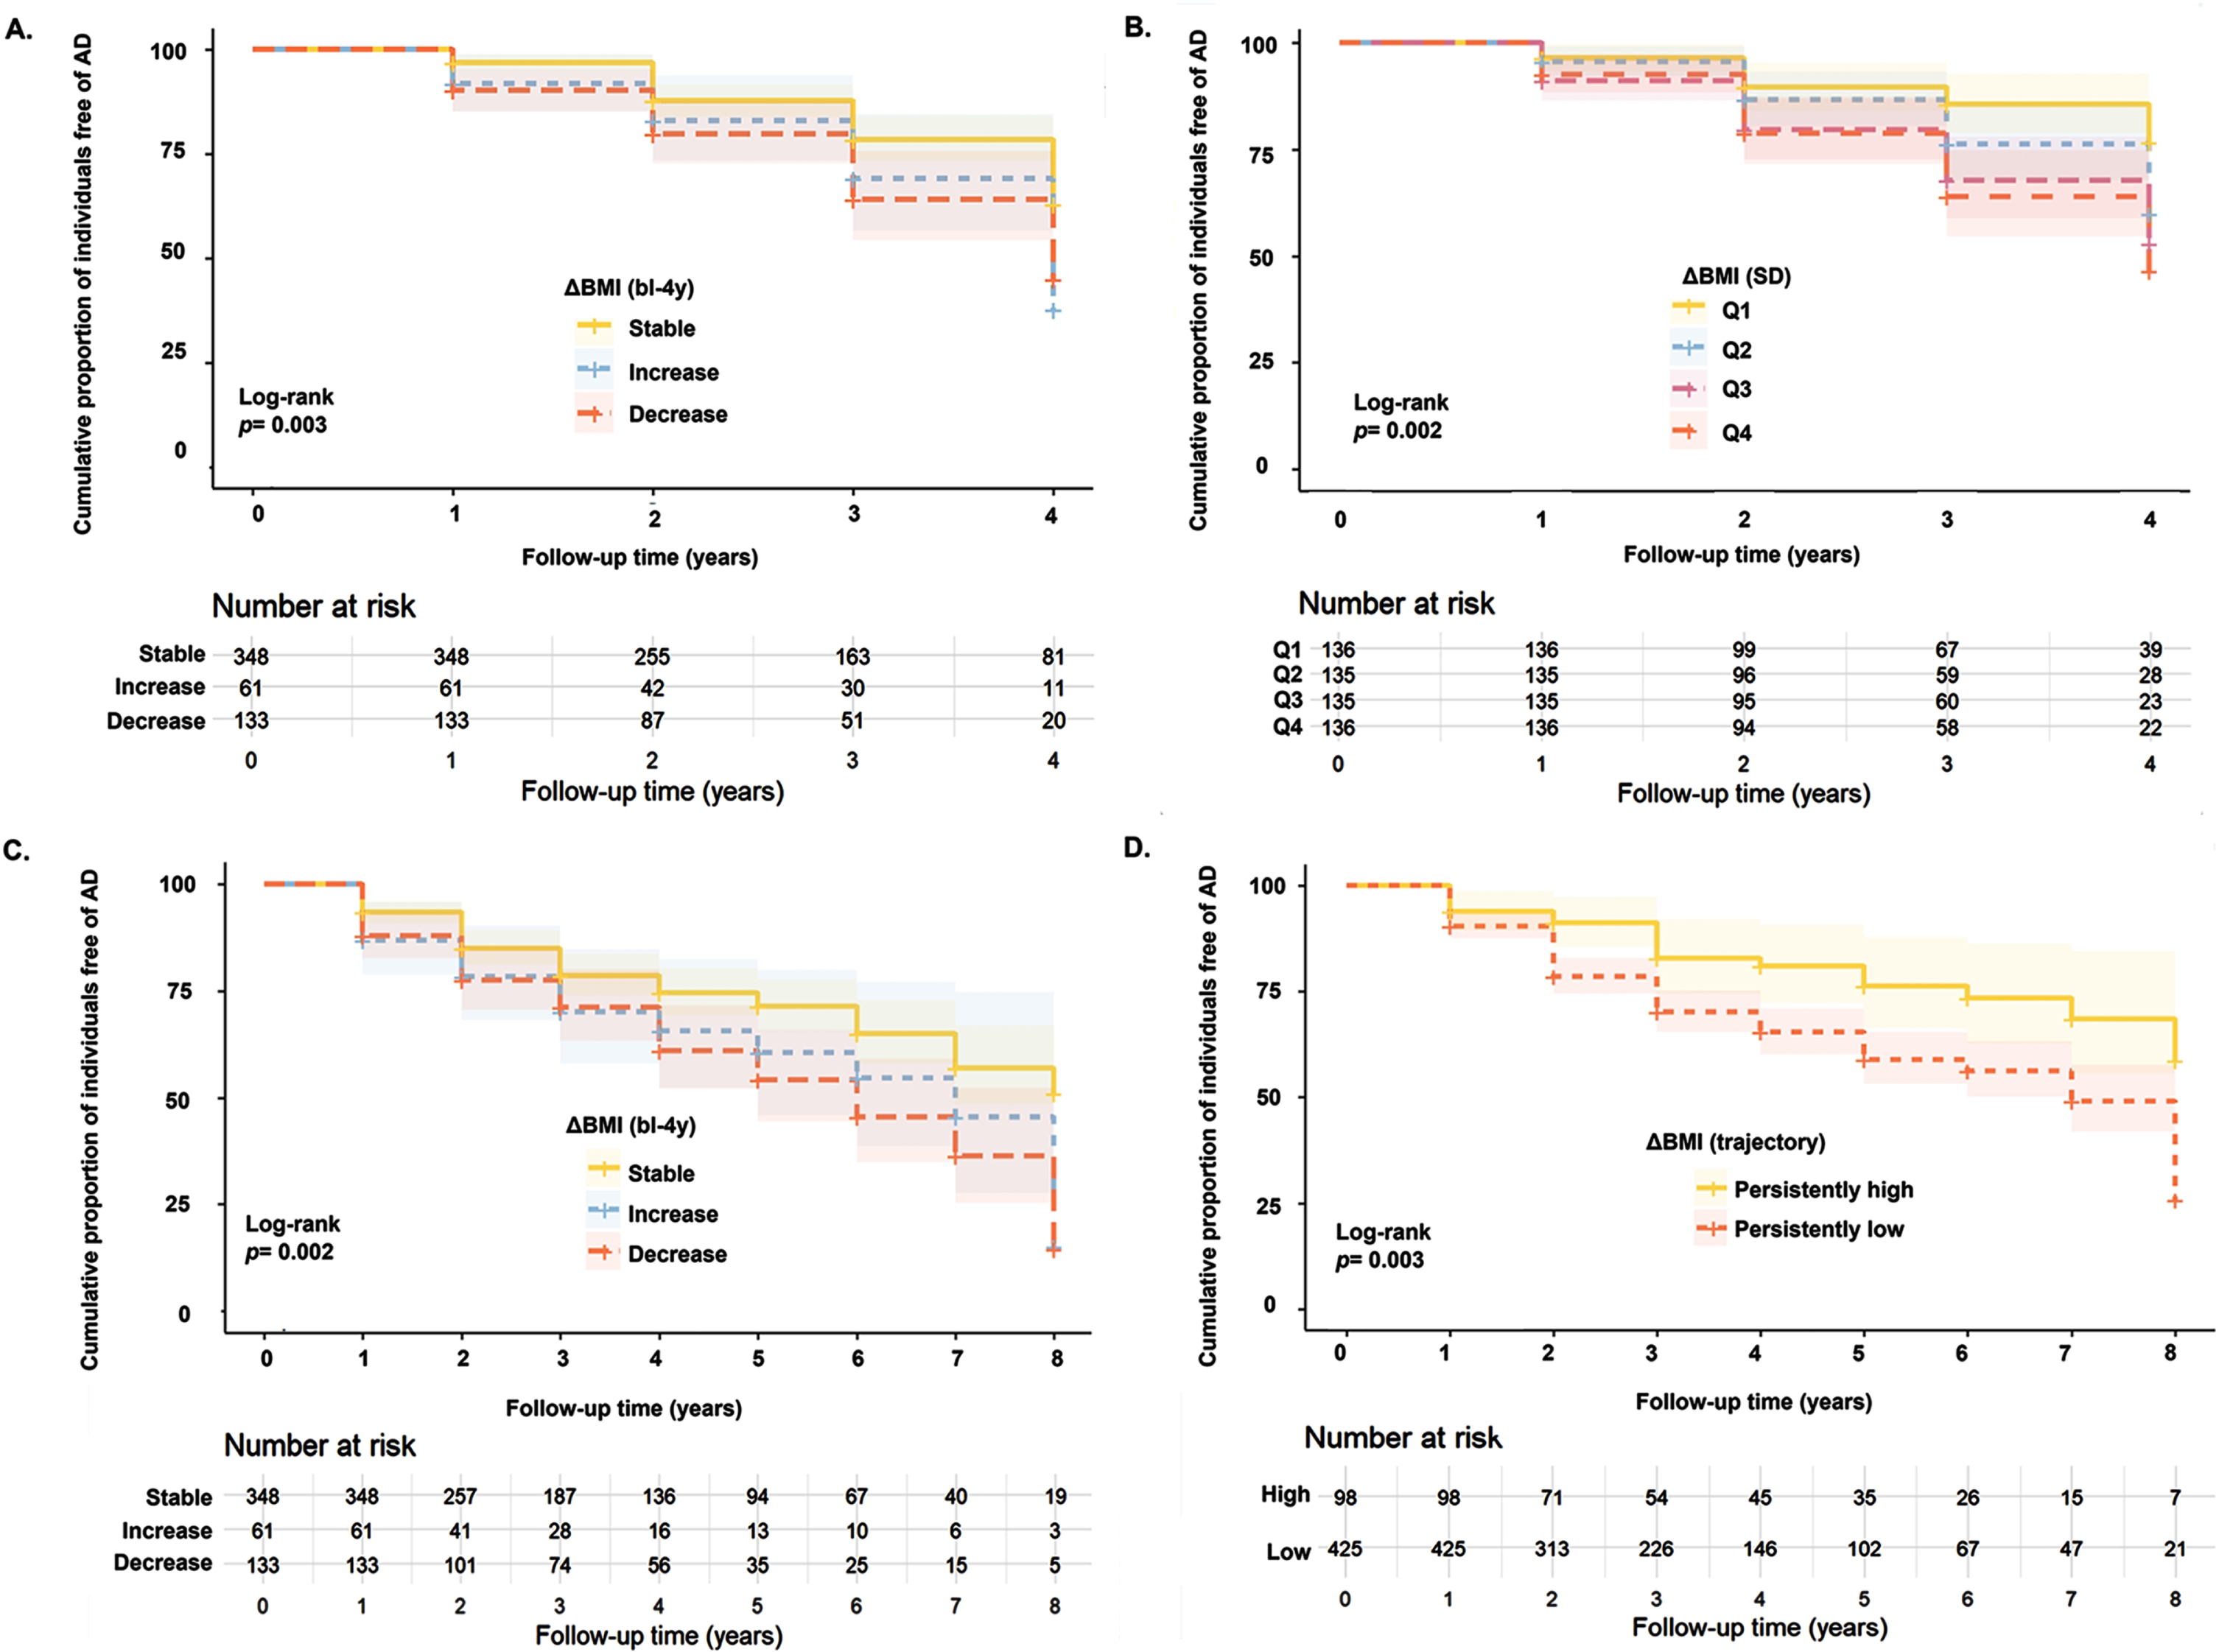
Late-life ΔBMI and Incident AD Risk. During the 4-year period, individuals who experienced notable BMI changes exhibited an elevated risk of incident AD compared to those with stable BMI (A). In comparison to individuals with lower variability, participants with higher variability had an increased risk of incident AD (B). Compared to participants with stable BMI, individuals who underwent significant changes in BMI demonstrated an enhanced risk of developing AD during the 8-year period (C). Individuals with persistently low BMI exhibited a higher risk of incident AD than individuals with persistently high BMI (D). BMI, body mass index; AD, Alzheimer’s disease.
DISCUSSION
Our study comprehensively investigated the association of late-life dynamic BMI features with cognitive decline, AD biomarker trajectory, and incident AD risk. The main findings of our study include: a) late-life stable BMI predicts better trajectory of cognition, Aβ deposition, and hippocampus atrophy; b) BMI decline predicts cognitive decline in older adults, regardless of initial BMI; c) late-life low BMI variation and persistently high BMI predict a lower risk of incident AD, consistently across late-life age strata. These findings not only revealed novel predictors of AD, but also highlighted potential roles of late-life BMI management in a stable status for AD prevention.
Compared to previous literature, we add some values. Firstly, we observed that unstable BMI patterns, characterized by significant changing trends and variability, pose a higher risk for AD onset, compared to stable BMI. This observation aligns with previous research, including two studies on Korean cohorts with a younger demographic (entry age > 60),16,36, 16,36 and a study by Luchsinger et al., that indicated a yearly weight fluctuation of 1 kg corresponds to a 10% escalation in dementia risk. 11 Our study builds on previous findings that link varied definitions of late-life unstable BMI patterns to an elevated AD risk. The consistent results even remain significant in non-demented older adults, implying that substantial changes or fluctuations in BMI might signify compromised homeostatic regulation and overall health, predisposing individuals to AD incidence. Furthermore, the main results were largely consistent across the age stratifications, indicating that the predictive value of late-life dynamic BMI features for AD risk does not change with age in older adults. Considering that BMI changes or fluctuations in older persons are not a benign condition, actively maintaining a consistent BMI throughout late-life could be an important aspect of preventing AD incidence.
Secondly, we for the first time demonstrated that a trajectory of stable high BMI (BMI > 30 kg/m 2 , obese BMI) predicts a reduced risk of AD incidence. This observation supports previous findings that a higher BMI in late-life might serve as a protective factor against AD.4,5,37, 4,5,37 Atti et al. indicated that older individuals with an overweight BMI (>25 kg/m 2 ) or above seem to show this protecting effect. 38 Our study further exhibited that compared to older adults with obese BMI, those with an overweight BMI (persistently low BMI) were also more prone to incident AD. Despite our study is unable to completely explain this intricate correlation, it can be inferred that older individuals with persistently higher BMI might be reflecting a stable homeostatic mechanism, which in turn could offer some degree of protection against AD.39,40, 39,40 Considering the possibility of confounding, chance or bias by the complex status of AD, we conducted sensitivity analyzes excluding AD participants and stratified by age without change in our findings. Hence, our findings underscore the significance of maintaining an obese BMI as a potential strategy in AD prevention.
Our results reinforced prior findings that a significant decrease in late-life BMI could predict cognitive decline.6,10,41,42, 6,10,41,42 We observed this correlation remained significantly even after excluding participants who incident AD in the first 4 years, which could be postulated that BMI decrease could act both as a contributing factor and a phenotype of AD pathology. Further, our findings suggested that late-life decrease in BMI, irrespective of initial BMI status, might result in detrimental cognitive implications, which emphasizes that maintaining a stable BMI is pivotal for older adults to sustain cognitive health. Existing research suggests that intentional reductions in BMI among obese seniors could improve cognitive functions. 43,44 In this sense, it can be assumed that elderly people may benefit from a decrease in BMI when engaging in physical activity or following a healthy diet, while an unintentional decrease in weight (e.g., metabolic disturbances) could be a reliable indicator of cognitive decline. Future studies should delve into how intentional versus unintentional BMI reduction affects cognition, distinguishing the differences between metabolic disturbances and intentional BMI control.
We observed the predictive values of late-life BMI changes for Aβ deposition and hippocampal atrophy. We noticed that this association was independent of the initial BMI, which further underscores the pivotal significance of BMI management in strategies to prevent AD. The association of increased BMI with hippocampal atrophy is a novel discovery. However, another cohort study did not observe this association in older individuals 45 and another associated hippocampal atrophy with a decrease in BMI. 46 The disparity might stem from heterogeneity in measurements of hippocampus over the follow-up period (mean hippocampal volume 45 and last MRI visit). 46 The associations of BMI decrease with Aβ deposition were consistent with findings from several cohorts of younger adults.42,45,47, 42,45,47 Our findings supported the presence of potential reverse causality, as we did not observe the relationship of increased BMI, BMI variability, or BMI trajectories with brain pathology, nor the significant associations with AD biomarkers and hippocampus volume when excluding AD patients within the initial four years. However, the role of BMI dynamic features in predicting cognitive decline or AD dementia remained significant, suggesting that the influence of reverse causality could be partial and there is a bidirectional relationship between late-life BMI and AD pathophysiology across the disease continuum. Consistent with this hypothesis, one population-based study found the relationships of BMI decreases with AD biomarkers were significant in cognitively normal older individuals. 47 Our earlier work suggested that increased Aβ deposition could predict BMI decrease in preclinical AD patients. 48 Bidirectional Mendelian randomization study could help validate this hypothesis in the future.
Several possible mechanisms may explain the observed relationships between stability at higher BMI and reduced AD incidence. Physiologically, the disruptions of homeostatic equilibrium, 49 precipitating BMI changes in the older persons, 50 could potentially trigger low-grade inflammatory linked to adverse cognitive consequences and AD. 51 BMI decreases may affect Aβ deposition through pathways like: (a) sarcopenia-driven systemic inflammation; 52 (b) altered adipocytokine (e.g., leptin) concentrations, 53 known for their neuroprotective propensities by lessening Aβ accumulation; 54 and (c) insulin resistance, 55 which has ties with Aβ production and degradation. 56 Animal studies indicated that rapid BMI fluctuations seem to induce exacerbated adipose tissue inflammation and insulin resistance relative to persistent obesity. 57 On the other hand, increased visceral fat deposition 58 was inextricably linked to surges in proinflammatory cytokines, 59 which correlates with smaller hippocampal volume. 60 Drawing upon these insights, it is possible that the differential risk of AD between persistently high and low BMI groups might be ascribed to the beneficial effects of leptin concentrations, which are strongly entwined with BMI and fat mass. 53
Our study has several strengths. The late-life dynamic BMI features were comprehensively defined to better estimate cumulative exposure and avoid BMI classification bias. Subgroup analyzes and sensitivity analyzes were conducted to explore the stratified effects of BMI groups and to reduce the risk of reverse causality. Several limitations exist. Initially, it is imperative to consider the potential for residual confounding factors, such as the 8-year follow-up period, self-reported covariates like smoking (never smoked or quit smoking), and the exclusion of underweight BMI. The outcomes may be skewed by the underlying condition of AD and some misclassifications that could have caused residual confounding. Therefore, our analysis should be replicated in subsequent studies. The recruitment of volunteer participants from ADNI was better educated, had lower levels of cerebrovascular disease, and was mainly Caucasian, which may have limited the generalizability of the results obtained from the samples. Thirdly, the partial overlap of BMI and the outcomes cannot completely preclude reverse causality, although we tried to mitigate the risk by sensitivity analysis. Fourthly, we cannot conduct analyzes of intentional and unintentional BMI changes, or the diabetes subgroup (limited number of participants with diabetes, n = 45), which may suggest a different physiological change or predictable value. Additionally, other anthropometric assessments of central fat, including waist circumference and waist-to-hip ratio, also need to be considered,61,62, 61,62 given that the accuracy of BMI in measuring adiposity could be affected by lean body mass being replaced with adipose tissue during aging.63,64,65, 63,64,65 Recent studies have explored the association between central fat distribution and AD risk in the older population, yet the conclusions remain debated.4,11,66,67, 4,11,66,67 Future studies via larger, community-based, long-term follow-up and thorough measurements of body composition are needed to confirm these associations.
In conclusion, the present study strengthened the existing evidence that associated a stable higher BMI in late life with a lower risk of AD. The reverse causality might exist but could partially influence the association. Though dynamic features of late-life BMI have proved to be good indicators of AD, future clinical trials are needed to determine the value of BMI management in preventing cognitive decline.
AUTHOR CONTRIBUTIONS
Ruo-Tong Wang (Formal analysis; Methodology; Software; Visualization; Writing–original draft); Zhen Sun (Formal analysis; Writing–review & editing); Chen-Chen Tan (Supervision; Writing–review & editing); Lan Tan (Writing–review & editing); Wei Xu (Conceptualization; Methodology; Supervision; Writing–review & editing).
Footnotes
ACKNOWLEDGMENTS
The authors thank contributors, including the staff at Alzheimer’s Disease Centers who collected samples used in this study, patients, and their families whose help and participation made this work possible.
Data collection and sharing for this project were funded by the Alzheimer’s Disease Neuroimaging Initiative (ADNI) (National Institutes of Health Grant U01 AG024904) and DOD ADNI (Department of Defense award number W81XWH-12-2-0012). ADNI is funded by the National Institute on Aging, the National Institute of Biomedical Imaging and Bioengineering, and through generous contributions from the following: AbbVie, Alzheimer’s Association; Alzheimer’s Drug Discovery Foundation; Paraclone Biotech; BioClinica, Inc.; Biogen; Bristol-Myers Squibb Company; CereSpir, Inc.; Cogstate; Eisai Inc.; Elan Pharmaceuticals, Inc.; Eli Lilly and Company; EuroImmun; F. Hoffmann-La Roche Ltd and its affiliated company Genentech, Inc.; Fujirebio; GE Healthcare; IXICO Ltd.; Janssen Alzheimer Immunotherapy Research & Development, LLC.; Johnson & Johnson Pharmaceutical Research & Development LLC.; Lumosity; Lundbeck; Merck & Co., Inc.; Meso Scale Diagnostics, LLC.; NeuroRx Research; Neurotrack Technologies; Novartis Pharmaceuticals Corporation; Pfizer Inc.; Piramal Imaging; Servier; Takeda Pharmaceutical Company; and Transition Therapeutics. The Canadian Institutes of Health Research is providing funds to support ADNI clinical sites in Canada. Private sector contributions are facilitated by the Foundation for the National Institutes of Health (http://www.fnih.org). The grantee organization is the Northern California Institute for Research and Education, and the study is coordinated by the Alzheimer’s Therapeutic Research Institute at the University of Southern California. ADNI data are disseminated by the Laboratory for Neuro Imaging at the University of Southern California.
FUNDING
This study was supported by grants from the National Natural Science Foundation of China (82001136).
CONFLICT OF INTEREST
The authors have no conflict of interest to report.
DATA AVAILABILITY
All data are available upon reasonable request or can be obtained from the Alzheimer’s Disease Neuroimaging Initiative (ADNI) database (adni.loni.usc.edu).