
Abstract
A remote field eddy current (RFEC) probe for in-service inspection of pipe defects is presented. Firstly, based on finite element analysis, the probe is designed with an external and circumferentially aligned structure. Afterwards, the simulation model of RFEC testing for defect detection is established, and the quantitative relations of the inner diameter (ID) and outer diameter (OD) defect depth to the signal features are analysed. Finally, experimental verification is performed. The results show that: (i) the probe signal phase decreases almost linearly with the increase of ID or OD defect depth, which can be used to quantify defect depth; (ii) the ID or OD defect depth can be quantified respectively, but, due to the different sensitivity to ID and OD defects, it is still hard to quantify the depth when two types of defect exist simultaneously; and (iii) the defect orientation has little effect on the signal phase.
Keywords
Introduction
The remote field eddy current (RFEC) technique has drawn much attention in the non-destructive testing (NDT) of metallic pipes since it was invented in 1951 [1,2]. It relies on the fact that in the remote field region the indirect-coupled magnetic field which travels through pipe wall twice is stronger than the direct-coupled field. Compared to conventional eddy current testing, the distinctive advantages of RFEC are its equal sensitivity to inner diameter (ID) and outer diameter (OD) defects and insensitivity to probe lift-off [3,4].
A conventional RFEC probe consists of two bobbin type coils placed coaxially in the pipe, one as the exciter and the other as the receiver. The receiver is located in the remote field region, which is about 2 to 3 pipe inner diameters away from the exciter. This distinct structure makes the probe with a long size and relatively weak signal feature. Over the past few decades, several efforts have been made to improve the RFEC probe performance. In the literature referenced as [5–7], the authors proposed three main approaches: using the exciter with the flux guide made of ferromagnetic material, shielding between exciter and receiver, and adding an auxiliary exciter. The common purpose is to attenuate the direct-coupled field and enhance the indirect-coupled field. By using these approaches, the signal magnitude was significantly enhanced (up to mV level) and the remote field distance was shortened to about one pipe diameter. In addition, to cope with the situation with obstacles such as weld roots, bends and deposits, flexible and collapsible RFEC probes are also developed [8,9].
The conventional probe often requires the system to be shut down for easy access to the pipe inside. However, in some industries, such as petrochemical and power generation, outside in-service inspection (ISI) is needed when considering long term operation. At present, pulsed eddy current and guided wave are popular ISI methods due to no or few insulation removal, but the former cannot detect very localized defects while the latter may encounter mode conversion at pipe bends [10,11]. In 2012, Yu et al. [12] developed a through-transmission-based technique to inspect in-service ferromagnetic pipes and their studies show that the local outside diameter defect is difficult to be detected by the sensors right above the defect location. In our opinion, this difficulty might be mainly due to the coexistence and competition of the electromagnetic field outside and inside the pipe, and therefore, can be settled by shielding the outside field. Following this idea, an improved RFEC probe has been developed for ISI of ferromagnetic pipes. Details of the probe design and experiment results are presented in this paper.
Probe design
Conventional RFEC probes generate a direct-coupled field propagating axially inside the pipe and an indirect-coupled field propagating outside the pipe. The former attenuates rapidly due to the shielding of eddy currents induced in the pipe wall, while the latter attenuates much slower, which makes former stronger than the latter in the remote field region, thereby causing the latter to travel through the pipe wall again. This is exactly the principle of RFEC effect. For the probe placed outside the pipe, the propagation of excitation field can still be divided into two paths, one along the pipe outer wall and one through the pipe wall into the pipe. In this case, the field in the pipe becomes the indirect-coupled field and making it travel back through the pipe wall to reach the probe is the key objective of probe design.
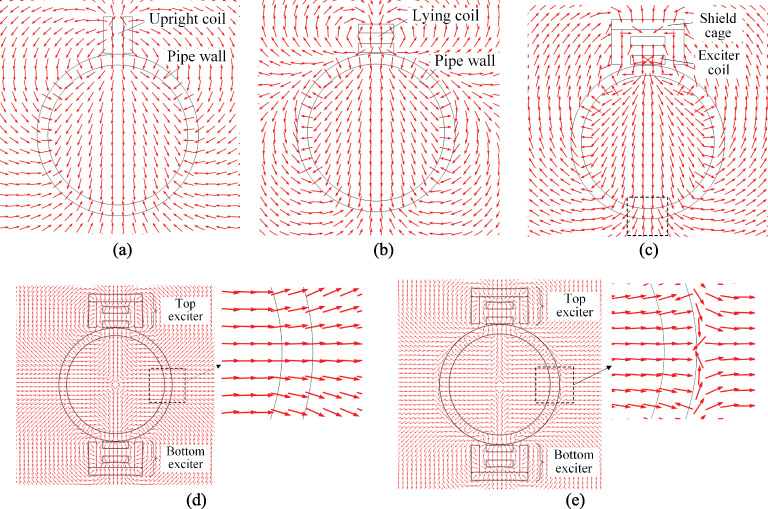
Poynting vector distribution for different exciter assembly placed on the pipe. (a) An upright coil; (b) a lying coil; (c) a shielded lying coil (one exciter); (d) dual exciters with identical current; (e) dual exciters with opposite-phase current.
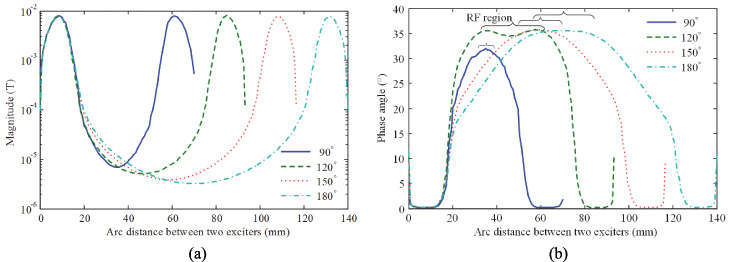
Effect of exciter angle on (a) magnitude curves; (b) phase angle curves.
The probe design is based on finite element analysis (FEA). At first, an exciter coil placed outside a pipe is numerically modeled. Strictly speaking, both the exciter coil and the pipe form a 3D problem, but considering the main purpose is to qualitatively determine the double through-wall transmission phenomena, a 2D model is adopted for simplicity. Figures 1(a) and (b) show the distribution of Poynting vectors for an exciter coil placed upright and lying on the pipe, respectively. Since the Poynting vector represents the directional energy flux density of an electromagnetic field, it can be used to judge the through-wall transmission phenomena. As shown in Fig. 1(a), the indirect field almost does not penetrate into the pipe wall around the whole circumference. While in Fig. 1(b), as the arc distance from the lying coil increases, the indirect field meets the direct field in the pipe wall and gets nearer to the pipe outer wall, especially at a circumferential location directly across from the coil. Therefore, the lying-placed coil is preferred and selected as the exciter coil. Then, to realize the second through-wall transmission of the indirect field, a high-permeability U-shaped shield cage is applied over the exciter coil to suppress the direct field energy. From Fig. 1(c), it can be seen that the indirect field has completely passed through the pipe wall around almost the whole circumference, proving the occurrence of RFEC effect.
Based on the above results, dual exciters are arranged in the circular direction to further enhance the indirect field. Figure 1(d) and (e) shows the distribution of Poynting vector when top and bottom exciter coils are applied with same and opposite phase current respectively. The zoomed-in region reveals that the indirect field fails to pass through the pipe wall for the second case. Therefore, the first excitation scheme is adopted. Compared to one single exciter, the dashed marked area where the Poynting vector perpendicularly penetrates through the pipe wall changes from the bottom under the exciter to the middle of dual exciters. This also means the region where a large amount of flux lines leaks out is brought closer, and thus the receiver can be set more closely to the exciter, making the entire probe structure more compact.
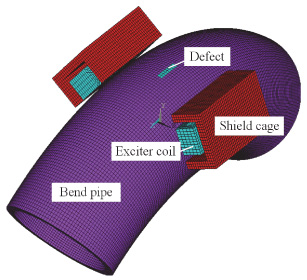
The 3D FE model.
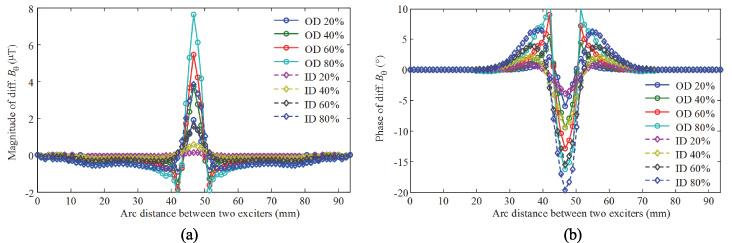
Simulated signals for ID and OD defects with different depths. (a) Magnitude; (b) phase.
To further optimize the probe structure, dual exciters with different central angles varied from 90 to 180 degrees are modeled. Figure 2 shows the magnitude and phase angle of the magnetic flux density as functions of the arc distance between two exciters. It can be seen that the magnitude at the receiver location decreases as the exciter angle increases. For the phase angle curve, the top flat part (corresponding to the remote field region) stretches until the exciter angle reaches 120 degrees, and then its length no longer increases or even slightly decreases. Therefore, as a compromise choice, 120 degrees is determined for the designed probe. In this case, the circumferential coverage of remote field is large and the magnetic field is relatively strong.
3D FE model
In this section, a 3D FE model is built to demonstrate the defect detectability of the design probe. Figure 3 shows the FE model without the surrounding air elements for clarity.
The specimen under test is a bend pipe with geometry and material parameters listed in Table 1. An axially aligned groove with dimensions of 12 mm × 4 mm is set on the central outer or inner surface to simulate the OD or ID defects. The groove depth is set to be a variable with value equal to 20, 40, 60 or 80 percent of pipe wall thickness. Table 2 lists the probe parameters. The exciter coil is a rectangular coil. An input sine wave with current density 5 × 10⁶ A/m2, frequency 5 Hz and phase 0° is applied to the exciter coil.
Quantification of defect depth
Figure 4 shows the simulated signals for ID and OD defects with different depths. The notation diff. B θ in the y-axis is the circumferential component of a differential magnetic signal between a FEA model with a defect and that without a defect. As it is seen from the figure, at the vicinity of the defect location, the magnitude of differential signal increases with the increase of defect depth while the phase decreases with a negative value. This corresponds to the fact that, when magnetic field passes through the pipe wall, the smaller is the residual wall thickness, the less is the energy loss and the smaller is the phase lag.
Bend pipe parameters
Bend pipe parameters
Probe parameters
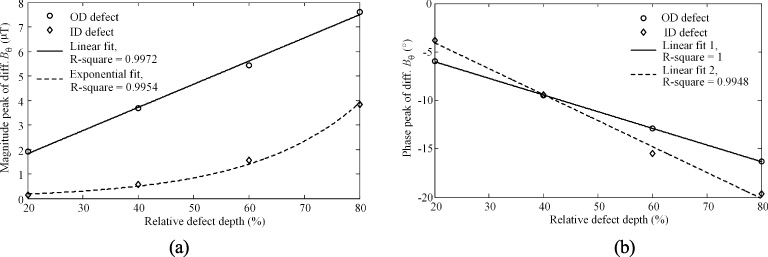
Quantitative relations between simulated signal features and relative defect depth. (a) Magnitude; (b) phase.
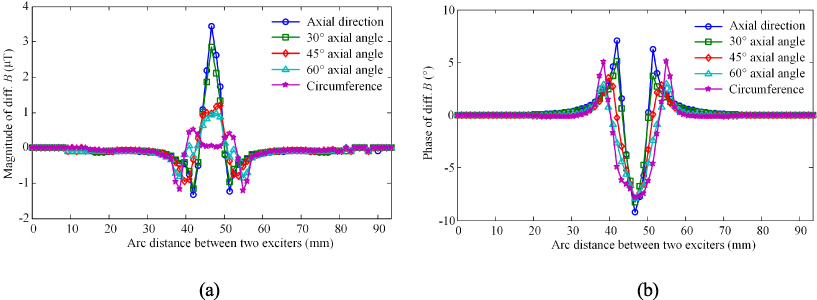
Comparison of simulated signals for defects present at different axial angles. (a) Magnitude; (b) phase.
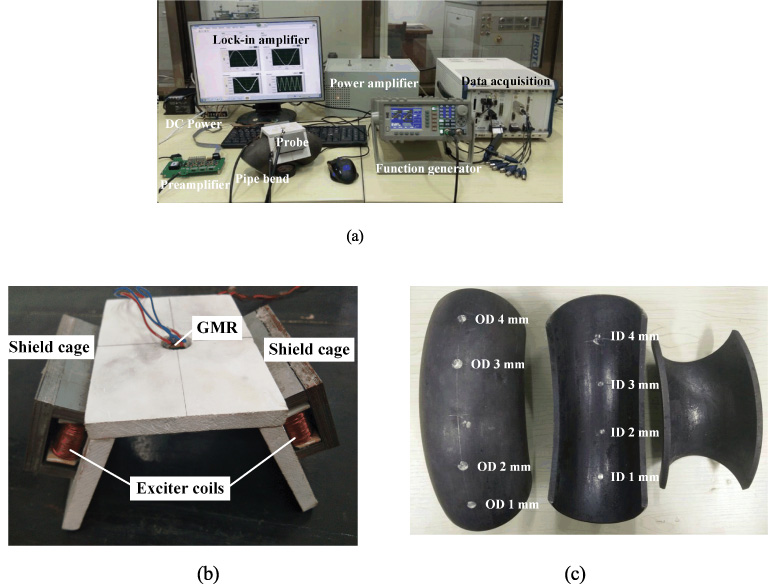
(a) Experimental set-up; (b) Probe; (c) Specimen.
The signal peaks are appearing at the defect location. Taking magnitude and phase peaks as the signal features, quantitative relations between signal features and defect depth are obtained, as shown in Fig. 5. As the defect depth increases, the magnitude peaks of OD defect signals show good linearity, but for ID defect signal, its magnitude peaks vary exponentially and relatively slightly. The phase peak has a very good linear fit with defect depth for both OD and ID defect signals, but the slope of the fit line for ID defect signal phase is larger than that for OD defect signal phase. The reason might be that there still is weak interaction of direct filed with OD defect since the low-frequency direct field is hard to be completely shielded, causing the contribution of indirect field to be relatively reduced.
Therefore, the phase feature is selected due to its better linearity. Due to the difference in sensitivity, it can be indicated that the defect depth can be quantified in the presence of only one type (ID or OD) defect by using the phase feature, but cannot be accurately quantified when both two types of defect exist simultaneously.
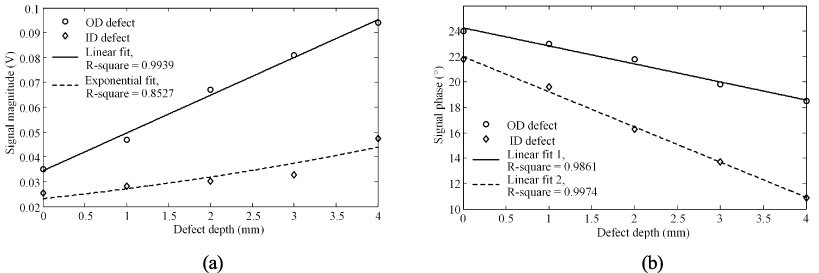
Relations between experimental signal features and defect depth. (a) magnitude; (b) phase.
The effect of the defect orientation on the defect signal is numerically studied. An OD groove with 12 mm length, 4 mm width and 40%-wall-thickness depth is set in the bend pipe. In Fig. 6 simulation results are shown for defect orientation changing from axial direction to circumference. As the axial angle increases the signal magnitude decreases. At an angle of 90° (i.e. circumference), the signal is weakest because the defect is parallel to the magnetic field generated by the probe. In this sense, the probe tends to be more sensitive to axial defect. However, as shown in Fig. 6(b), the signal phase basically remains unchanged for defects oriented in all directions. Therefore, in use of the phase feature, the effect of the defect orientation on the defect signal can be ignored.
Experimental verification
Experimental study is also performed and the set-up is shown in Fig. 7. A sine-wave voltage signal is generated by a function generator, then converted to a current signal and amplified by a power amplifier. The amplified sine-wave current is provided to the exciter coils. A GMR sensor (NVE AA002-02) with the sensitive direction along circumference is located at the middle of two exciters. Its output voltage is amplified by a preamplifier, then interfaced to a NI data acquisition system. The magnitude and phase angle of the receive signals are extracted by using a digital lock-in amplifier program (coded in LabVIEW).
The amplitude, frequency and initial phase of the excitation current are set to 2 amps, 5 Hz and 0°, respectively. The shield cage is made of high-permeability silicon steel. The bend pipe specimen is made of Q235 carbon steel and has actual thickness of about 5.2 mm. Other probe and specimen dimensions are the same as those in simulation. Totally two specimens are used, one has four blind holes with depths of 1, 2, 3 and 4 mm drilled on the outer surface, the other is cut in half and then also drilled four blind holes with depths same as the former on the inner surface.
Figure 8 shows the experiment results obtained by placing the probe at each defect. It can be seen that the variation patterns of experimental signal features about defect depth correspond well with the simulation results, which validates the effectiveness and usefulness of the designed probe. Compared to the simulation results shown in Fig. 5, the exponential fit for the ID defect signal magnitude yields a lower R-square value of 0.8527. This is probably because in experiment the defects are at different locations of the bend pipe rather than always at the centre, resulting in variation of the probe lift-off values corresponding to the varying shaped surface of the bend pipe.
Conclusion
A RFEC probe for in-service inspection of pipe defects is proposed. Unlike conventional RFEC probes, a circumferentially aligned structure fixed outside the pipe is adopted in the designed probe. This structure obliges the excitation field to pass through the pipe wall twice in the circumferential direction, thus making the RFEC effect come into play. Simulation and experiment are performed to examine the probe performance. The results indicate that: (i) by using the phase feature of the receiver signal, the ID or OD defect depth can be quantified respectively, (ii) but, due to the different sensitivity to ID and OD defects, it is still hard to quantify the depth when two types of defect exist simultaneously, and (iii) the defect orientation has little effect on the signal phase.
In contrast to the conventional probe, the proposed probe follows the same theoretical basis but has a more compact structure and, most important, capable of in-service inspection from pipe outside. Further work will focus on optimizing the probe dimensions and exploring additional signal features, in order to improve the probe performance, especially the ability to classify ID and OD defects.
Footnotes
Acknowledgements
This work is supported by National Natural Science Foundation of China (Grant No. 51505406) and Natural Science Foundation of Hunan Province (Grant No. 2015JJ3116).