Although two-dimensional (2-D) magnetic properties can be measured by using a 2-D single sheet tester (SST), the construction of the reliable 2-D SST is considerably difficult. By contrast, the flux density and magnetic field parallel to the excitation direction can be measured in a normal one-dimensional (1-D) SST. If the average flux density points toward the excitation direction in a specimen with any inclination angle from its rolling direction, the magnetic energy can be defined and therefore 2-D magnetic properties can be calculated by means of an energy-based modelling method. However, the direction of the flux density and magnetic field in the 1-D SST has not been deeply discussed when a specimen with any inclination angle is measured. In this paper, the behavior of the flux density and the magnetic field strength is examined by using 1-D SST. The direction of the flux density is measured by using a pair of cross B-coils. The direction of the magnetic field strength is measured by using a pair of cross H-coils. The effect of the specimen width on the distribution of flux density is also investigated by using a magnetic field analysis. As a result, when a pair of cross H-coils is adopted to a specimen with appropriate aspect ratio, 2-D magnetic properties can be measured by means of the 1-D SST.
Accurate iron loss estimation with the help of numerical simulation of magnetic fields is required to design higher efficient electrical machines such as motors and transformers. In order to calculate magnetic fields in more detail, two-dimensional (2-D) magnetic properties of electrical steel sheets consisting of iron cores are to be taken into account. A 2-D single sheet tester (SST) is used in essence to measure the 2-D magnetic properties because the direction and amplitude of flux density can be controlled precisely due to double excitations. However, the construction of a reliable 2-D SST is considerably difficult.
In this paper, a possibility of applying the one-dimensional (1-D) SST to measuring 2-D magnetic properties is investigated. If the average flux density points toward the excitation direction in a specimen with any inclination angle from its rolling direction, the magnetic energy can be defined and therefore the 2-D magnetic properties can be calculated by means of an energy-based modelling method [1, 2, 3]. In an energy-based modelling method, rotational loss cannot be calculated because only the single excitation is possible in the 1-D SST. Also, The cutting of so many strip specimens is considerably convenient and causes high material consumption. However, in the 2-D SST, keeping orthogonality between specimen and H-coils is difficult, and it is difficult to RDs of specimen and magnetic shields coincide with each other because specimen shape is circular. Convergence characteristic is also considerably poor. In those points, an energy-based modelling method is useful from a practical viewpoint. Three kinds of electrical steel sheets are prepared (non-oriented: JIS 50A470 and grain-oriented: JIS 35G155, 23P90), and the behavior of the flux density and the magnetic field strength is examined by using an ordinary 1-D SST.
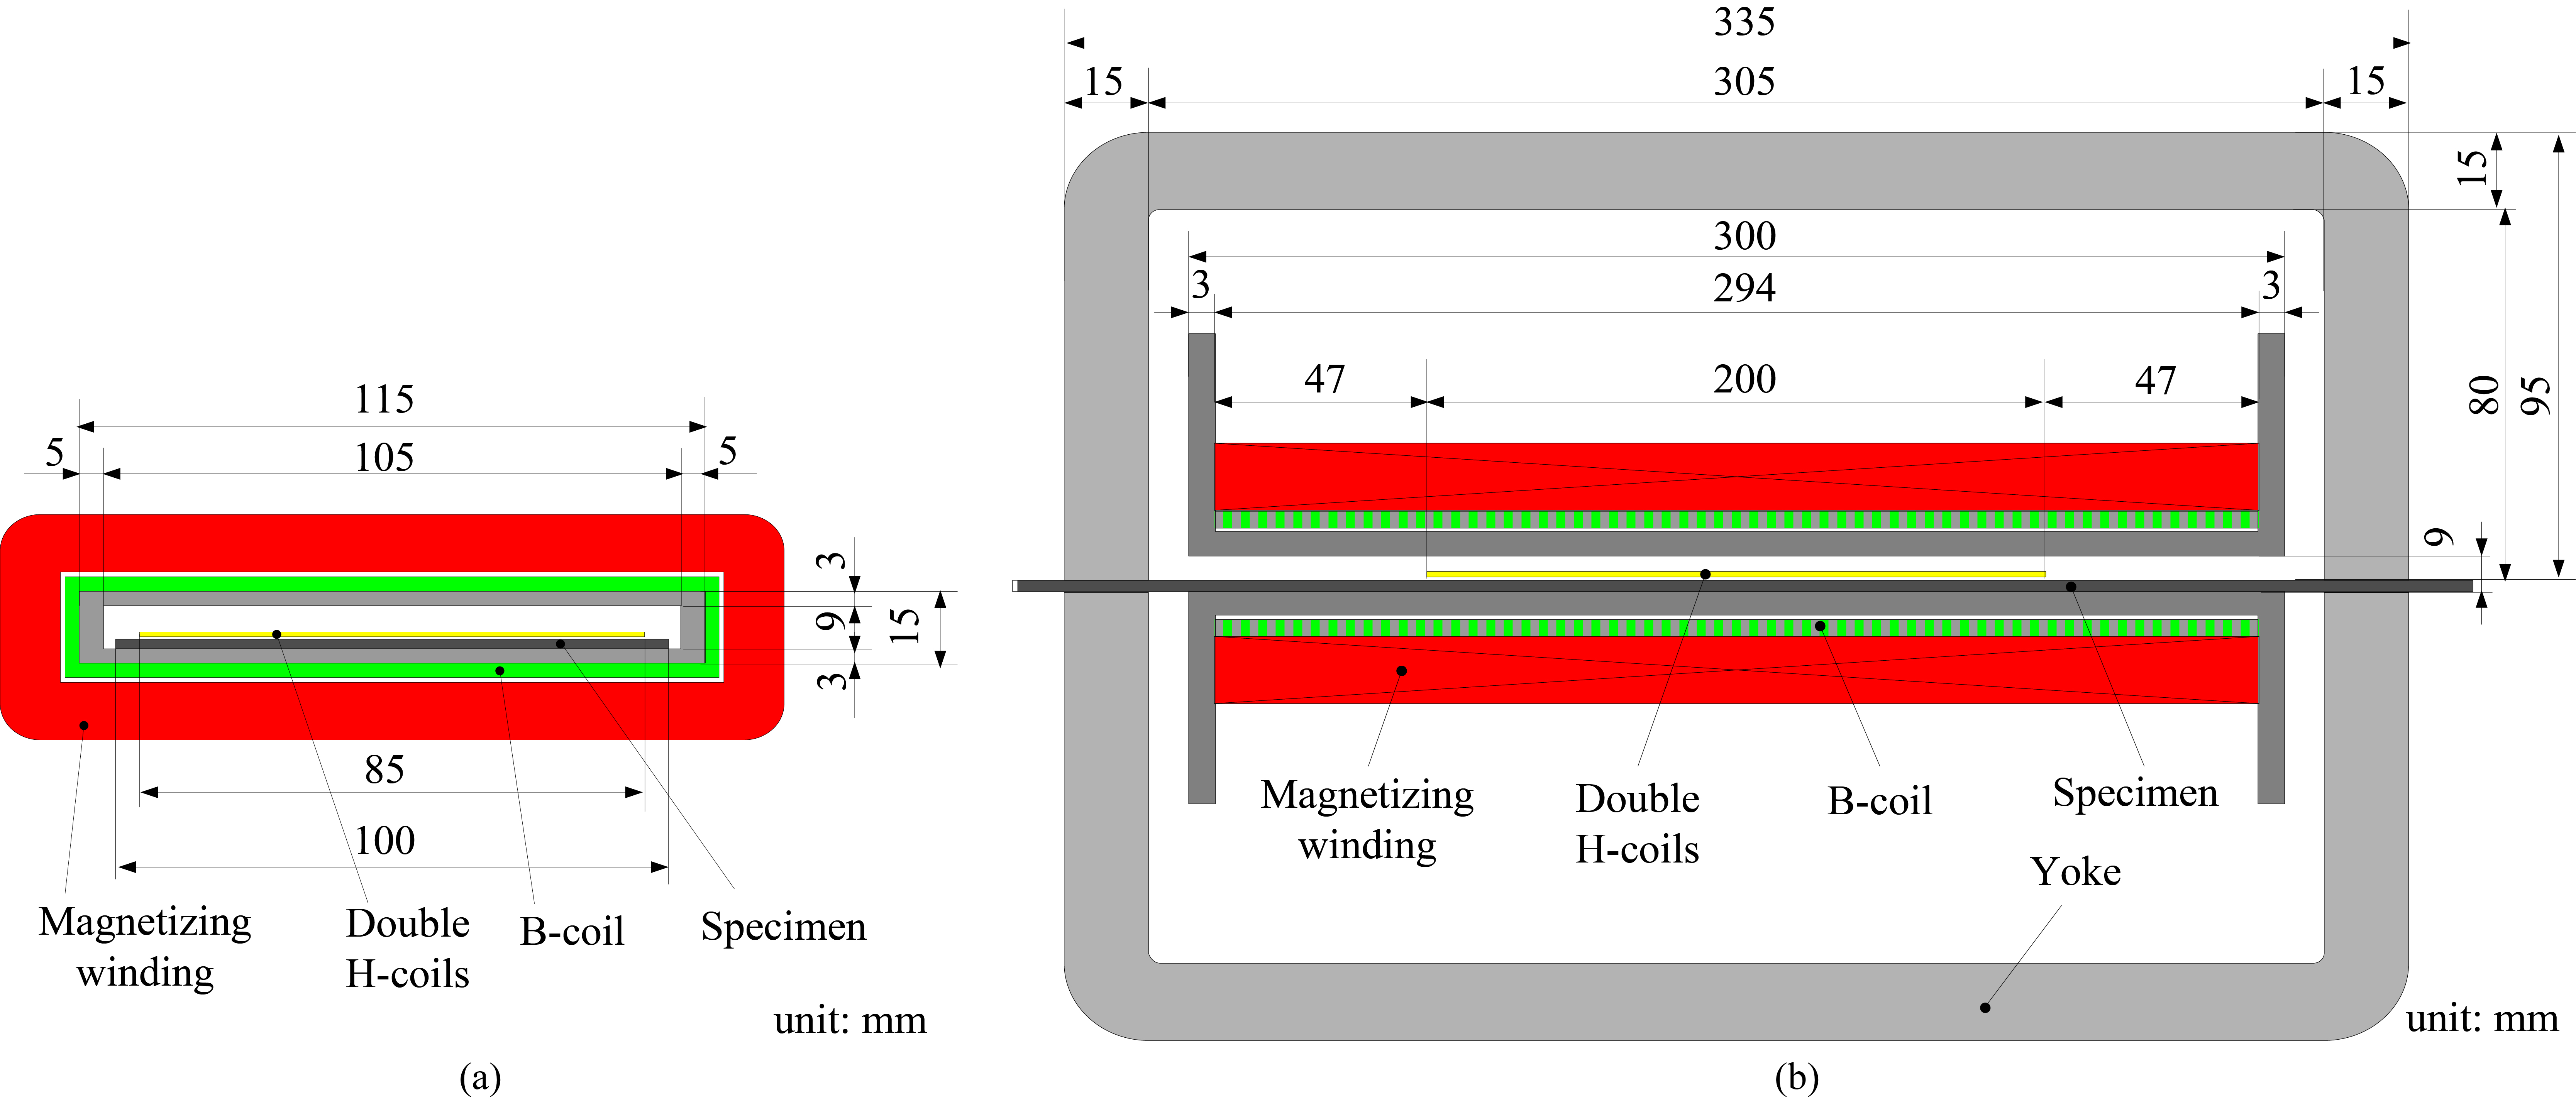
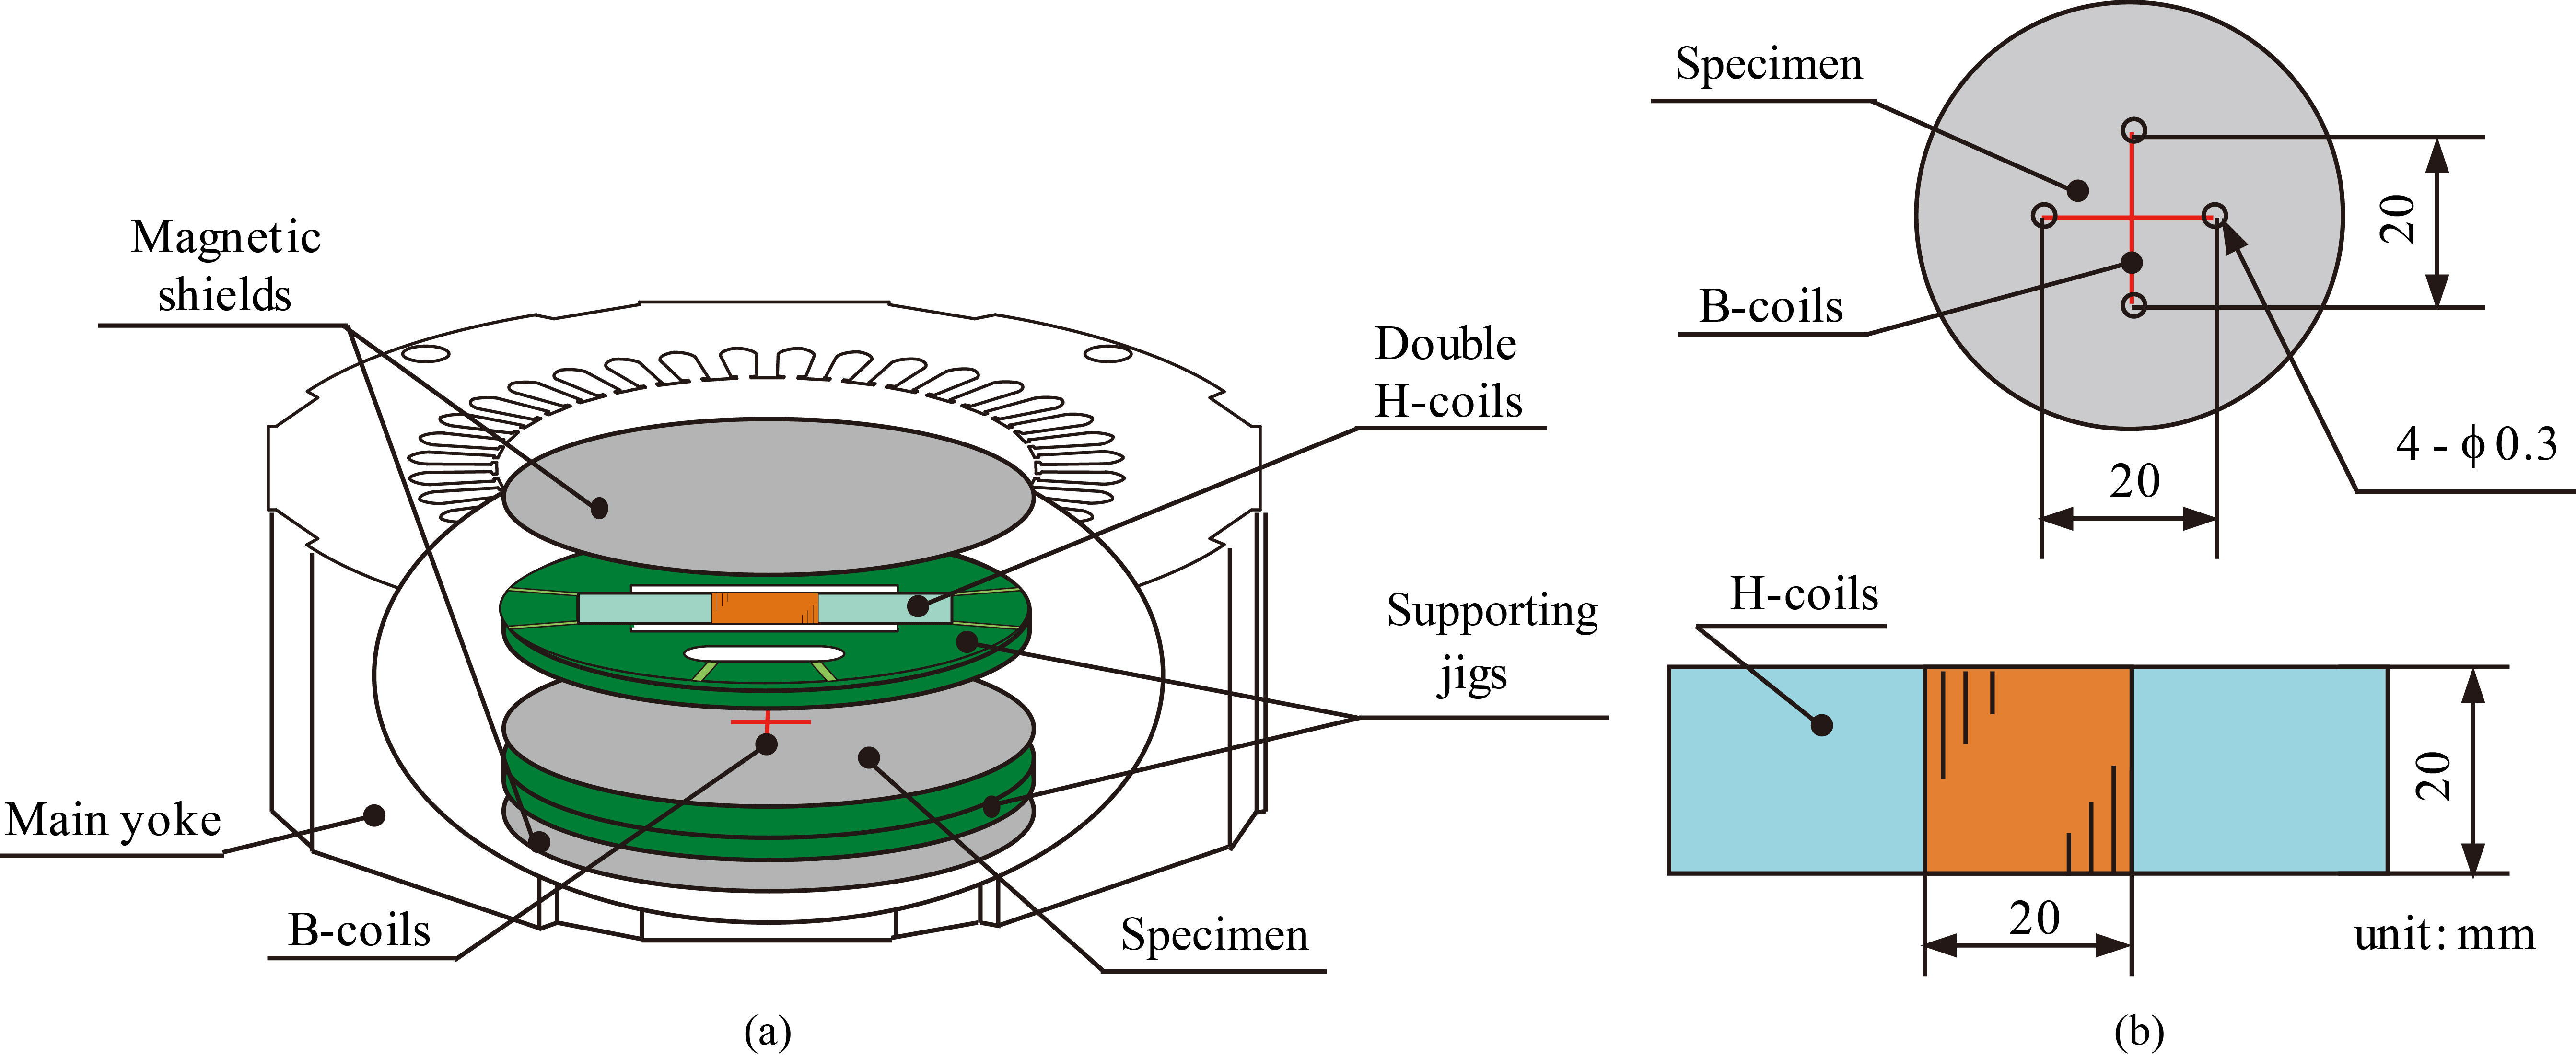
The construction of the 1-D SST. (a) Front view. (b) Side view.
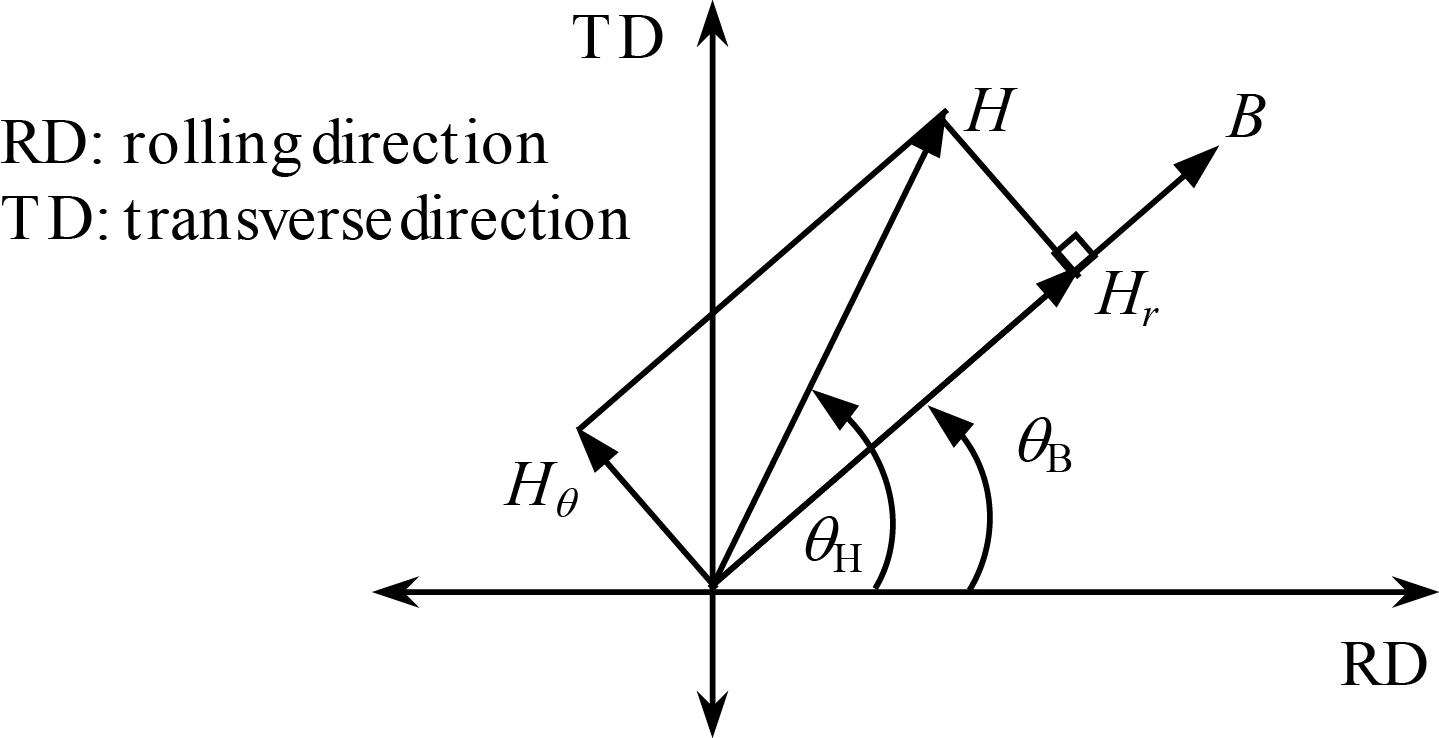
Relationship between and in specimen.
Measurement methods
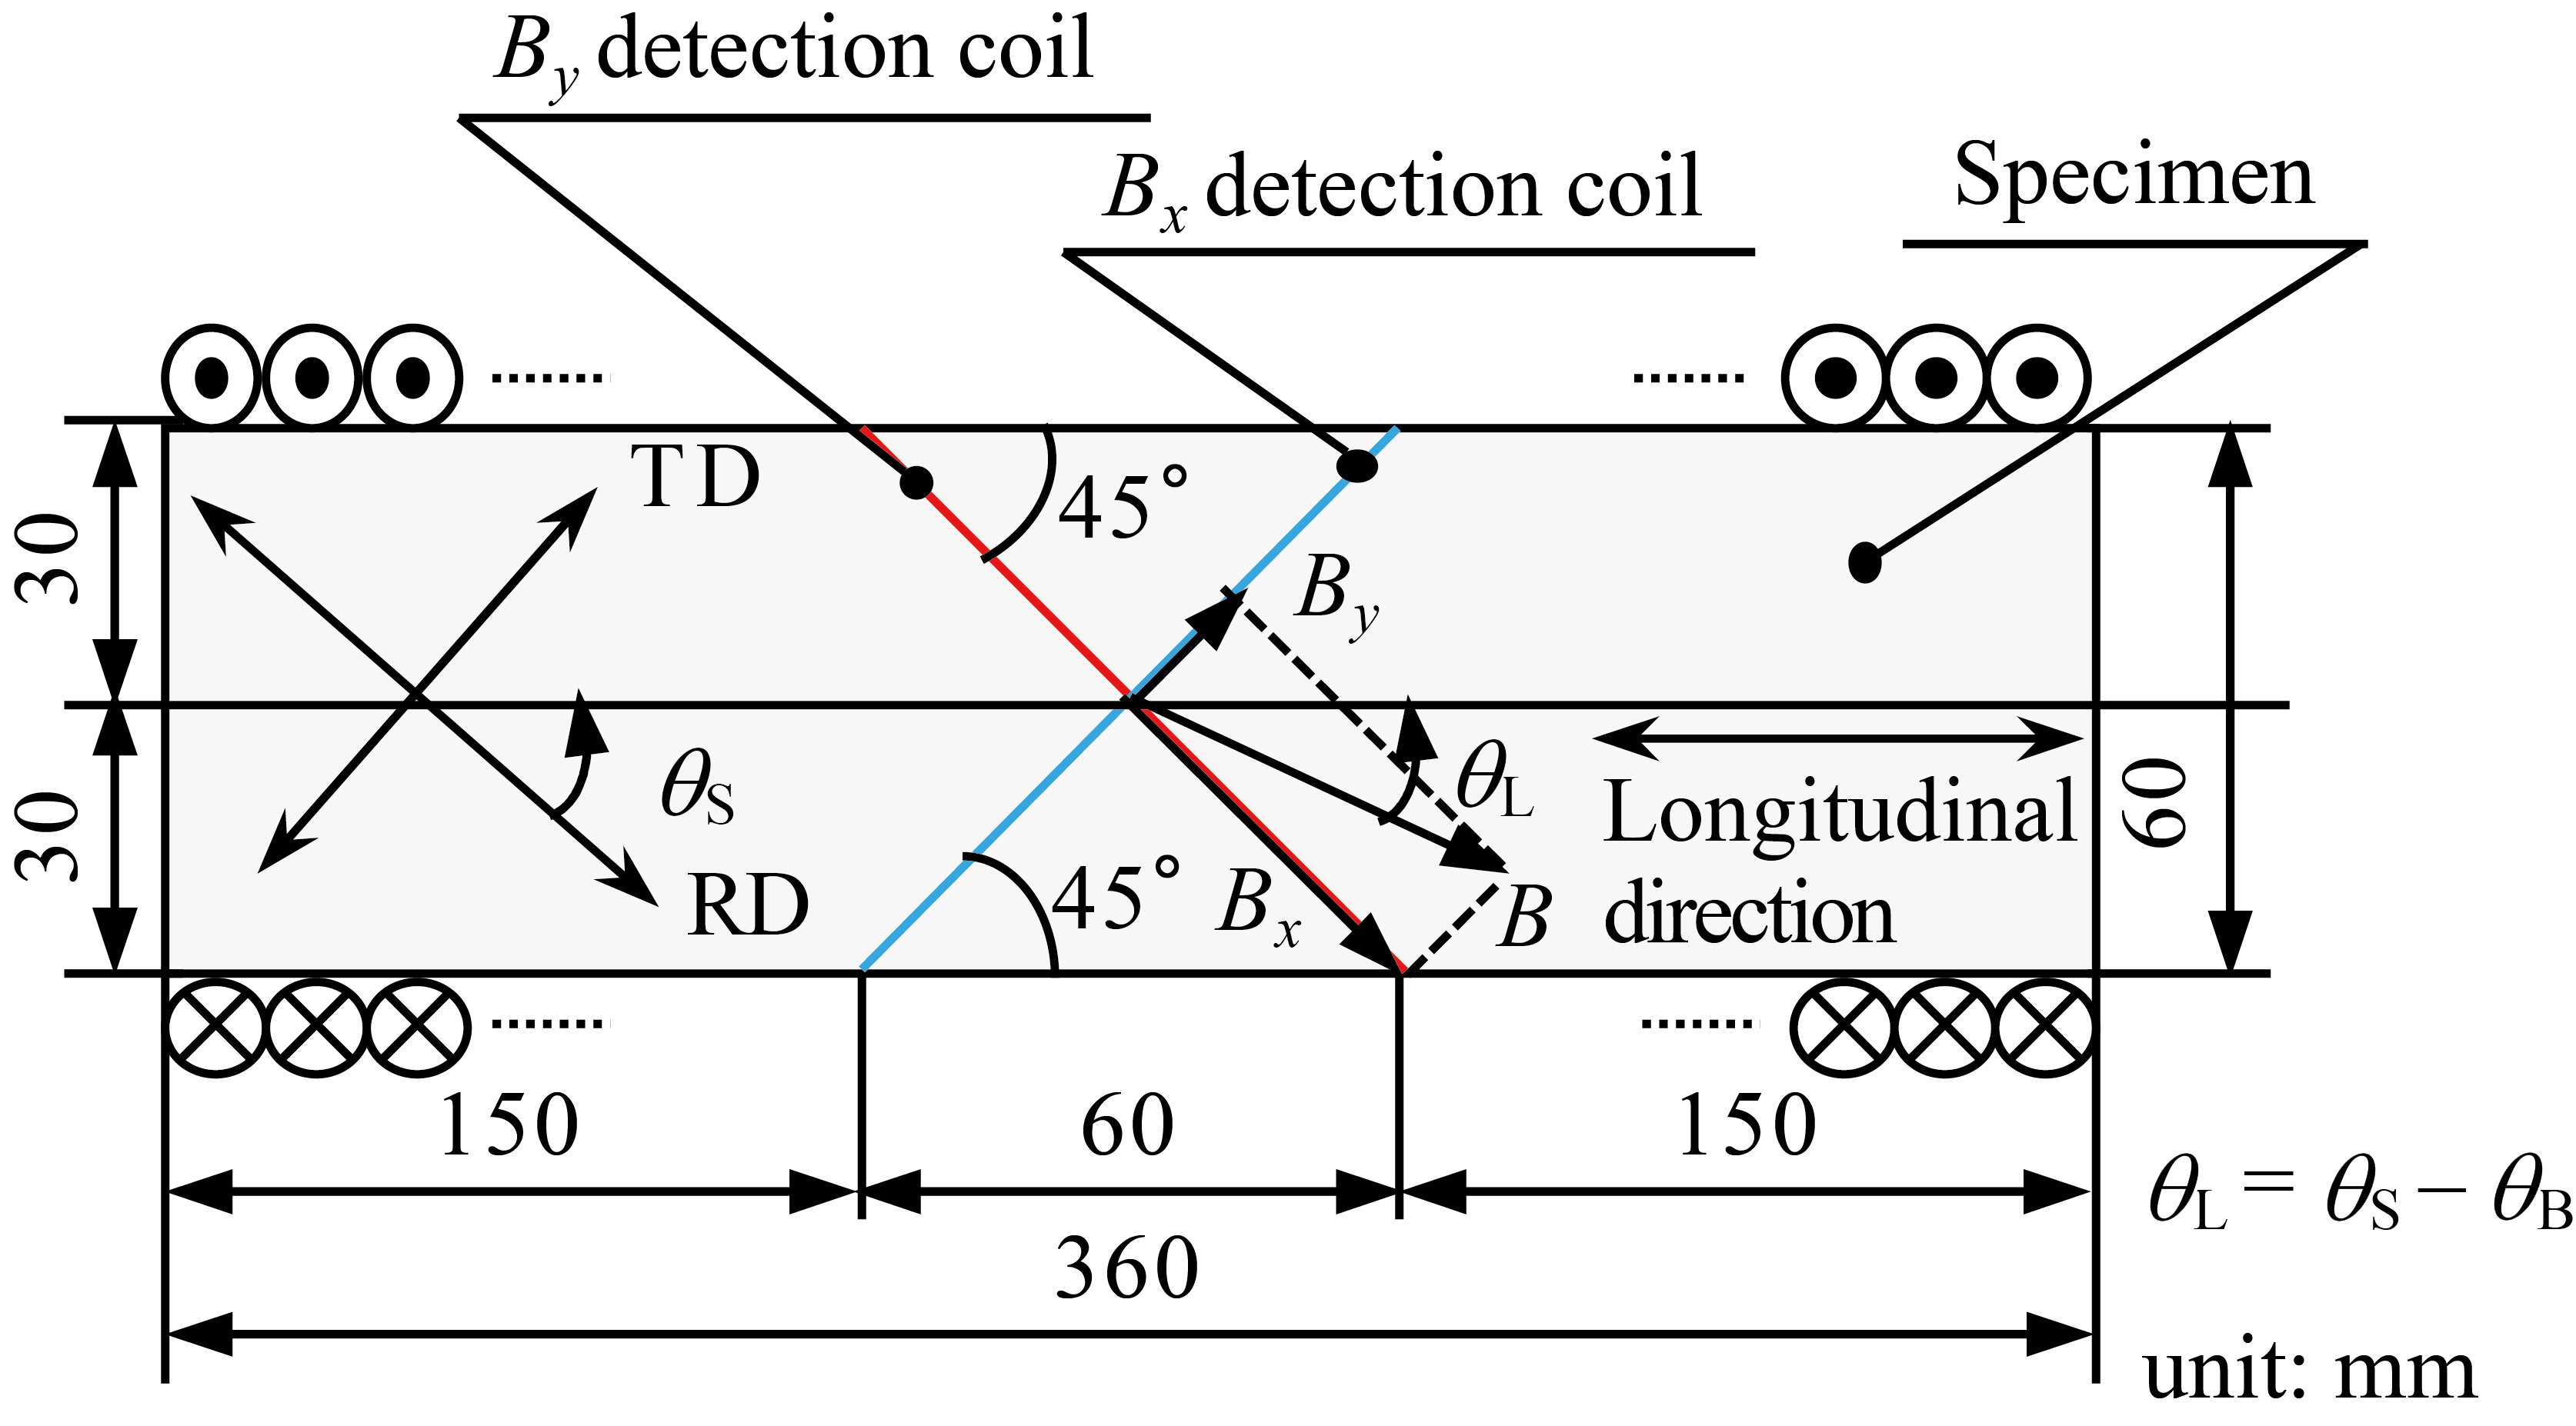
Figure 1 shows the 1-D SST used for measurement. Figure 2 shows the parameters for evaluating 2-D magnetic properties. and are defined as the components of the magnetic field strength H parallel and perpendicular to the flux density B, respectively. is the angle between B and the rolling direction (RD). is the angle between H and RD. is the inclination angle between the longitudinal direction of the single sheet specimen and RD. Several specimens with different inclination angles should be prepared to evaluate the 2-D magnetic properties by using the 1-D SST because only the single excitation is possible. ( – is the angle between B and the longitudinal direction. If is equal to (namely, 0), we can simply calculate an iron loss from and measured by using the 1-D SST. In order to confirm whether B points toward the longitudinal direction in the 1-D SST or not, is evaluated by measuring and as shown in Fig. 3 [4]. and are measured by winding a pair of cross B-coils around the specimen. Rectangular specimens of 50A470, 35G155 and 23P90 (60 mm 360 mm) are measured. For each electrical steel sheet, seven specimens whose is from 0 to 90 at the interval of 15 are prepared. The flux density along the longitudinal direction is detected by an ordinary B-coil, and its amplitude is controlled from 0.05 T to 2.00 T at the interval of 0.05 T with the sinusoidal flux condition. The exciting frequency is 50 Hz.
Method of measuring and .
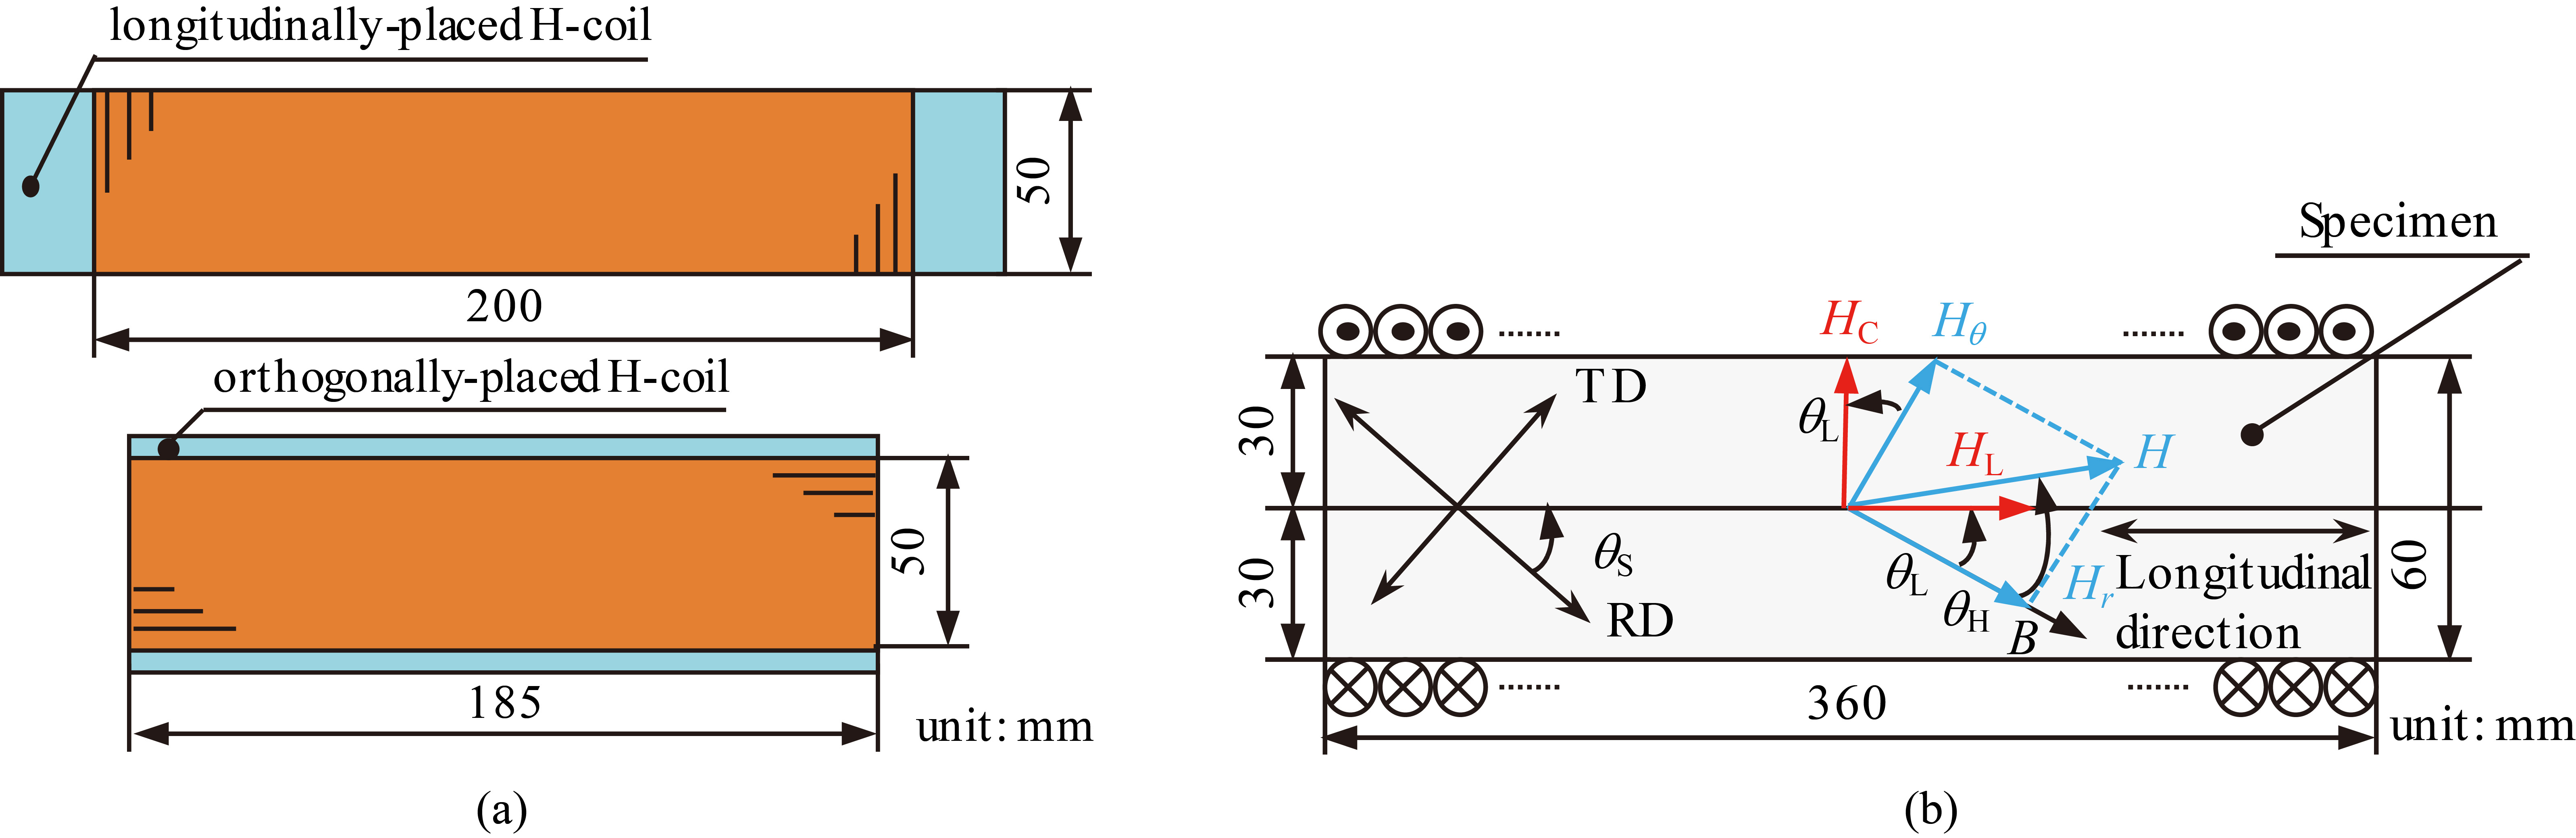
Method of evaluating , and . (a) Longitudinally-placed H-coil and orthogonally-placed H-coil. (b) Method of measuring and .
Moreover, is also evaluated by using a pair of cross H-coils as shown in Fig. 4. Longitudinally-placed H-coil is used for measuring . Orthogonally-placed H-coil is used for measuring . and are measured by means of double H-coil method [5]. In order to compare the results of 1-D SST with those of 2-D SST, circular specimen of 35G155 (99 mm in diameter) is measured by using the round rotational SST (RRSST) [6, 7], which is a 2-D SST utilizing a stator of a motor. Figure 5 shows the RRSST used for measurement. In RRSST, the flux density amplitude is controlled from 0.1 T to 2.0 T at the interval of 0.1 T under alternating flux condition.
The construction of the RRSST. (a) The RRSST. (b) B-coils and H-coils.
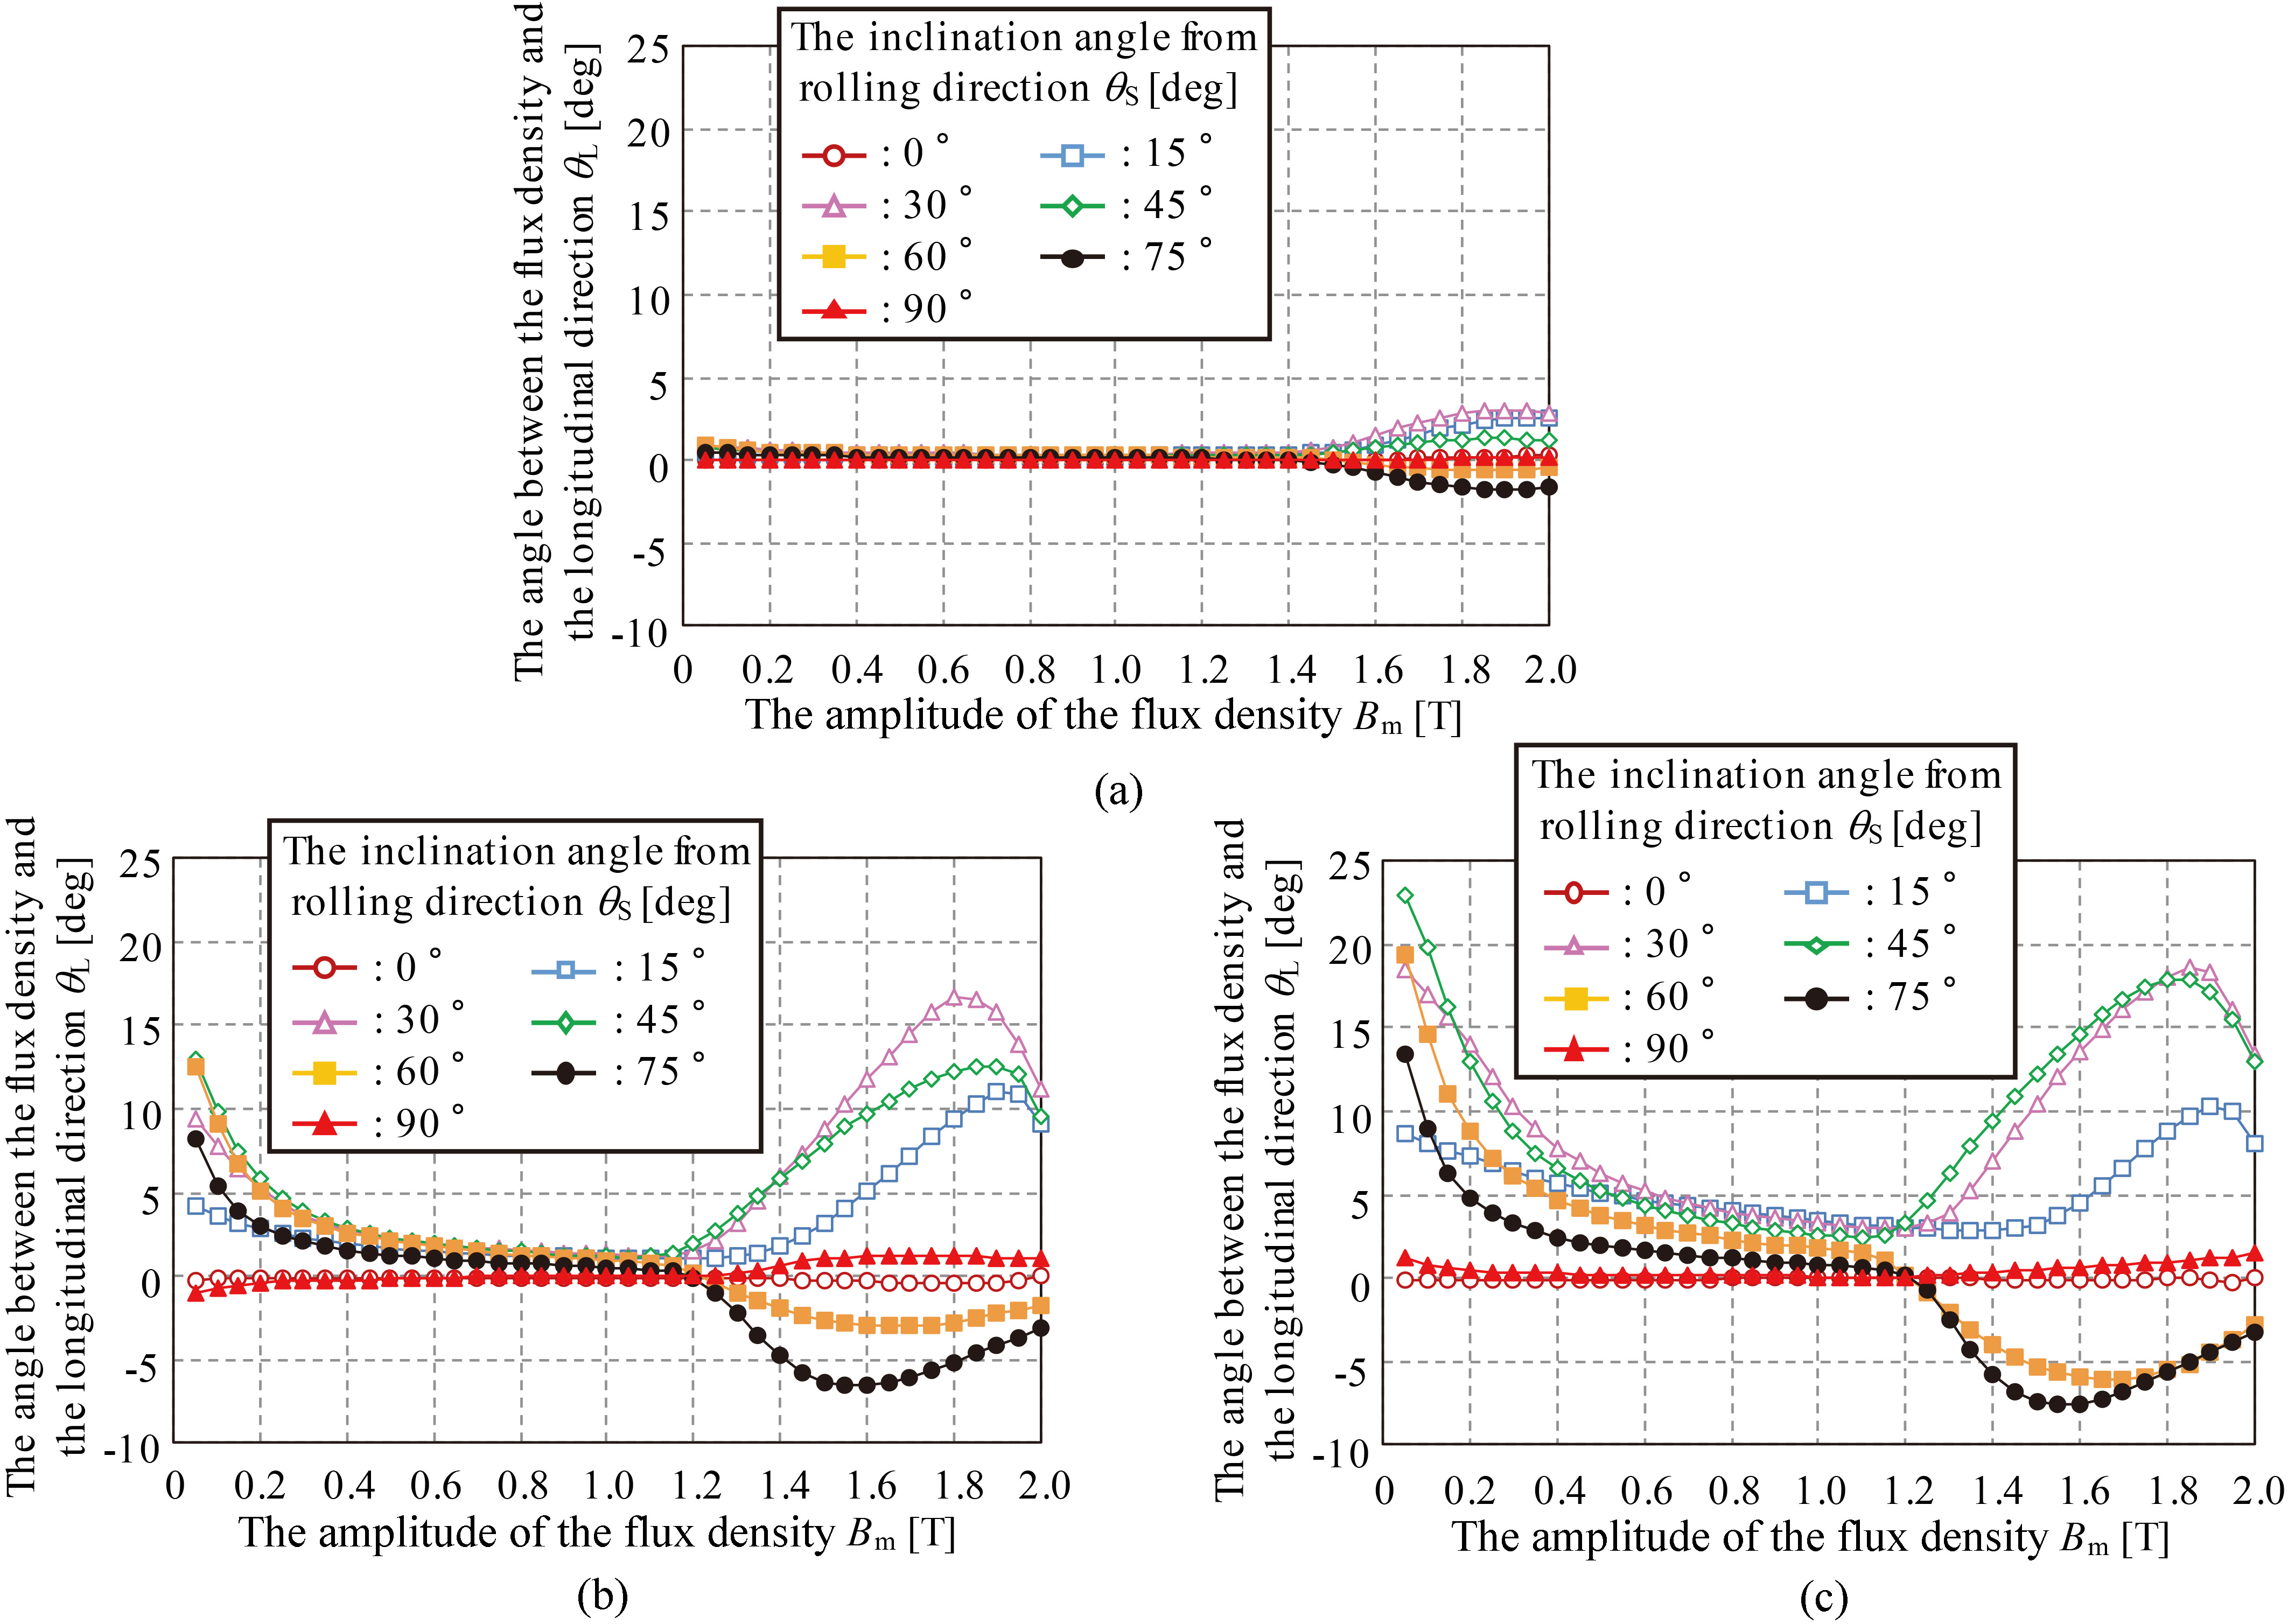
Figure 6 shows – properties of 50A470, 35G155 and 23P90 for each . When 0, B points toward the longitudinal direction. In the case of 50A470, B points toward the longitudinal direction approximately in all . On the other hand, in the case of 35G155 and 23P90, B does not point toward the longitudinal direction except at 0 and 90. Thus, 2-D magnetic properties of a grain-oriented electrical steel sheet cannot be measured by using the 1-D SST.
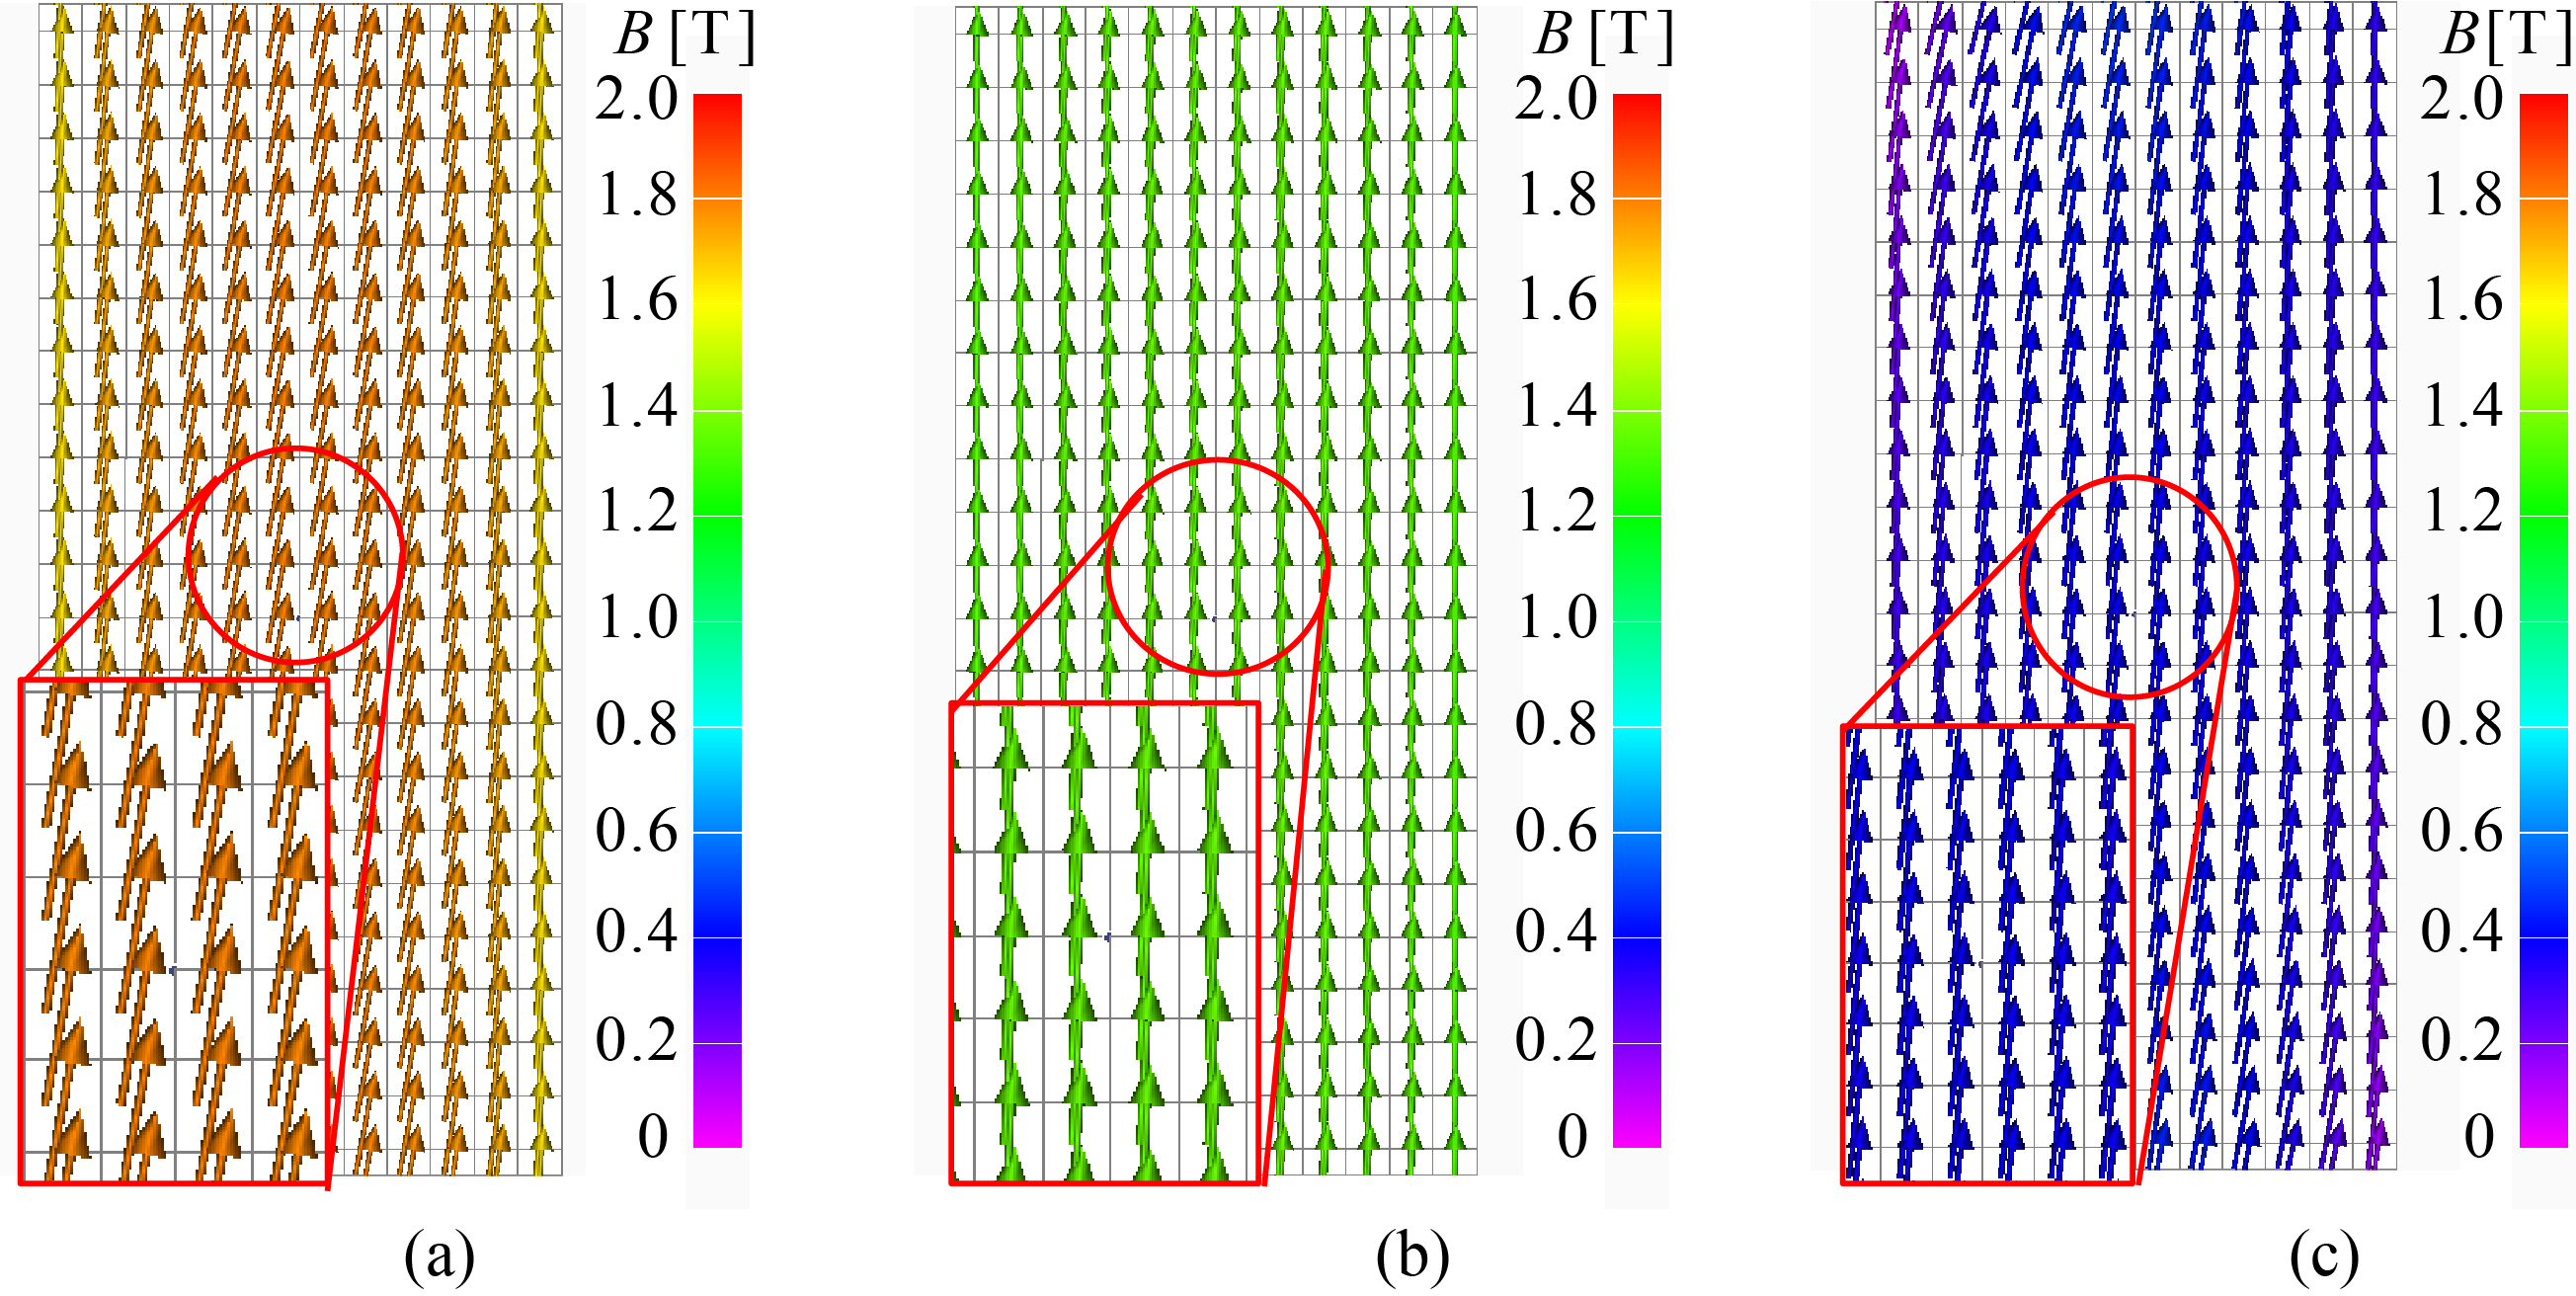
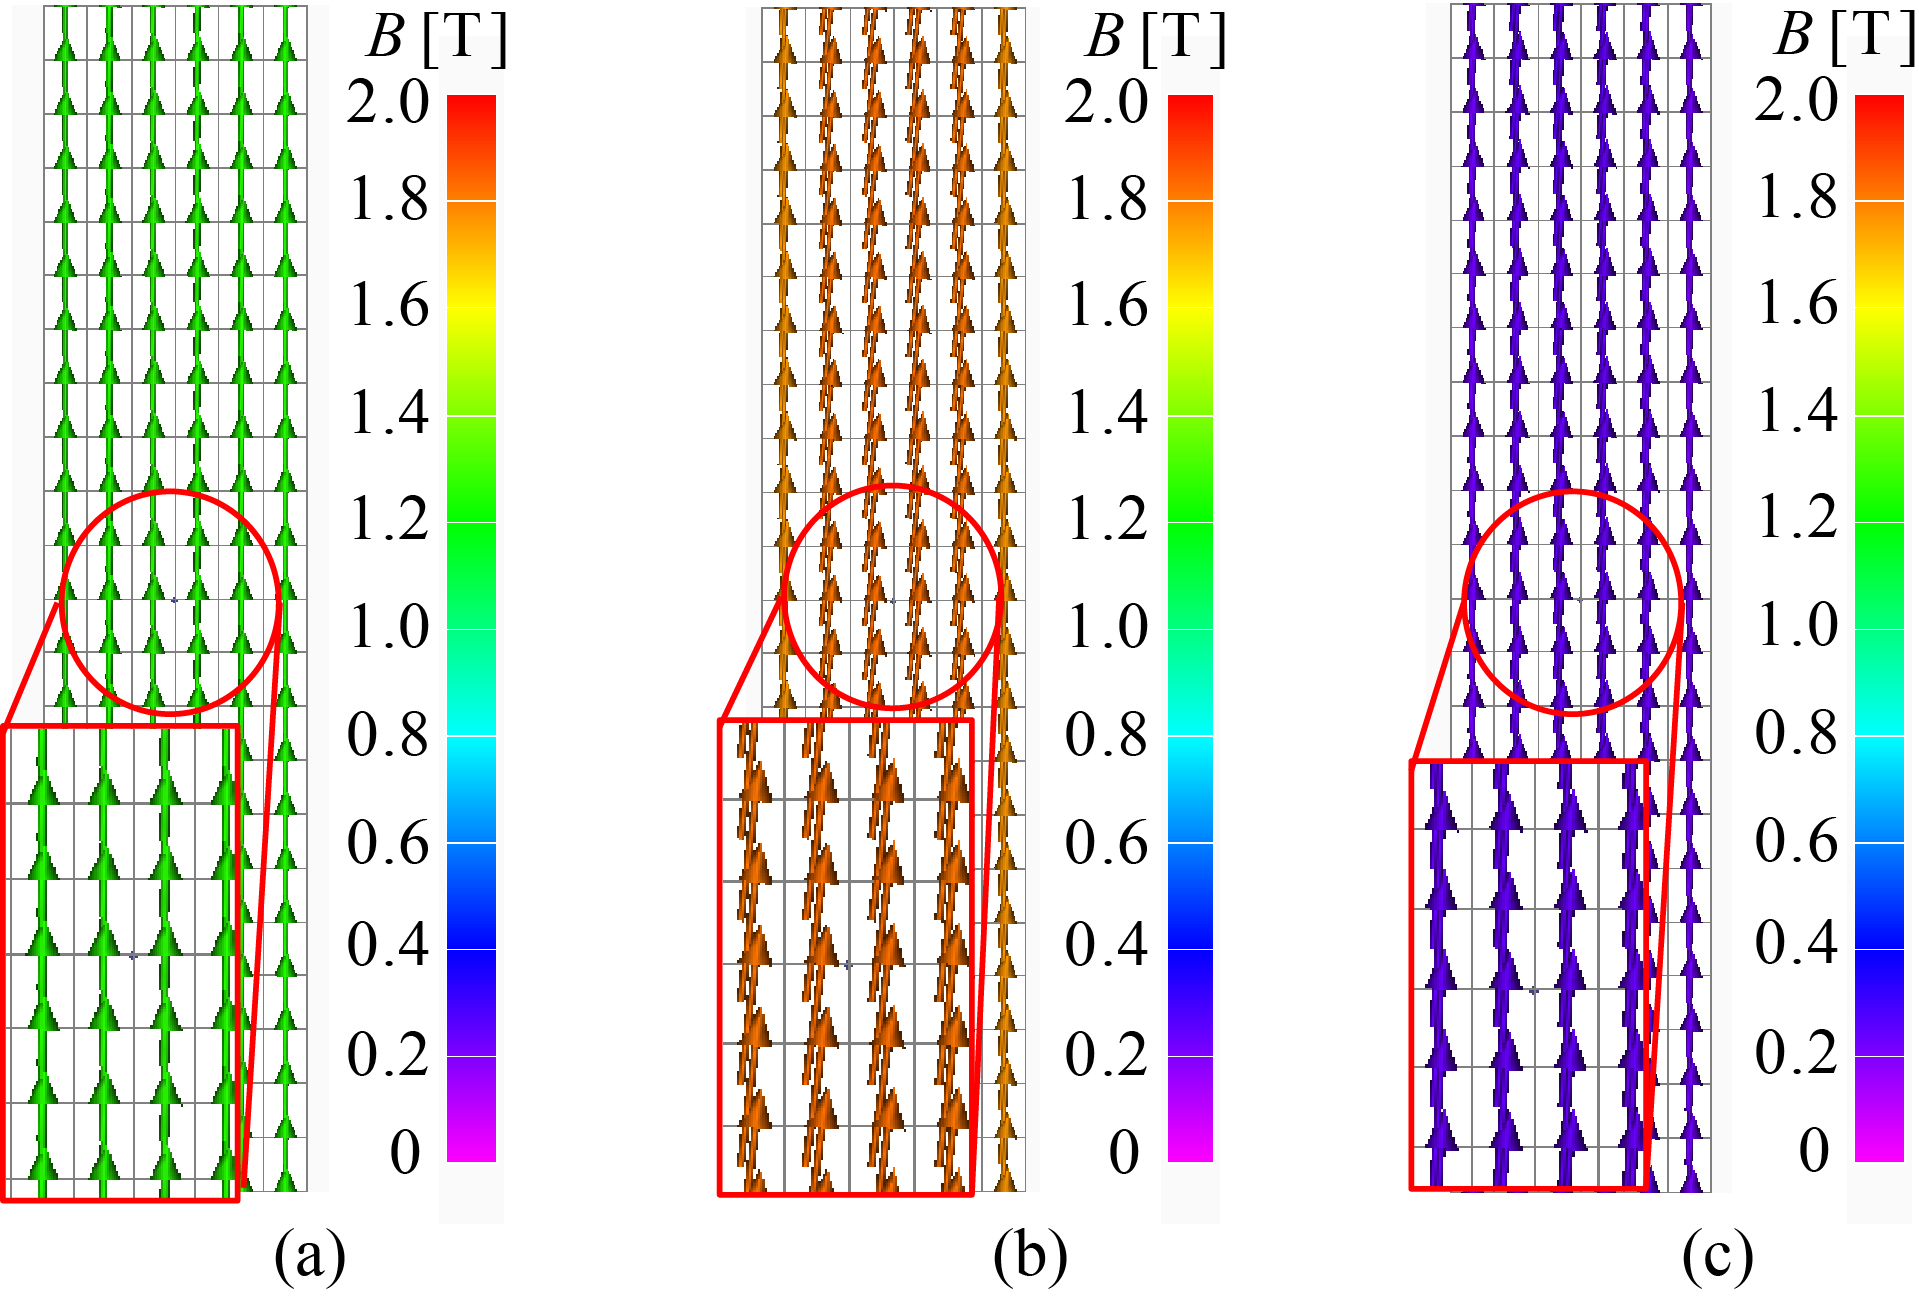
Flux density distribution in the specimen whose width is 60 mm (JIS: 23P90). (a) Small . (b) Middle . (c) Large .
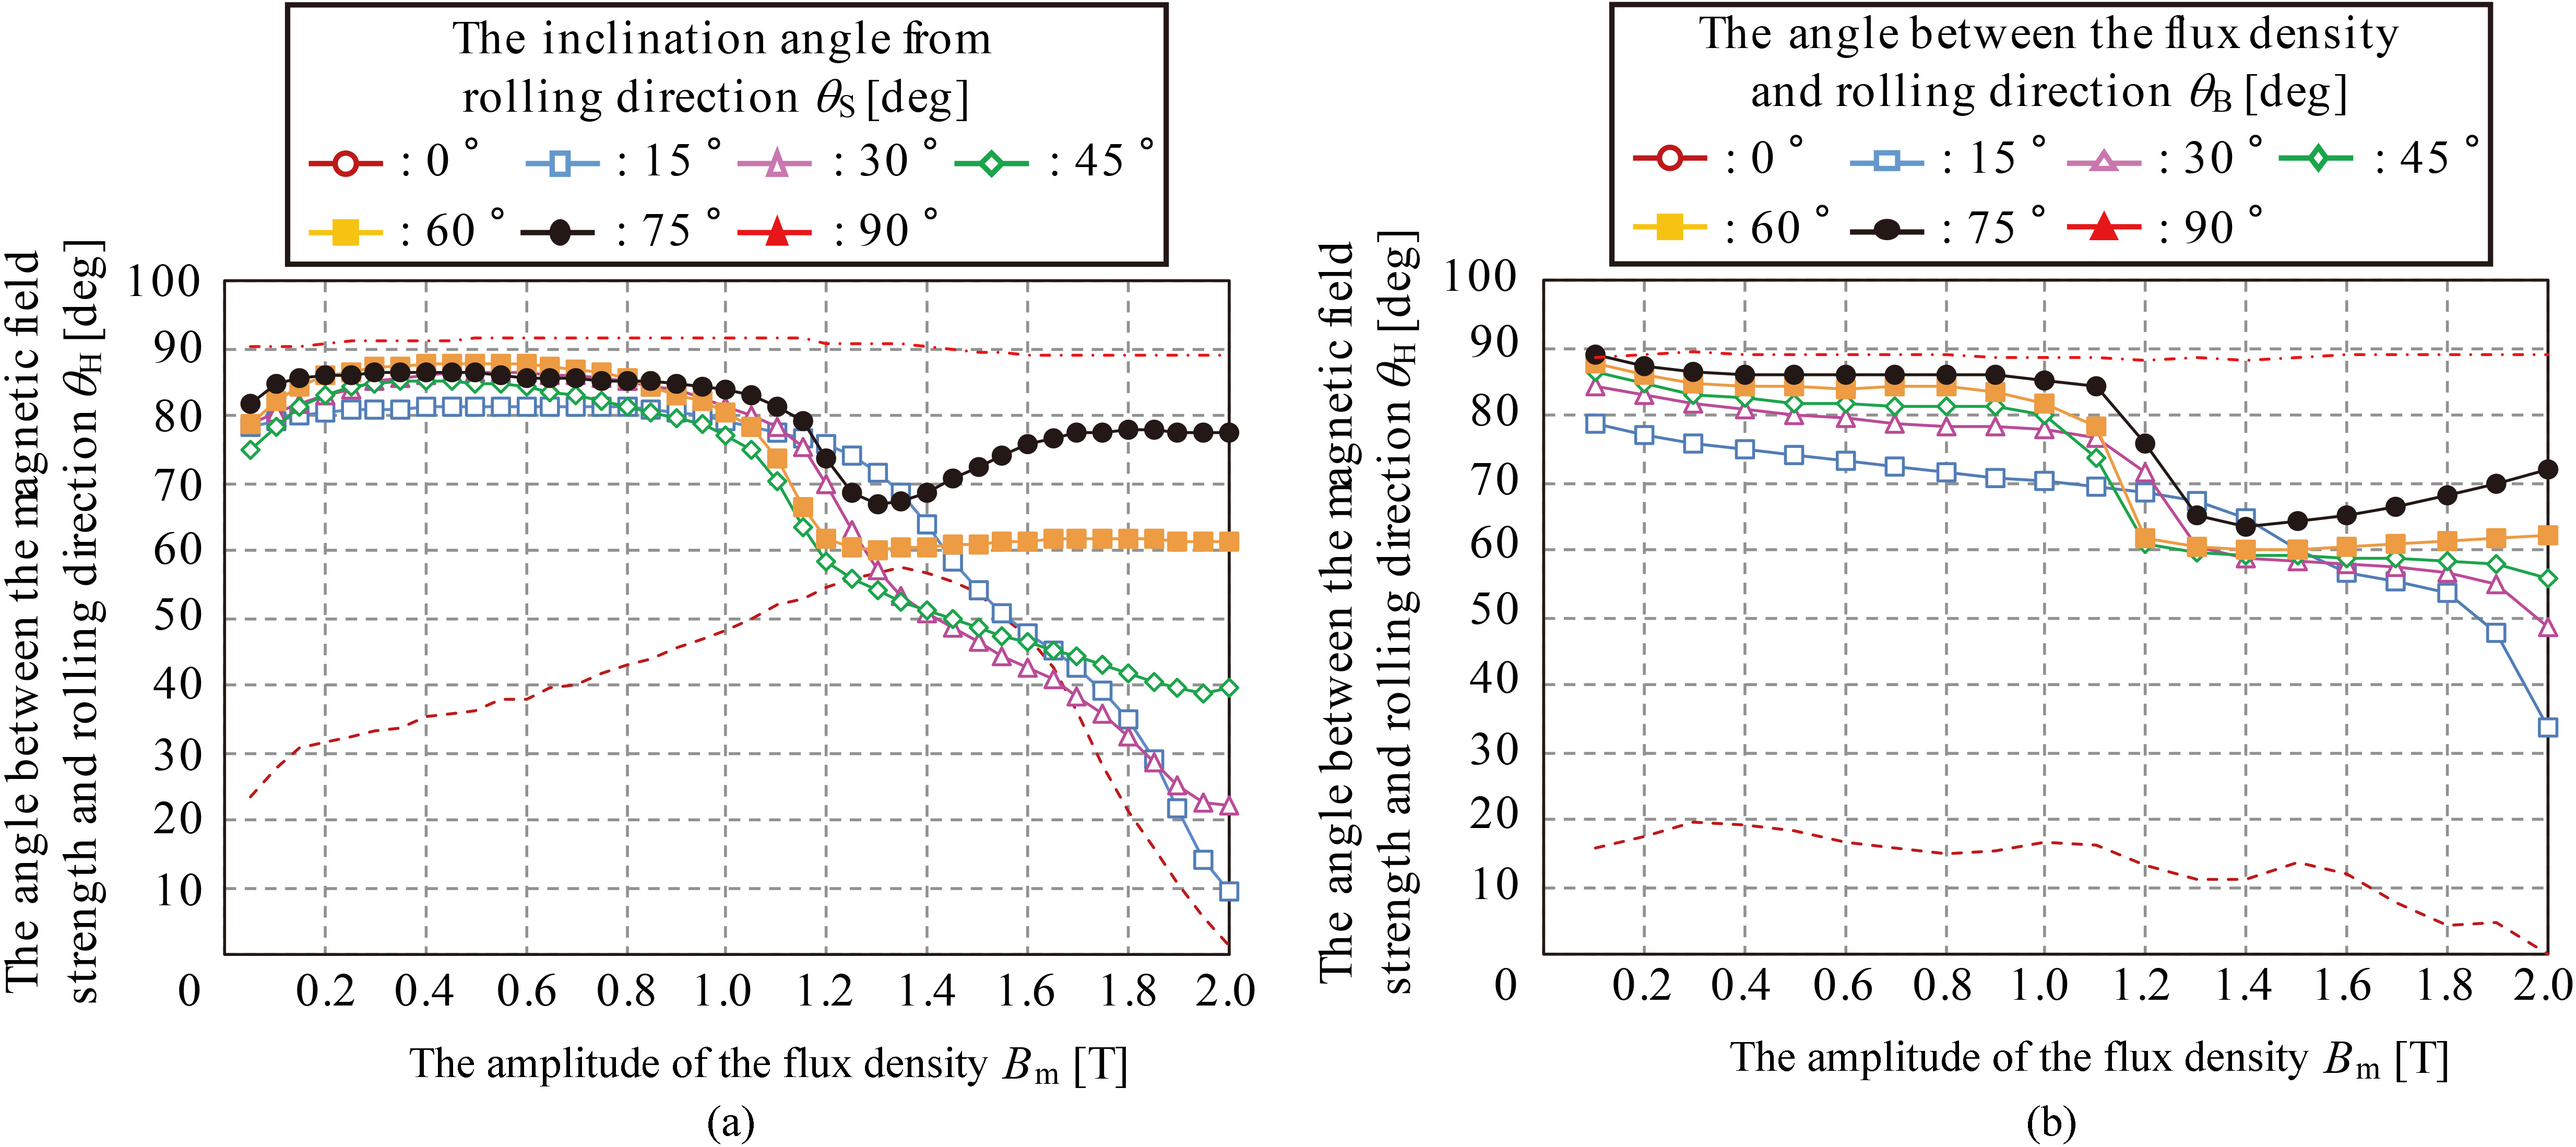
Then, Fig. 7 shows – properties of rectangular specimen (35G155) for each and – properties of circular specimen (35G155) for each . As shown in Fig. 6(b), B points toward the longitudinal direction in the 1-D SST from 0.6 T to 1.2 T, and is controlled from 0.6 T to 1.2 T. On the other hand, and are controlled simultaneously in the RRSST. Therefore, the results obtained by using the 1-D SST is compared with the RRSST from 0.6 T to 1.2 T. – properties of the 1-D SST is similar to the RRSST from 0.6 T to 1.2 T. It is confirmed that the direction of H in the 1-D SST can be evaluated by using a pair of cross H-coils shown in Fig. 4.
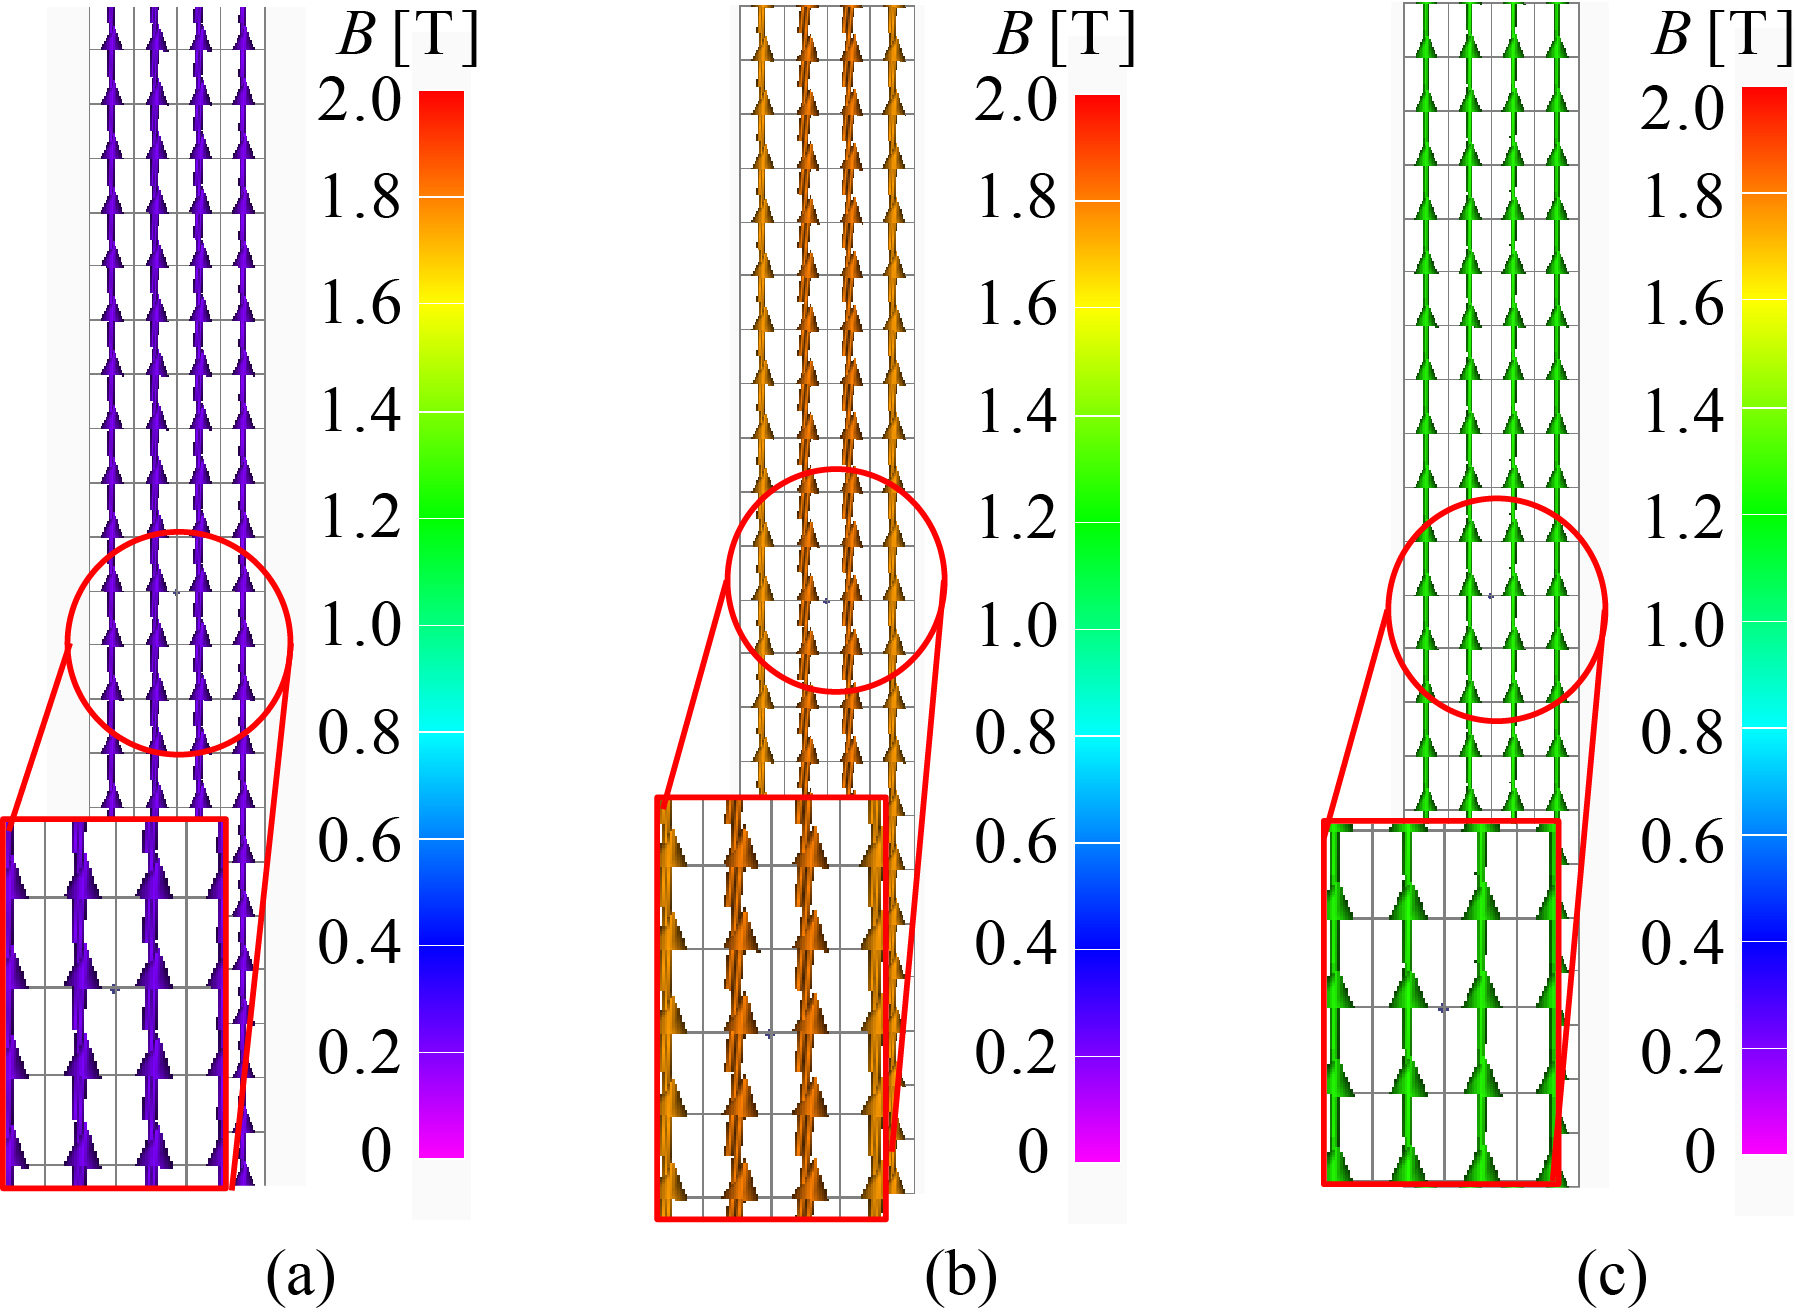
Flux density distribution in the specimen whose width is 30 mm (JIS: 23P90). (a) Small . (b) Middle . (c) Large .
Flux density distribution in the specimen whose width is 20 mm (JIS: 23P90). (a) Small . (b) Middle . (c) Large .
can be measured by a pair of cross B-coils, and can be measured by a pair of cross H-coils. However, in a grain-oriented electrical steel sheet, proper measurement value for an energy-based modelling method cannot be obtained by using the 1-D SST because and cannot be controlled simultaneously in the 1-D SST. Therefore, measurement value at 0 is needed in the 1-D SST.
Flux density distribution in rectangular specimen with the different widths
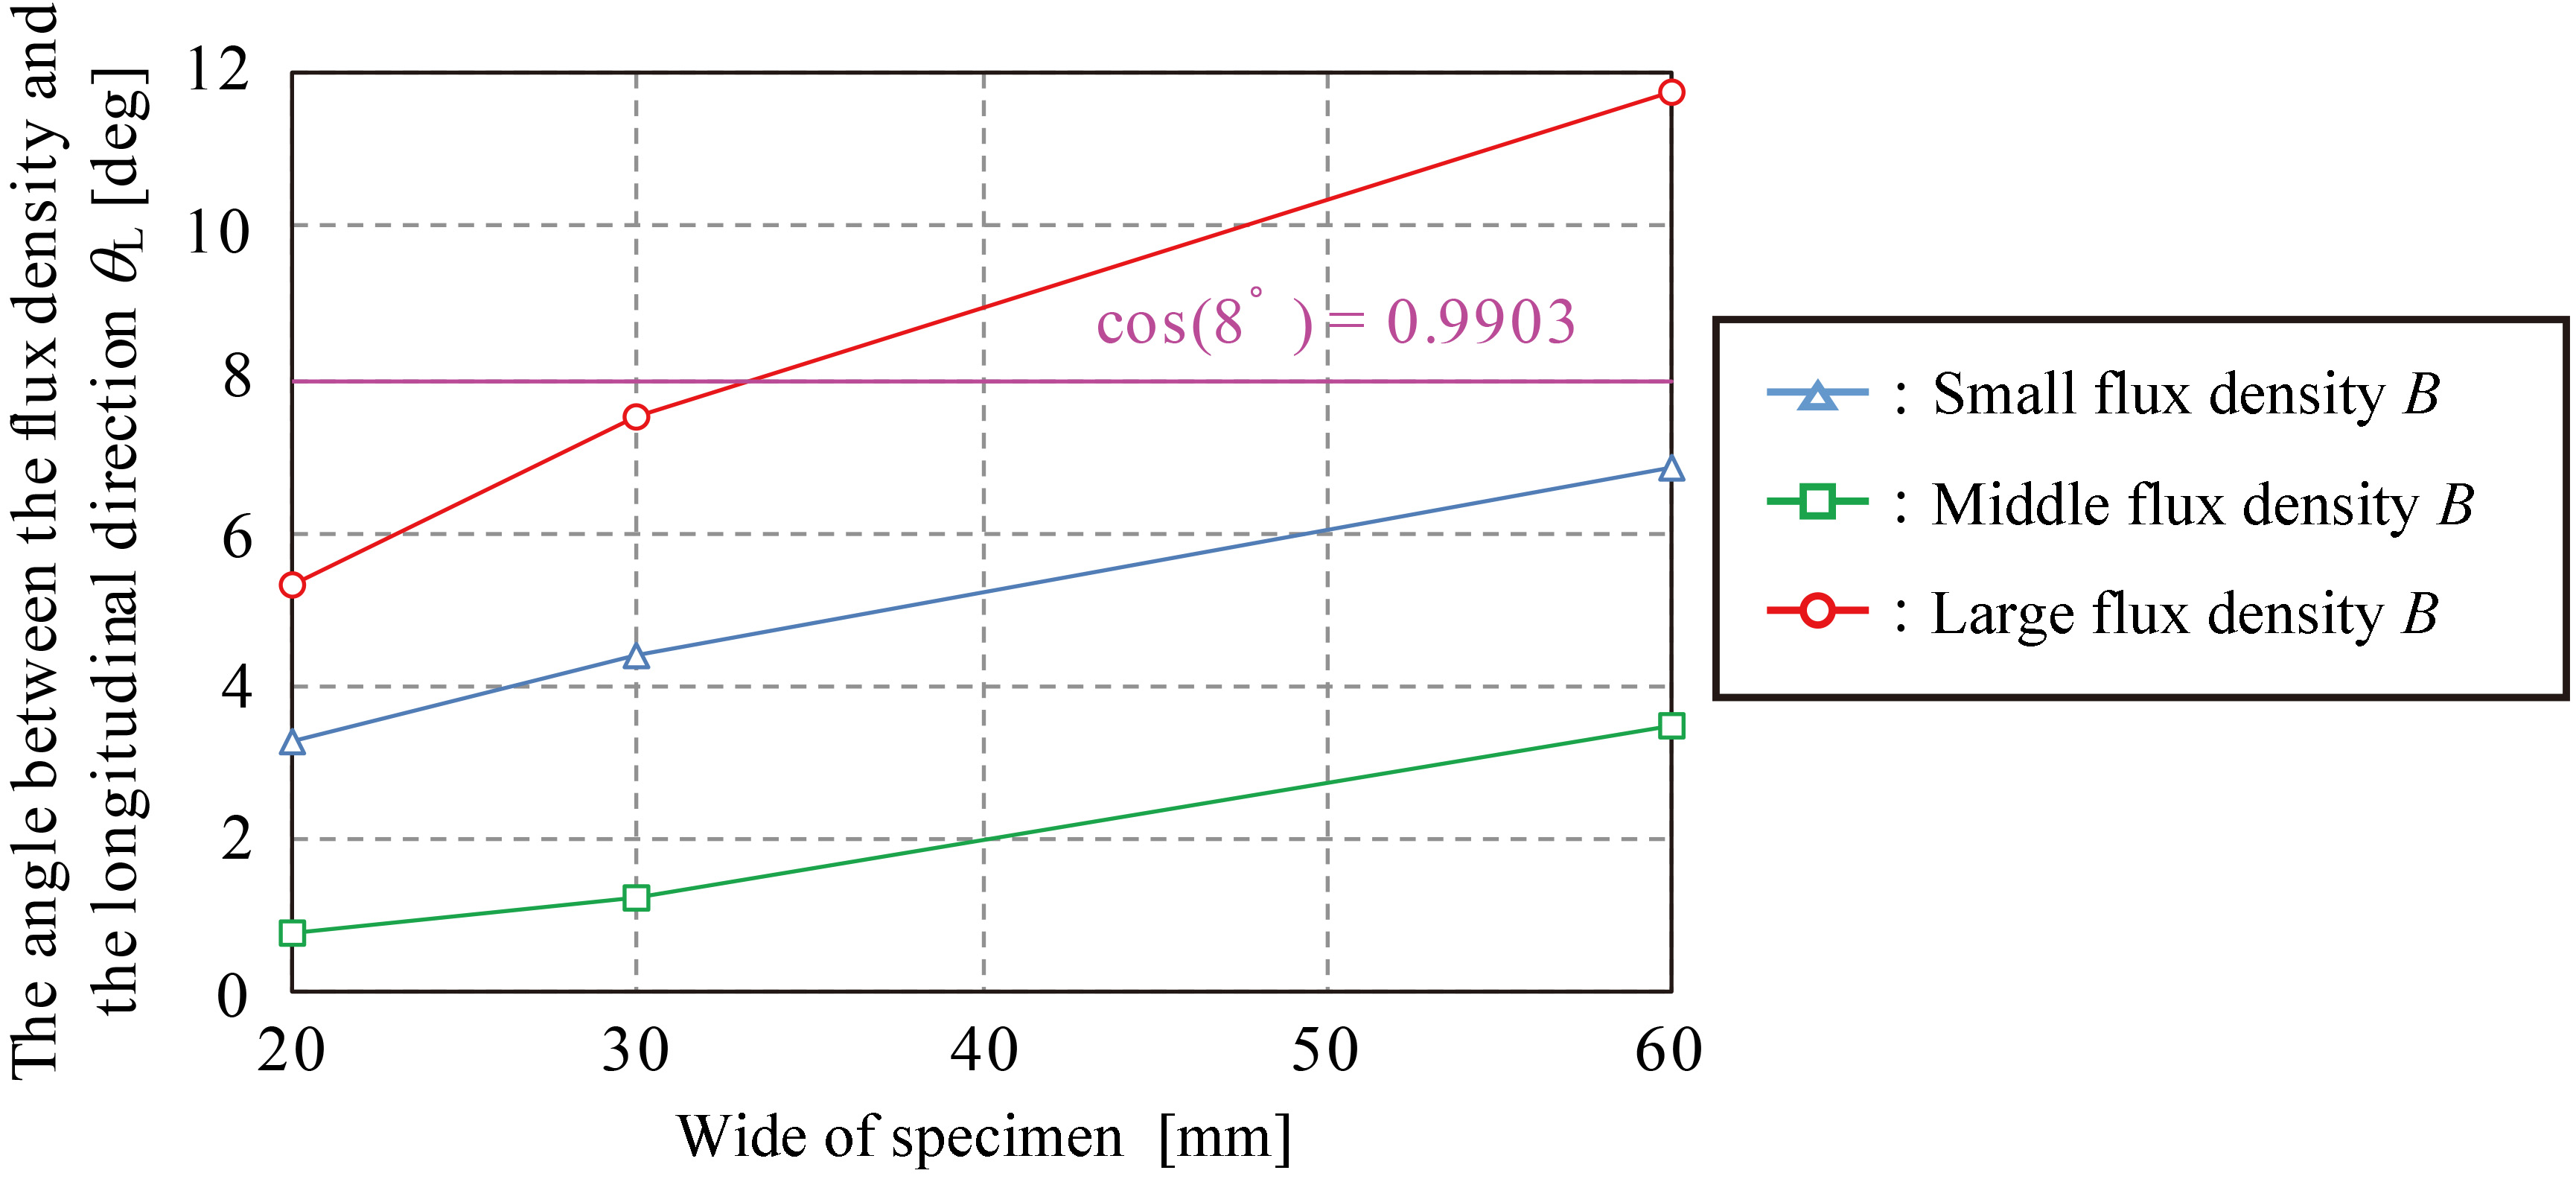
The distribution of B in the rectangular specimen with different widths is analyzed. The analyzed specimen is 23P90 whose is 30. Dimensions of analyzed specimens are 60 mm 360 mm, 30 mm 360 mm, and 20 mm 360 mm. Figure 8 shows the distribution of B in the specimen whose width is 60 mm. Figure 9 shows the distribution of B in the specimen whose width is 30 mm. Figure 10 shows the distribution of B in the specimen whose width is 20 mm. Figure 11 shows analyzed in the specimen with different widths. As shown in Figs 6 and 8, the analysis results are similar to measured results. Analysis results show that the B points toward the longitudinal direction as the specimen width becomes short. When the specimen width is 30 mm, is less than 8 and difference of is less than 1%.
obtained with different widths (JIS: 23P90).
This means that the difference between the amplitude of measured and target flux density waveform is at most 1% (cos(8) 0.9903). From the standpoint of the identification of energy-based modelling method for magnetic anisotropy, this difference is seem to be acceptable. Its verification based on detailed magnetic measurement of 30 mm-width specimens and its magnetic field analyses is our future work.
Conclusion
In a non-oriented electrical steel sheet, 2-D magnetic properties can be measured by using the 1-D SST because B points toward the longitudinal direction. However, in a grain-oriented electrical steel sheet, it cannot be measured properly because B does not point toward the longitudinal direction except at 0 and 90. can be measured by using a pair of cross H-coils because measured by using the 1-D SST is similar to the RRSST from 0.6 T to 1.2 T. Analysis results show that the direction of B in the specimen whose width is shorter than 60 mm is close to the longitudinal direction.
Accordingly, when a pair of cross H-coils is adopted to a specimen with appropriate aspect ratio, 2-D magnetic properties of grain-oriented electrical steel sheet can be measured by means of the 1-D SST. In future, the reason that the becomes larger in small and large B in 60 mm-width specimens is going to be investigated by measuring 30 mm-width specimens, and modelling the 2-D magnetic properties of 30 mm-width specimens is going to be also verified.
References
1.
HiguchiS.NakaoT.TakahashiY.TokumasuT.FujiwaraK. and IshiharaY., Modelling of two-dimensional magnetic properties based on one-dimensional magnetic measurements, IEEE Trans. Magn.48(11) (2012), 3486–3489.
2.
SilvesterP.P. and GuptaR.P., Effective computational models for anisotropic soft B-H curves, IEEE Trans. Magn.35(5) (1991), 3804–3967.
3.
PéraT.OssartF. and WaeckerleT., Numerical representation for anisotropic materials based on coenergy modelling, J.Appl. Phys.73 (1993), 6784–6786.
4.
NakaoM.NishimotoH.FujiwaraK. and TakahashiN., Improvements of single sheet tester for measurement of 2-D magnetic properties up to high flux density, IEEE Trans. Magn.35(5) (1999), 3965–3967.
5.
NakataT.KawaseY. and NakanoM., Improvement of measuring accuracy of magnetic field strength in single sheet testers by using two h coils, IEEE Trans. Magn.23(5) (1987), 2596–2598.
6.
MoriT.TakahashiY. and FujiwaraK., Comparison of rotational single sheet testers for evaluating 2-D magnetic properties of electrical steel sheet, International Journal of Applied Electromagnetics and Mechanics48(2, 3) (2015), 219–224.
7.
JesenikM.GoricanV.TrlepM.HamlerA. and StumbergerB., Field Homogeneity in a two-phase round rotational single sheet tester with one and both side shields, Journal of Magnetism and Magnetic Materials254–255 (2003), 247–249.