
Abstract
It is desirable that the waveform of induced voltage 𝜐b in the B-coil is substantially sinusoidal when magnetic properties of electrical steel sheets are measured. To realize a sinusoidal 𝜐b, the IEC standards specify that its form factor FF should be controlled within 1.11 ± 0.01. However, the condition is not sufficient because a non-sinusoidal waveform can also give FF = 1.11. Ideally, the distortion factor DF 𝜐b of 𝜐b should be equal to 0. Therefore, this paper discusses the influence of the DF 𝜐b on magnetic properties of electrical steel sheets measured with a single sheet tester. As a result, it is confirmed that the iron loss is directly proportional to the distortion factor of induced voltage in the B-coil. Therefore, the distortion factor should be specified relating accuracy of the iron loss measurements.
Introduction
To design highly efficient electrical machines, it is necessary to grasp physical phenomena in the machines in detail. A magnetic field analysis based on a finite element method is widely used as one of the powerful tools to comprehend physical phenomena in the machines. In the magnetic field analysis, magnetic properties of iron core materials should be prepared in advance. To perform the accurate magnetic field analysis, it is indispensable to acquire appropriate magnetic properties in a wide range of magnetic flux densities.
Generally, it is desirable that the waveform of induced voltage 𝜐b in the B-coil is substantially sinusoidal when magnetic properties of electrical steel sheets are measured. To get a sinusoidal 𝜐b, the IEC standards specify that its form factor FF should be controlled within 1.11 ± 0.01 [1,2]. However, the above condition is not sufficient because a non-sinusoidal waveform can give FF = 1.11. Ideally, the distortion factor DF 𝜐b of 𝜐b should be equal to 0. Therefore, this paper discusses the influence of the DF 𝜐b on magnetic properties of electrical steel sheets measured with a single sheet tester (SST).
Measurement method
Measuring system
Figure 1 shows the block diagram of the measuring system. Figure 2 shows the specifications of the SST used for a measurement. As a specimen, a grain-oriented electrical steel sheet M90-23P5 of which the length and the width is 360 mm and 60 mm, respectively, is selected.
The B-coil is wound directly on the specimen to reduce the influence of air-gap magnetic flux. A magnetic field strength h is measured with the double H-coils method [3]. Table 1 shows the specifications of the H-coils. The excitation frequency is set to 50 Hz. The maximum magnetic flux density B
m is set from 1.7 T to 1.9 T at intervals of 0.05 T. The specimen is degaussed before measuring magnetic properties at B
m = 1. 7 T. The measurements are performed in ascending order of B
m. As the convergence criterion of the waveform control, the form factor FF of 𝜐b and B
m are not used. Only the distortion factor DF
𝜐b_specified is adopted. DF
𝜐b_specified is changed from 0.1 to 1.0 at intervals of 0.1. The procedure of the magnetic measurement is as follows: Degauss the specimen. Start excitation with a sinusoidal voltage. Start the maximum value control to hold the fundamental component of magnetic flux density waveform close to the target value. Start the waveform control to hold 𝜐b sufficiently close to a sinusoidal waveform. Average the converged waveforms and save them. Change target B
m, and move to step (iii).
Here, the number of averaging in Step (v) is set to 244. The above procedure is continued without any suspensions until all the measurements under predetermined conditions are terminated.
Specificartions of H-coiols
Specificartions of H-coiols

Block diagram of measurement system.
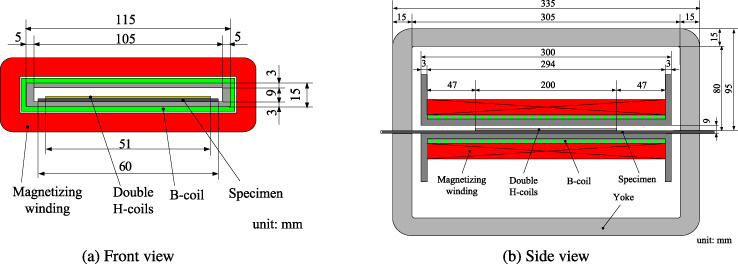
Single sheet tester.
The maximum value control is performed so that the fundamental component of a magnetic flux density waveform can get close to the target value. In the maximum value control, the output voltage 𝜐c in a D/A converter is changed by focusing the difference ϵB1 between the amplitude of the fundamental component B
1 and the target value B
1_goal. ϵB1 is given by
Table 2 shows the relationship between ϵB1 and Δ𝜐c. If ϵB1 is equal to or less than 1%, the maximum value control is terminated.
Amount of change of output voltage in D/A converter
The procedure of the maximum value control is as follows: Capture 𝜐b for 24 cycles with an A/D converter and average them at a controller (PC). If ϵB1 is more than 1%, the amplitude of 𝜐c is changed by predetermined Δ𝜐c and move to step (i). If ϵB1 is equal to or less than 1%, the maximum value control is terminated.
The waveform control is performed based on Eq. ((2)) to hold 𝜐b close to a sinusoidal waveform:
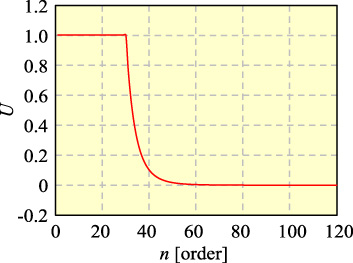
Filter coefficient U.
The waveform control is continued until DF
𝜐b is equal to or less than DF
𝜐b_ specified. DF
𝜐b is given by
The procedure of the waveform control is as follows: Capture 𝜐b for 24 cycles with an A/D converter and average them at a controller (PC). Correct 𝜐c based on Eq. ((2)). If DF
𝜐b is equal to or less than the convergence criterion DF
𝜐b_specified, the waveform control is termninated. If not, move to step (i).
Figure 4 shows the distortion factor DF 𝜐b of the induced voltage in B-coil at B m = 1. 8 T. Even when DF 𝜐b of the final waveform obtained from the waveform control is lower than the specified value DF 𝜐b_specified, the finally obtained DF 𝜐b can be larger than DF 𝜐b_specified in some cases. This is caused by the variation of 𝜐b during averaging it after the waveform control is completed. The output voltage supplied by the D/A converter can change during the averaging process. Figure 5 shows the distortion factor DF b of the magnetic flux density waveform at B m = 1. 8 T. When calculating magnetic flux density by integrating 𝜐b, the influence of harmonic components in 𝜐b becomes small. Therefore DF b is much smaller than DF 𝜐b. In addition, DF 𝜐b and DF 𝜐b_ specified have a positive correlation. When DF 𝜐b_specified is large, the difference between the measured magnetic flux density waveform and the target one becomes large. Namely, there is a possibility that a desired magnetic flux density waveform cannot be obtained.
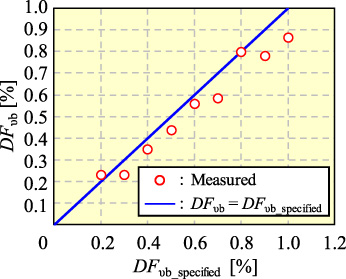
Distortion factor in induced voltage in B-coil.
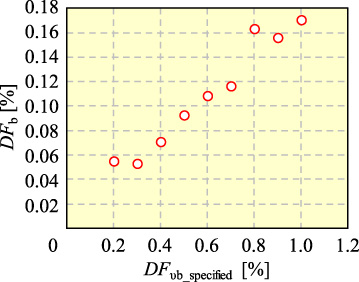
Distortion factor of magnetic flux density.
Figure 6 shows the difference ϵb between the measured and the target magnetic flux density waveforms at B
m = 1. 8 T when DF
𝜐b_ specified = 0. 2 and 1.0. Figure 7 shows the root mean square of the difference between the measured and target magnetic flux density waveforms. It is given by

Difference between measured and target magnetic flux density waveforms.
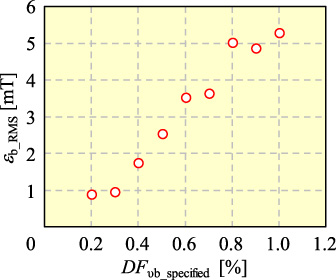
Root mean square of difference between measured and target magnetic flux density waveforms.
Figure 8 shows the distortion factor DF
h of the magnetic field strength waveform at B
m = 1. 8 T. Since the magnetic properties of electrical steel sheets have strong nonlinearity, the magnetic field strength waveform is not sinusoidal. Therefore, DF
h is much larger than DF
𝜐b. The form factor FF of induced voltage in B-coil and the deviation of FF from the form factor of a sinusoidal waveform are written as

Distortion factor of magnetic field strength.
Figure 9 shows the difference in form factors between the measured and target waveforms at B m = 1. 8 T. FF is directly proportional to the DF 𝜐b_specified. Figure 10 shows the difference ϵBm in the maximum magnetic flux density between the measured and the target waveforms at B m = 1. 8 T. The amplitude of the initial waveform of 𝜐c is less than the ideal value corresponding to the target B m in the maximum value control. While repeating the feedback in the waveform control, B m gradually approaches to the target. Therefore, ϵBm has a negative correlation with DF 𝜐b, and is less than 0.
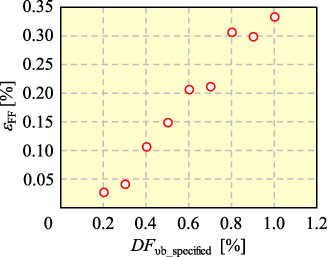
Difference in form factors between measured and target waveforms.

Difference in maximum magnetic flux density between measured and target waveforms.
Figure 11 shows the iron loss at B m = 1. 8 T. As the amplitude of higher harmonics of 𝜐b increases, the iron loss also increases. However, the iron loss is negatively proportional to DF 𝜐b_specified. If the iron loss is a function of the square of B m, it is considered that the difference of B m between the measured and target waveforms shown in Fig. 10 has an influence on the measurement accuracy of iron losses. Therefore, the iron loss at B m = 1. 8 T is interpolated utilizing a quadratic approximation obtained from the iron losses measured at from 1.7 T to 1.9 T at intervals of 0.05 T in each DF 𝜐b_ specified. For example, the iron loss at B m = 1. 8 T and DF 𝜐b_specified = 1. 0 is interpolated from the iron losses measured at from 1.7 T to 1.9 T at intervals of 0.05 T at DF 𝜐b_ specified = 1. 0. Figure 12 shows the iron loss at B m = 1. 8 T by utlizing the quadratic approximation. The estimated iron loss is directly proportional to DF 𝜐b_specified. The iron loss increases due to the harmonic components of b as DF 𝜐b_specified increases.
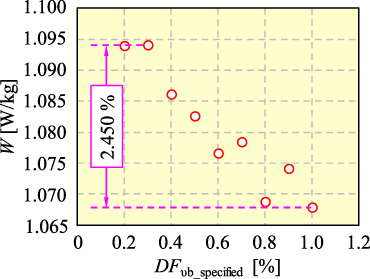
Iron loss (original data).
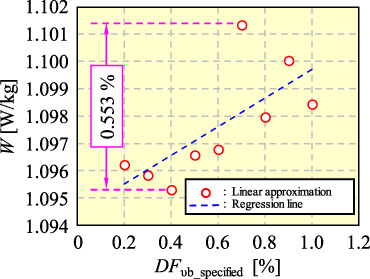
Iron loss estimated by using quadratic approximation.
Figures 13 and 14 show the coercivity H c and the residual magnetization B r, respectively. By assuming that H c and B r are directly proportional to B m, H c and B r at B m = 1. 8 T are calculated by the linear approximation of their measurement results from 1.7 T to 1.9 T at intervals of 0.05 T. For example, H c and B r at B m = 1. 8 T and DF 𝜐b_ specified = 1. 0 is calculated from 1.7 T to 1.9 T at intervals of 0.05 T at DF 𝜐b_ specified = 1. 0. Although H c is not strongly proportional to DF 𝜐b_specified as shown in Fig. 13, H c increases as harmonic components increase. B r is also increased by harmonic components. The area of a hysteresis loop increases due to the increase of H c and B r. Therefore, the iron loss increases as DF 𝜐b_specified increases as shown in Fig. 12.
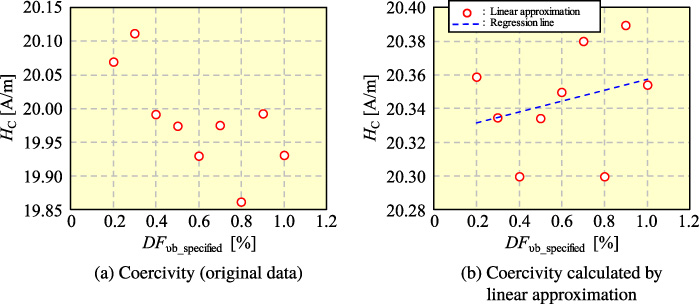
Coercivity.

Residual magnetization.
To achieve the further high accuracy of a magnetic measurement under a sinusoidal flux condition, we measured the magnetic properties using the distortion factor as the convergence criterion of the waveform control. In addition, the relationship between the distortion factor and the form factor, which is widely used as the convergence criterion, is revealed. The form factor of induced voltage in the B-coil is directly proportional to the distortion factor. If the difference in the distortion factor between the measured and the target magnetic flux density waveforms becomes large, there is a possibility that a desired magnetic flux density waveform cannot be obtained. The root mean square of this difference is directly proportional to the distortion factor of induced voltage in the B-coil. The distortion factor should be specified relating the accuracy of the iron loss measurements because the iron loss is directly proportional to the distortion factor of induced voltage in the B-coil. If the distortion factor is used as the convergence criterion, the appropriate reference value is desirable. To clarify the appropriate value, it is necessary to measure magnetic properties of various electrical steel sheets.