
Abstract
The UHV transmission lines usually have large regional spans and involve various weather conditions, which will have different effects on the circuit design and electromagnetic environment. However, the existing research lacks the ion flow field analysis of AC and DC parallel lines under different weather conditions. Hence, we studied the distribution law of the ion flow field of ±800 kV DC and 500 kV AC parallel transmission lines under different weather conditions, and compared the calculated results with measured results. First, we used the meshless method to model the ion flow field of AC and DC parallel lines in different weathers. Then, the influence of environmental factors on the ion flow field was analyzed. The effects of temperature, humidity and haze on the distribution of the ion flow field were obtained based on long-term monitoring and measurement. Results show that the ion flow field of the theoretical calculation results was basically in accord with the actual measurement. The ion flow field of parallel lines increases with the rise of temperature, first increases and then decreases with the rise of humidity, and increases with the rise of haze.
Introduction
With the development of society and the continuous construction of UHV transmission lines, more and more transmission lines are putting into operation, and the parallel operation of AC and DC lines is becoming more and more common [1,2]. Compared to separate AC or DC line, the electromagnetic environment under the AC-DC parallel transmission lines is more complicated. The main factors affecting the electromagnetic environment distribution of high-voltage AC-DC transmission lines are the potential gradient of conductor surface, corona onset gradient, environmental weather conditions and the environmental electric field generated by space charge [3]. Wire surface voltage gradient is related to line operating voltage and wire geometry; the initial corona voltage gradient depends on the diameter of the sub-wire and the surface roughness of the conductor, wherein the surface roughness factor of the conductor is a function of the surface deposition of the conductor produced by atmospheric pollution or precipitation (rain, snow, etc.); Among the atmospheric variables, the influence of the lateral wind perpendicular to the line is most significant, especially its influence on the distribution of ground ion current.
In view of the increasing trend of UHV transmission lines, how to determine the electromagnetic environment under transmission lines is an important challenge. At present, the electromagnetic environment of transmission lines is usually obtained by numerical calculation. Literature [4–6] analyzed the impact of AC transmission lines on the hybrid electric field of parallel lines by using finite element method, and verified the calculation results of the model by using a simplified model, it was concluded that the voltage grade, height and parallel spacing of AC transmission lines would affect the ground hybrid electric field. Literature [7] calculated ac-dc hybrid electric field based on upstream finite element method and backward Euler method, and considered the influence of AC line voltage change on corona activity and space charge movement of DC wire in the calculation process, the results show that the DC component and ion current density of ion flow field are reduced by the presence of AC line. In literature [8], the regional decomposition method was applied to solve the hybrid electric field of ac-dc same-tower line. This method applied the 1st and 2nd order finite element solutions to several subdomains of the solution domain respectively, achieving high efficiency and accurate solution. Literature [9] using meshless method has carried on the precise calculation to ion flow field of DC line, by comparing analytical solution, finite element method and measurement data, to verify the accuracy of the results. As an effective alternative method of finite element method, this method can solve complex domain equations according to adaptive nodes, and improve the efficiency and accuracy of calculation under complex models. The above research uses different methods to analyze the electric field calculation of AC or DC transmission lines under different conditions. However, due to the coupling effect between parallel lines, AC and DC lines will induce DC and AC field components respectively, so that the electromagnetic environment below the lines is different from the separate DC or AC line, and the influence of environmental factors on the electromagnetic environment should also be considered.
According to the research on the electromagnetic environment of transmission lines under different weather conditions, literature [10] calculated the composite electric field intensity of DC lines under different haze pollution levels, and concluded that the ground electric field intensity increased with the increase of haze pollution degree. Literature [11] analyzed the corona cage and pulse current method and found that the corona discharge of AC transmission lines increased with the increase of fog conductivity. Literature [12] analyzed the variation of corona voltage of DC wire with relative humidity through measured data, and concluded that with the rise of humidity, the corona voltage first increased and then decreased before and after saturated damp. At present, few literatures systematically study the electromagnetic environment of AC/DC parallel transmission lines under different weather conditions.
In this paper, based on the meshless method, the transmission corridor of ±800 kV DC line and double-circuit 500 kV AC line is modeled and calculated, and the effects of temperature, humidity, and haze conditions on the ion flow field of parallel lines are considered. Meanwhile, long-term monitoring and measurement of the electromagnetic environment in the area of this line under different weather conditions are carried out. By comparing and analyzing the calculation and measurement results, the influence of different weather conditions on the ion flow field can be obtained. This study is of great significance for the follow-up guidance of related engineering construction and human safety protection.
Computational model of ion flow field under AC and DC parallel lines
Governing equations
Compared with the DC transmission line, when the AC/DC transmission line is erected in parallel, its spatial electric field is transformed into a time domain problem, and a time variable is added to the governing equations. The governing equations for the ion flow field are described by the Poisson equation and the charge conservation equation as follows:
Where, φ is the space potential, V; 𝜌+ and 𝜌− are charge density of positive and negative charges, C/m3; t is time, s; R is the positive and negative ion composite coefficient, m3/s; K + and K − are the positive and negative ion mobility, m2/V∙s; E is the total electric field, V/m.
The interaction between AC and DC lines makes the electromagnetic environment problem in the parallel line space more complicated than the simple AC line or DC line. It is hard to calculate directly. To solve the above equations, the following assumptions are made on the calculation model: Ignore the space charge generated by the AC wire: due to the large parallel spacing of the actual lines in the AC-DC parallel line, it is considered that the ions generated by the AC line corona are still bound around the AC line; The intensity of the corona field will not change after the corona starts: since the charge generated by the corona discharge of ac line is not considered, it is assumed that after the corona starts: Positive and negative ion mobility is constant during motion: the diffusion of positive and negative charges is smaller than the movement of ions under the action of an electric field; A multi-split conductor is equivalent to a single conductor of radius r.
In order to solve the above governing equations of the AC-DC parallel line, the main boundary conditions are as follows: The DC conductor potential is the DC operating voltage U = ±800 kV, and the AC conductor phase voltage is 500 kV. To improve the calculation efficiency and accuracy, the artificial boundary is introduced, assuming that the charge at the artificial boundary has decayed to zero, and its size is a sector with the DC wire as the center and a radius of 5 times the height of the DC wire, the voltage at the artificial boundary is the nominal voltage.
The geometric model of the ion flow field of AC/DC parallel transmission lines is shown in Fig. 1.
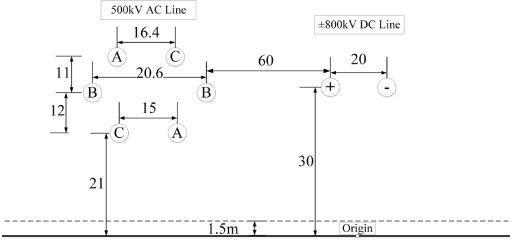
The parameters of AC and DC parallel transmission lines.
The line layout and geometric parameters are shown in Table 1.
The parameters of the transmission lines
Compared with the well-known finite element method, the difference of the meshless method is mainly reflected in the mesh generation stage and the structure of the shape function. As shown in Fig. 2, the subsequent steps are basically similar. The meshless method uses a set of nodes scattered in the problem domain and on the boundary to represent the problem domain and boundary; At the same time, compared with the finite element method, which uses predefined elements to construct the same shape function, the meshless method is based on the local node shape function, whose shape function can vary with the node location.
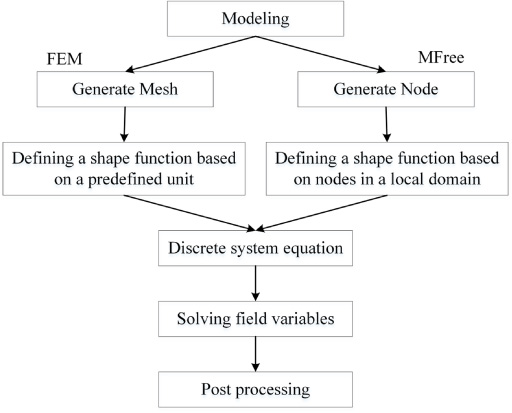
Calculation process of meshless method and finite element method.
Effect of temperature
The influence of temperature and humidity on the ion flow field of parallel transmission lines mainly includes the change of the corona onset gradient and the change of the spatial ion mobility. The corona onset gradient can be calculated by the Peek formula:
Relationship between wire temperature, corona onset gradient, ion mobility and ambient temperature
A large number of measurements and studies show that: when the relative humidity is between 30% and 70%, the corona onset gradient of DC wire increases slowly with the increase of the relative humidity, which is because the adsorption effect of water molecules on free electrons restricts the formation of electron collapse. At this time, the corona onset gradient of the circuit is expressed by the following formula:
Literature [17] obtained the spatial charge ion mobility under different relative humidity conditions through experiments and theories. When the humidity is 50%, the ion mobility is K, and in other humidity, the ion mobility is K
RH
, then:
The effects of suspended droplets and PM2.5 particles in the haze on parallel lines mixed ion flow field are mainly divided into the following three aspects: Charged particles affect the surrounding electric field and change the space charge density. The total charge density is the sum of the spatial ion density, the charged droplet density, and the charged PM2.5 particle density [10]. In haze weather, fog droplets tend to form condensation on the surface of wires. Meanwhile, PM2.5 particles in space attach to the surface of wires, affecting the roughness of the surface of wires. At this time, the wire’s corona onset gradient is expressed as follows: The ion mobility of the environment was changed, and the ion mobility in haze weather became 0.991 times that in normal weather [18].
Data classification
Based on the continuous monitoring data of a 500 kV double-loop AC transmission line and ±800 kV DC line for 6 months, the ion flow field on the ground under different weather conditions is compared and analyzed. The main monitoring data include: ion flow field and weather conditions (temperature and humidity, wind, haze, rainfall, etc.).
Due to different weather conditions and the rapid changes in parameters such as temperature, humidity and wind, it is difficult to maintain complete unification of non-variables. In order to reduce the difficulty of variable control, the irrelevant variables are controlled in a small range in this paper to study the effect of independent variables on the ion flow field. For example, when the study variable is temperature, select the environment as humidity 45%–55%, no wind, no haze, no rainfall data, The temperature data were divided into four sections of −2 to 2°C, 8 to 12°C, 18 to 22°C, and 23 to 25°C, and the average data of each stage was obtained after averaging. The data classification statistics are shown in Table 3.
This paper focuses on the influence of temperature, humidity and haze on the hybrid electric field of parallel lines, wind and rainfall also have a great influence on the hybrid electric field [2,19], which will be derived in the next study.
Statistical methods of weather parameters data classification
Statistical methods of weather parameters data classification
In order to obtain the influence of different temperature and humidity and haze on the mixed ion flow field, the measurement data was classified and analyzed, and compared with the calculation results. By analyzing the corresponding ion flow field distribution, comprehensive measurement results and calculation results, the distribution law of the ion flow field at different temperature and humidity were obtained.
Ion flow field at different temperatures
The calculation results of the ion flow field at ambient temperature of 0°C, 10°C, 20°C, and 25°C are shown in Fig. 3.
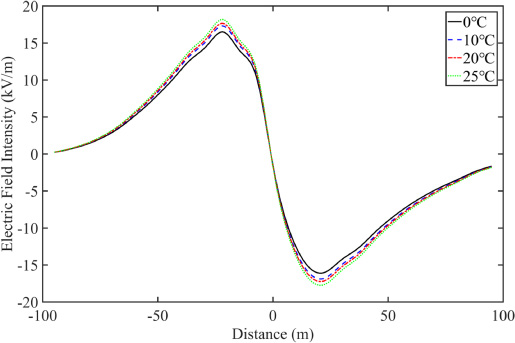
Hybrid electric field intensity in different temperature conditions.
The calculated values and measured values of ground ion flow field strength at different temperatures are shown in Table 4.
The value and growth rate of hybrid electric field intensity in different temperature
The results in Table 4 show that when the relative humidity is 50%, the higher the temperature, the larger the ion flow field on the ground. At a temperature of 25°C, the maximum value of the ion flow field is 18.1 kV/m, which increases by 12.8% when the temperature is 0°C. This shows as the temperature increases, the corona onset gradient of the wire surface decreases, the corona discharge degree increases, and the ion flow field on the ground increases. The reduction in ion mobility has a relatively small effect on the ground electric field.
It can be seen from the measurement results that, as the temperature rises, the ion flow field of ac-dc parallel lines showed an overall upward trend, and the measured values were all smaller than the calculated values. Because in theoretical calculation, the ion flow field is calculated at different temperatures when the relative humidity is 50%, while in the actual situation, humidity changes with temperature, resulting in different theoretical calculation and the actual measurement. Ion flow field at different humidity
When the ambient temperature is 20° and the relative humidity is 30%, 50% and 80% respectively, the ion flow field is shown in Fig. 4.
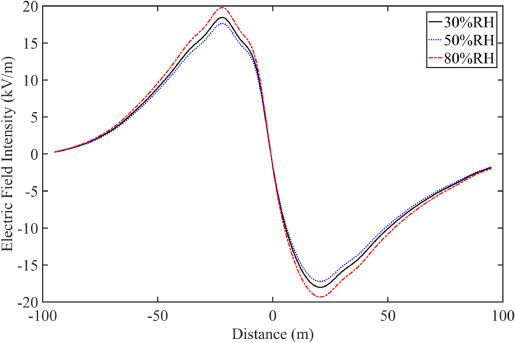
Hybrid electric field intensity in different humidity conditions.
The calculated and measured values of the ground ion flow field under different humidity conditions are shown in Table 5.
The value and growth rate of hybrid electric field intensity in different humidity
It can be seen from the above table that in the process of increasing the relative humidity from 30% to 80%, the ground ion flow field first decreases and then increases, and the measured value is consistent with the calculated value trend. The analysis shows that when the relative humidity is from 30% to 50%, the ion flow field decreases. The main reason is that the adsorption of free electrons by water molecules in the air is enhanced, the corona discharge is reduced, and the ion flow field in space and ground is reduced.
When the relative humidity is greater than 70%, the water molecules in the air begin to condense on the surface of the wire, thereby reducing the corona onset gradient of the wire, the ion flow field is about 10% larger than the normal weather; When the relative humidity is increased from 50% to 80%, the effect of condensation on the surface of the wire on the corona onset gradient is greater than the increase in humidity. The surface strength of the wire is reduced overall, the corona discharge is enhanced, and the ground ion flow field and ion current density are increased. At the same time, the ground ion flow field is mainly affected by corona discharge, relatively less affected by ion mobility. In the construction of transmission lines, special attention should be paid to areas with high humidity. Ion flow field at different haze conditions
In order to confirm the distribution law of the field test data, discuss the distribution of ion flow field under normal weather, moderate haze, and severe haze weather, set the droplets and PM2.5 parameters under different pollution levels as shown in Table 6.
Parameter selection of different pollution levels
The ion flow field distribution under different fog and haze weather conditions is obtained by introducing the parameters into the model calculation.
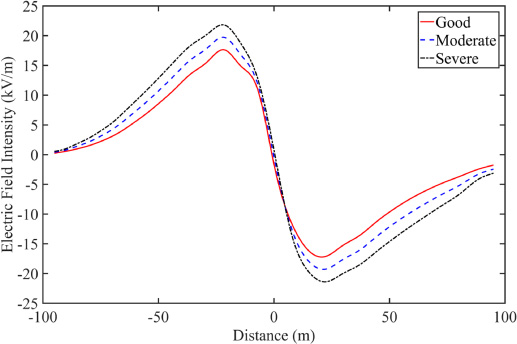
Hybrid electric field intensity in different haze conditions.
Calculation and experimental results of ion flow field under different haze conditions
In AC/DC parallel transmission lines, the distribution trend of ground ion flow field under fog and haze is basically the same as that without fog and haze, and the calculated value is consistent with the measured value. With the increase of fog and haze, the intensity of ion flow field increases gradually. The ion flow field under severe haze is about 20% higher than that under normal weather, and the ion flow field under moderate haze is about 10% higher than that under normal weather. The maximum value is about 10 meters outside the ground projection of the positive and negative DC conductors, and can reach 18 kV/m under heavy haze. Therefore, compared with temperature and humidity, haze has the greatest impact on the hybrid electric field. In view of the current situation of haze in northern China, special attention should be paid to the influence of haze weather on electromagnetic environment in transmission line construction.
In this paper, the hybrid electric field of a ±800 kV DC and double-circuit 500 kV AC parallel line were modeled and calculated under different weather conditions, and the ion flow field of parallel lines under different temperature, humidity and haze conditions were analyzed. Finally, the calculation results were compared with the actual measured data, the comprehensive error is 12.2%. On the basis of those facts, the following conclusions may be drawn:
When only considering the temperature change (relative humidity 50%), the higher the temperature, the larger the ground hybrid electric field. Compared with the ion flow field at 0°C, the maximum value of the ion flow field at 25°C increased by 1.86 kV/m, an increase of 12.8%. As temperature rise, the corona onset gradient of the wire decreases, resulting in an increase in corona strength and an increase in ground hybrid electric field and ion current density. When the relative humidity is greater than 70%, the water molecules in the air begin to condense on the surface of the wire, and the corona onset gradient decreases; When the relative humidity increases from 30% to 80%, the ground ion flow field first decreases and then increases; When the humidity changes, the ion flow field is mainly affected by the corona discharge, while the ion mobility has a relatively small effect. Compared to normal weather, the distribution trend of ion flow field in haze weather is the same. With the aggravation of haze, the ion flow field intensity gradually increases, and its maximum value appears around 10m outside the ground projection of DC positive and negative wires.
Footnotes
Acknowledgements
This work was supported by Science and Technology Project of STATE GRID Corporation of China (Study on electromagnetic environment monitoring and evaluation in the parallel operation of the ±800 kV HVDC line and AC line) and Chongqing Postdoctoral Research Project (Xm2017195).