
Abstract
This paper examines with statistical analysis of transient response for typical vehicle mounted antenna - monopole on conductive plane varying multiple random field parameter distributions of high-altitude electromagnetic pulse (HEMP) by employing the combinations of Method of Moment (MoM) method and a high computational efficiency statistical analysis tool called polynomial chaos expansion method (PCEM).The main procedures of the combination method are composed of two following steps: Firstly, the frequency-domain transfer function of the antenna port response for the monopole is derived by using MoM and then the transient current response is obtained with inverse Fourier transform; Secondly, the statistical model with multiple random input parameters are calculated by PCEM according to the transient response data. The statistical indicators of the model concentrate on the confidence interval of the transient response, the Probability Density Function (PDF) and Cumulative Probability Density Function (CDF) of the current peak. The paper not only focuses on the random radiated field parameter such as elevation, azimuthal angle, polarization angle and magnetic dip angle but also considers height of burst, ratios of plane length versus antenna height, and antenna down-tilt angles. The analysis results demonstrate the validation of the proposed statistical method and provide the reference base for system HEMP survivability evaluation and protection design.
Introduction
Nowadays antennas are increasing mounted on various communication vehicle cabins or the top of various buildings, which are sensitive and susceptible to the electromagnetic interference, especially to the intentional electromagnetic interference (IEMI) such as, High-altitude electromagnetic pulse (HEMP), ultra-wide bandwidth (UWB), and high-power microwave (HPM) [1–3]. As is known, with the advantages of thousands of kilometers of coverage and extremely high damage energy, HEMP leads to a severe threaten on the various wireless communication equipment with their antennas located at the outside of the cabins or the building, where the strong transient current wave coupling to the antenna port may cause some different level of damages or even more serious effect like breakdown or functional failure of the Radio Frequency (RF) front-end connected directly to the antenna highly possible [4].
Hence, the transient current response of antenna port has attracted much attention from researchers in the computational electromagnetic domain, which are considered as a metal electromagnetic scattering problem. The typical mature numerical computational methods for this problem can be categorized as frequency-domain calculation method and time-domain calculation method, in which the most popular methods mainly contains Finite Difference Time Domain (FDTD), finite element method (FEM), and method of moment (MoM) [5–7]. As is well known, MoM is carried out based on frequency domain integral equation (FDIE) and is the most efficient method to calculate the electromagnetic scattering and radiating problems for thin-line antenna due to the properties of satisfying radiation boundary for the electric integral equation which is taken as basis especially when solving the open domain problem [8,9]. MoM can be divided into the MoM Frequency Domain (MoMFD) based on frequency domain integral equation (FDIE) [8] and MoM Time Domain (MoMTD) based on time domain integral equation (TDIE) [10], while they have different advantages and shortcomings for various application scenarios. With the development in the past two decades, transient analysis of antenna based on TDIE like MoMTD can capture wideband information and handle nonlinear problems, however, it still suffer from the late-time instability problems and high computation complexity due to the solution of antenna structure matrix. Some schemes of the [11–13] appear stable for any structure and for any time step size. On the other hand, it should be noted that, the stability improvement of these methods still leads to high computational complexity. Hence, while ensuring the accuracy, we select MoMFD with higher computational efficiency and Fourier transform as the basis tool for statistical analysis.
It is evident from the literature that, the peak value of the coupled current wave mainly depends on the following factors such as the relative locations of burst source and antenna, magnetic dip angle of the antenna location, and antenna down-tilt angle etc. The uncertainty of relative locations of the burst source and antenna will induce the uncertainty of the incident plane wave parameters, for instance, elevation, azimuthal angle, polarization angle etc. Therefore, the transient response of the antenna excited by an external random field with multiple random parameters is no longer deterministic, which can be only addressed in a statistical way. The most important pioneering work on the statistical analysis for HEMP effect is carried out in [14–16]. The most complete work on this aspect is found in IEC 61000-2-10 in 1998 [14], where the statistical analysis of the PDFs of the current peak for the simple monopole and dipole are calculated with the typical statistical tool-Monte Carlo (MC) simulation, however, it considers the antenna structure (the ground plane under the monopole antenna) to be infinite in extent, while this paper considers a more realistic finite ground plane.An EMP conducted environment is modeled based on MC method in 1996, and the multiple random field parameter distributions are also provided for the statistical analysis of the transmission line coupling problems, which can play an important role in the HEMP related coupling response analysis aspects [15,16]. It is known that, although MC method is simple and robust due to the repeated-run analysis procedure, it turns out to be extremely low-efficient from the computational viewpoint since a very large number of simulation iterations are required to achieve enough accurate information. Therefore, a high-efficient statistical analysis tool is also required.
Polynomial chaos expansion method (PCEM) [17], a faster stochastic simulation method that having already been widely applied in many other research areas is introduced into the statistical analysis of field coupling [18–22]. Analytical model of probability density function of the current peak for the transmission line under arbitrary fields has been provided, and the proposed method based on PC has been proved to be much faster than MC simulation method [19]. Statistical modeling of the far field radiated by antenna undergoing random disturbances is calculated based on PC technique in [20]. PC is also introduced to describe the performance characteristics of electromagnetic structures and antennas with the conditions of uncertainties such as the variations of the dimensional of the device or its material properties [22]. No literatures have been done on the subject of statistical analysis of transient response of antennas illuminated by an external EMP with PC technique introduced. Hence, the statistical analysis of monopole antenna on conductive plane is done in this paper based on the PCEM.
Contrasting to the simple monopole antenna structure, the monopole mounted on conductive plane is widely applied in various situations, the statistical analysis of transient response for which is excited by HEMP is required to the protection design urgently as a result of no literature focus on this aspect. In addition, this paper not only considers the random parameter distributions of HEMP environment, but also concerns on the influences of the relative location of the monopole mounted on the conductive plane and the monopole down-tilt angles to the transient response, which is always paid more attention for system-level electromagnetic compatibility (EMC) design.
Therefore, aiming at the statistical analysis of transient response of monopole antenna mounted on a conductive plane illuminated by HEMP, we use the MoM to calculate the frequency-domain antenna response and obtain the transient response with the method of inverse Fourier transform, and then introduce PCEM to compute the statistical analysis with the previous computed data. Finally, the PDFs, CDFs and confidence interval of current peak are provided with considering the multiple random parameter distributions for HEMP, the relative locations of antenna to the conductive plane and the antenna down-tilt angles. In Section 2 provides the details of statistical modeling. The uncertainty factors of coupling between antenna and HEMP are provided in Section 3. Section 4 provides the statistical analysis results. Section 5 concludes the paper.
Statistical modeling
Transient response computing based on MoM
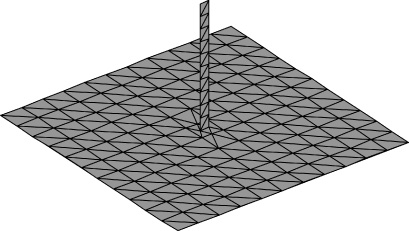
Diagram of monopole mounted on conductive plane with grid divided by RWG triangles [8].
The typical monopole antenna mounted on the roof of communication cabin is equivalent to a monopole antenna on a conductive plane, which always can be divided into multiple triangles with RWG grid generation method by MoM [8], as depicted in Fig. 1. The materials of monopole and plane are taken for the perfect conductor, which satisfies the electric field integral equation (EFIE)
Insert the equation
Hence, the transfer function in frequency domain of the current response scattered surface is defined as
This subsection provides the statistical model for the current transient response according to Polynomial Chaos Expansion Method (PCEM) defined by N. Wiener [17]. Due to the high efficiency compared to Monte Carlo simulation, the statistical characterization of random process can be expanded to the coefficients of the polynomials by PCEM. The short-circuit current I
sc
can be regarded as a stochastic process with multiple random variables 𝜉 = (𝜉1, 𝜉2, …, 𝜉
n
)
T
:
For convenience, with Φ
i
(𝜉) employed to replace L
p
(𝜉1, 𝜉2, …, 𝜉
p
), then it can be rewritten as follows
Since the orthogonality of the polynomial chaos, each coefficient of its expression could be derived:
With these coefficients, the typical statistical parameters mean value I
mean
and standard deviation I
std
of the current transient response can be obtained as follows
By relying on the Wiener–Askey scheme [19], we can directly make use of several families of orthogonal polynomials Φ corresponding to the random parameter distribution 𝜉, for example, Legendre polynomials for the uniform distribution and Hermite polynomials for the Gaussian distribution.
However, we can’t find the suitable orthogonal polynomials to be as the function basis for the stochastic process following non-classical distribution according to look-up table. Therefore, we need to reconstruct new basis for this type of stochastic process according to the methods provided in the literature [24]. The orthogonal polynomial basis reconstructed for the elevation 𝜓 in the Section 3 are provided in Table 1.
The orthogonal polynomial basis for elevation 𝜓
In the actual application, there are multiple random factors impacting the output results. So we need to construct the orthogonal polynomials for the stochastic process following multiple dimensional distributions. Assuming that the highest order of orthogonal polynomials for a certain stochastic process is p, the basis for multiple dimensional distributions can be expressed by the basis for a series of one dimensional distribution
This section describes the radiated HEMP environment for the coupling calculation process. Double-exponential electromagnetic pulse (EMP) is used to describe the early-time HEMP incidence wave for monopole antennas by reference to IEC HEMP radiated environment [25]. Figure 2 shows the definitions of the field parameters of plane-wave incidence, where E
0, 𝜓, 𝜙 and θ define the field magnitude, elevation, azimuthal angle and polarization angle, respectively. The formulation of double-exponential EMP referred is represented by

Uncertain factors of HEMP incidence.
The normal way to characterize the distribution of these random angles is to start from the burst source to the equipment under test (EUT) by taking the burst location as the observer point. We set the height of the burst source generating HEMP incidence as 100 km, which coverage a very widely destructive range. Because the HEMP incident direction is purely random to the monopole along z-axis, we assume that the azimuthal angle 𝜙 follows uniform distribution, in the range of [0,2π], with 𝜉1 defining its uncertainty, the CDF of the azimuthal angle can be represented by
Furthermore, this paper also concerns on the influence of the down-tilt angles θ down of monopole to the transient response for the antenna port by setting multiple down-tilt angles of antenna respectively as shown in Fig. 3.

Sketch map of adjusting different down-tilt angles.
This section firstly provides the validation of the core electromagnetic computing procedure with the proposed method, commercial software CST, and then takes the validation of the statistical model with traditional MC simulations in one dimensional random distribution and three dimensional random distributions respectively. Secondly, it provides and analysis the statistical results of the transient response of monopole antenna ports varying the following scenarios, such as monopole in the plane center and different monopole down-tilt angles. The major antenna parameters in this section are configured as follows: the length and radius of the monopole are 1 m and 0.001 m, both the length and width of the plane are 2 m, and the materials are perfect conductor in the proposed simulation. In addition, in the CST simulation, the material of antenna and plane are copper and aluminum respectively, the plane thickness is 0.006 m.

The SCcurrent result comparison. Specific parameters: antenna length is 1 meter, plane length is 2 meter, E 0 = 50 kV/m, 𝜓 = π∕2, 𝜙 = 0 and θ = π∕2.
Figure 4 shows the transient response curves for the SC current of the antenna port by using multiple methods like the proposed method and CST. The major parameters are as follows: E 0 = 50 kV/m, 𝜓 = π∕2, 𝜙 = 0 and θ = π∕2 (vertical polarization). As is shown in Fig. 4, the maximum SC current peak and the period of the attenuated oscillation provided by the proposed method have high consistency with the curves of CST, while some allowable gaps exist in these curves due to the differentiation of practical parameter configuration.
Figure 5 shows the comparison curves for the mean value and the standard deviation (std.) of SC current and load current with the proposed method and MC simulation. In this example, the only one parameter elevation 𝜓 is considered as a random parameter following uniform distribution in the range of [0, π∕2], and Legendre polynomials are chosen as the orthogonal polynomials used for the proposed method. The statistical results are calculated by 2000 MC simulations and by means of the proposed method. In Fig. 5, it is demonstrated that the curves have an excellent matching for the statistics, which can prove that the proposed method owns the same accuracy compared to the MC simulation. What’s more, the consuming time of the proposed method is very amazing to us compared with MC simulation. The single runtime needed for MC simulation depends on the mesh size, and the average time is about 2 minutes when the main parameters of PC following as Intel Core I5-4460, CPU 3.20 GHz. The total runtime for PC stays on tens of minutes, while the total runtime for MC simulation staying about two days which cannot be endured. Hence, the proposed method has outstanding computational efficiency compared to the traditional MC simulation while keeping the same computation precision.

The comparison curves of the mean value and the standard deviation of SC current with the proposed method and MC simulation when following one random parameter distribution. Specific parameters: antenna length is 1 meter, plane length is 2 meter, E 0 = 50 kV/m, 𝜙 = π∕4, θ = π∕4 and 𝜓 follows uniform distribution of [0, π∕2].
In order to further examine the efficiency of the proposed method, we also compare these two statistical methods in the three dimensional random parameter distributions. Figure 6 illustrates the comparisons of the proposed method and MC simulation with the statistical parameters such as mean value, std. and confidence interval for the performance index SC current. It is demonstrated that the curves of std. and mean value are both identical for these methods in Fig. 6a. In Fig. 6b, it is also shown that all the curves of random-chosen MC samples are almost in the range of confidence interval [10%, 90%] provided by the proposed method.
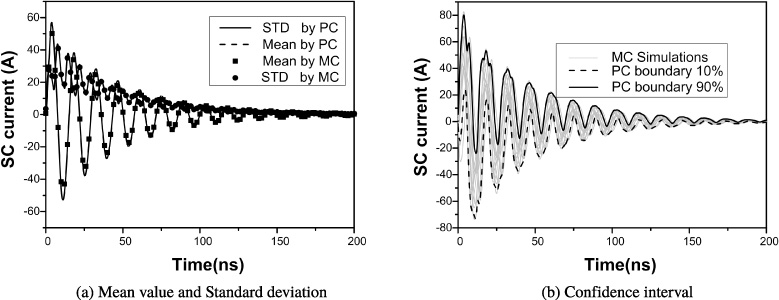
SC currentstatistical result comparison between the proposed method and Monte Carlo simulation, specific parameters: antenna length is 1 meter, plane length is 2 meter, E 0 = 50 kV/m, 𝜓 follows non-classical distribution of Eq. ((24)) with the range of [0, π∕2], 𝜙 follows uniform distribution of [0, π∕2], δ follows uniform distribution of [0, 2π] and θ is calculated with equation ((25)).
This subsection mainly focuses on the statistical analysis for the transient response of monopole antenna when the monopole is fixed on the plane center vertically. This situation is a basic and typical setting mode for antenna response evaluation. As mentioned above in subsection A, we still take the same three dimensional distributions as our statistical input parameters in the following sections.
First, we analyze the performance variation of statistics with the ratios of plane length versus antenna height. The main statistics such as mean value, std., confidence interval, PDF and CDF of SC current peak value are illustrated in Fig. 7a and 7b respectively. The curve of mean value indicates that the amplitude of antenna transient response will maintain a stable level when the L/H ratio is greater than 2. Hence we take this value as the typical basic parameter for antenna response analysis. In addition, from the std. and the upper boundary of confidence interval, we can also derive the conclusion that the antenna transient response will be larger if there is a bigger metal plane under some special electric field environment. The reason is that HEMP incidence wave can excite flowing charges on the plane when the electric field component is not completely perpendicular to the metal plane, which will enhance the transient response for monopole antenna.It is also known that, from Fig. 7a, std. has a significant range with a higher L/H ratio compared to the mean value. For the anti-HEMP protection design in engineering domain, the maximum current response (provided by STD. and PC boundary etc.) of the antenna port is more critical rather than the mean current response, which represents the most harsh case. Obviously, the mean value occurs with a higher probability and extreme response with a very small probability. Mean value is important for us to assess the anti-HEMP harden capability of the practical system while maximum is the critical data used in engineering protection design.
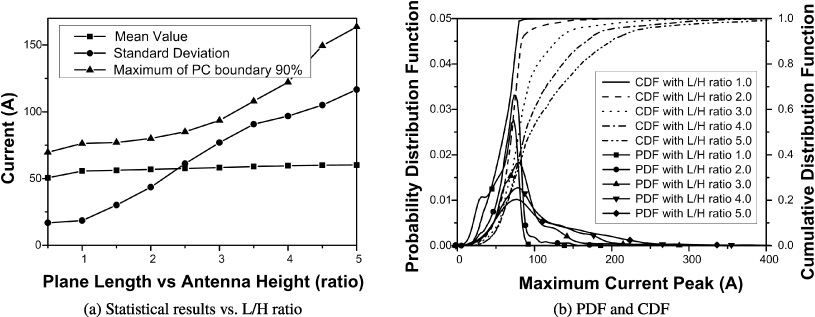
SC current statistical result analysis varying different plane length vs. antenna height ratios. specific parameters: antenna length is 1 meter, plane length is 2 meter, L/H ratios equal from 1 to 5, E 0 = 50 kV/m, 𝜓 follows non-classical distribution of Eq. ((24)) with the range of [0, π∕2], 𝜙 follows uniform distribution of [0, π∕2], δ follows uniform distribution of [0, 2π] and θ is calculated with Eq. ((25)).
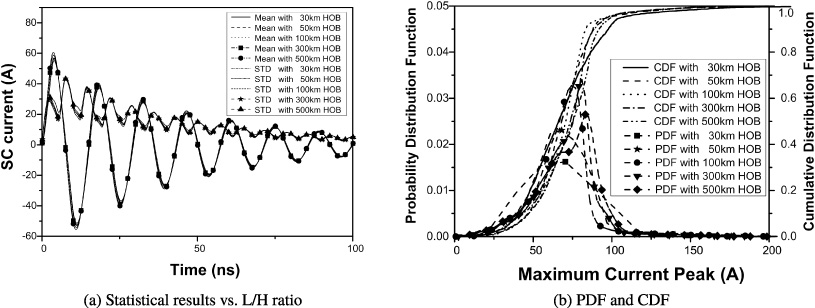
SC current statistical results for transient response varying different HOBs when the monopole fixed on plane vertically. specific parameters: antenna length is 1 meter, plane length is 2 meter, HOB is from 30 to 500 km, E 0 = 50 kV/m, 𝜓 follows non-classical distribution of Eq. ((24)) with the range of [0, π∕2], 𝜙 follows uniform distribution of [0, π∕2], δ follows uniform distribution of [0,2π] and θ is calculated with Eq. ((25)).
Second, we also evaluate the performance influence of the height of bust (HOB) to the transient response. As is shown in Fig. 8, it is demonstrated that the variations of HOB such as 30 km, 50 km, 100 km, 300 km and 500 km has a limited effect on the magnitude of transient response although the transient response still have a slight increase as the HOB increases, which is because the distance between the burst source and the objective is too far so that it cannot contribute too much to increasing the value of electric field along the monopole. Hence, we set HOB as 100 km in the later sections for statistical analysis.
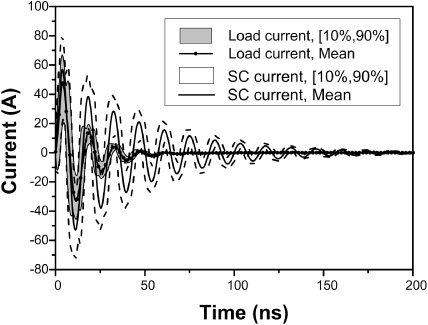
Comparison of SC current and load current when the monopole is fixed on plane vertically (100 km HOB). specific parameters: antenna length is 1 meter, plane length is 2 meter, HOB is 100 km, E 0 = 50 kV/m, 𝜓 follows non-classical distribution of Eq. ((24)) with the range of [0, π∕2], 𝜙 follows uniform distribution of [0, π∕2], δ follows uniform distribution of [0, 2π] and θ is calculated with Eq. ((25)).
Figure 9 shows the result comparison of SC and load current when the monopole antenna is fixed on plane center vertically. The confidence intervals [10%, 90%] of SC current and load current with load 50Ω, which the transient responses for monopoles will be likely to stay in any situation, demonstrates that their maximum current peaks may be smaller than 81 A and 67 A respectively. In addition, the mean value curves of them indicate that the average value for the monopoles will be 58 A and 48 A respectively in three dimensional distributions. Due to the antenna port protection design and system survivability evaluation, we always concern on the magnitude value of the first peak for the transient response. And the upper boundary of the first peak is always used for protection design and the mean value is always used for the survivability evaluation.
In this subsection, we analyze the effect of different down tilt angles of monopole antennas on the statistical results for the transient response. The antenna parameters and incidence wave parameter distributions are identical to the former subsection. The range of down tilt angles is set as 0 to 85 degree. The monopole antenna will be almost parallel to and close to the metal plane when the angle is set as 85 degree. Figure 10 shows that the statistical results of SC current such as mean, PDF and CDF varying different down tilt angles. In Fig. 10a, the maximum of mean value varying down tilt angles give a conclusion that the transient response will decrease as the down tilt angle arises, the reason is that the current induced on the plane will stop the transient response of the monopole increasing as a result of a closer distance between antenna and plane. When the down tile angle is 45 deg., the transient response is almost half that of monopole fixed on plane vertically (0 deg. angle). Hence, we also give the detailed analysis of transient response for SC current and load current with down tilt angle 45 degree, which is shown in Fig. 11. Comparing Fig. 9 and Fig. 11, the upper boundaries of transient response for SC and load currents with both 0 and 45 degree stay at the same level, which is because the confidence interval results are calculated with considering any field parameter distribution. Hence, the mean curves for them are more meaningful for analyzing the effect of the down tilt angles, which is more valuable for the practical application of antenna placement in emergency scene where we can’t just take the communication performance as the only antenna placement factor.
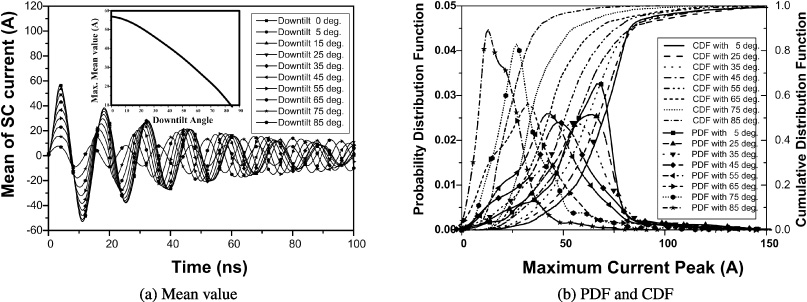
Statistical analysis of SC current varying different down tilt angles. specific parameters: antenna length is 1 meter, plane length is 2 meter, HOB is 100 km, down tilt angle equals from 5 to 85 deg., E 0 = 50 kV/m, 𝜓 follows non-classical distribution of Eq. ((24)) with the range of [0, π∕2], 𝜙 follows uniform distribution of [0, π∕2], δ follows uniform distribution of [0, 2π] and θ is calculated with Eq. ((25)).
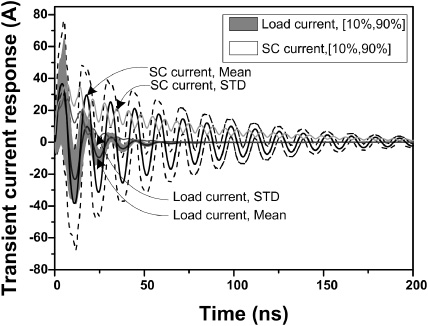
Statistical analysis of SC current and load current with angle 45 degree. specific parameters: antenna length is 1 meter, plane length is 2 meter, HOB is 100 km, down tilt angle equals 45 deg., E 0 = 50 kV/m, 𝜓 follows non-classical distribution of Eq. ((24)) with the range of [0, π∕2], 𝜙 follows uniform distribution of [0, π∕2], δ follows uniform distribution of [0, 2π] and θ is calculated with Eq. ((25)).
A new efficient statistical analysis tool based on PCEM and MoM for the current transient response of monopole antenna is proposed in this paper. In the proposed method, MoM is used to compute the frequency domain response of current induced on the scattered monopole port excited by the incidence wave, and PCEM is used to solve the statistics such as average value, confidence interval and PDF etc. with any input parameters following any arbitrary distribution of interest. The accuracy of the transient response computing procedure is validated with the comparison of CST simulation. The computation accuracy and efficiency of the proposed method are compared with the traditional MC simulations, which depend on the order number of polynomials. The comparison result demonstrates that the computational efficiency of the proposed method outperforms MC significantly when the proposed method owns the suitable order of polynomials for the comparable accuracy.
The feasibility and efficiency of the proposed methodology is validated by means of the MC simulation of monopole antenna on conductive plane illuminated by a random incident plane wave, for which remarkable reductions in computation time are achieved.
This paper examines the statistical analysis of transient response for monopole antenna on conductive plane in HEMP environment based on an advanced statistical analysis tool PCEM. According to the combinations of MoM and PCEM, we obtain FD transfer function of antenna port response by employing MoM firstly, then derive the transient current response, and at last use PCEM to calculate the statistical model. The statistical analysis is discussed with not only considering all the potential key HEMP environment parameters such as elevation, azimuthal angle, polarization angle, magnetic dip angle, HOB etc., but also concerning on the following parameters such as height of burst, ratio of plane length versus antenna height, antenna down tilt angles. The statistical analysis is modeled on the basis of a typical HEMP environment parameter distributions proposed by W. A. Radasky, which is derived from the viewpoint of an observer on the burst source point. According to the typical statistics such as mean value, std., PDF/CDF and confidence interval, we can further understand the distribution range of the transient response and the relationship between the transient response and relevant parameters. Due to the widespread use of monopole antenna on conductive plane, the analysis results in this paper are more important and meaningful for system HEMP survivability evaluation and protection design compared with the analysis results of simple monopole with infinite ground provided by IEC standards. Moreover, the proposed method based on PCEM has a remarkable advantage over the traditional MC method in computational efficiency. In the future, we will try to pay more attentions to the statistical analysis of the transient response of radio frequency front-end components along the front door coupling path for the communication system.