
Abstract
In this paper, the magnetostrictive characteristics of silicon steel sheet under sinusoidal, rectangular and triangular voltage excitations are studied by using a magnetostrictive strain measuring system (MST500). The magnetostrictive butterfly curves, time domain and frequency domain of magnetostriction are compared and analyzed. The results show that the size and distortion of magnetostriction increase with the increase of saturation degree of silicon steel under all excitation types. The distortion degree of magnetostriction under all rectangular voltage excitations is larger than which is under sinusoidal and triangle excitations, and the smaller duty cycle of rectangular excitations cause more serious distortion of magnetostriction. Finally, the A-weighted magnetostriction velocity level of silicon steel sheet under excitation of different types is calculated and compared. The results show that, because there are lots of high frequency magnetostrictive components, the noise produced by the rectangular excitations is much larger than produced by the sinusoidal and triangle excitations. This research provides experimental and data support for the vibration calculation of power equipment working under non-sinusoidal excitation.
Introduction
High voltage direct current (HVDC) projects are more widely utilized in China because of their unique merits, such as larger transmission capacity, lower transmission-line losses, and better stability for long-distance power delivery. However, some problems arose when implementing practical projects. The excitation waveform of power electronic devices is usually not sinusoidal, but rectangular and triangular. For example, the excitation waveform of the converter transformer and the anode saturable reactor is rectangular, which contains many harmonics and causes a strong electromagnetic vibration of the winding and core. As a result, the noise generated by the converter transformer or the anode saturable reactor increases considerably, which causes a bad effect on the environment of HVDC convertor station [1,2].
With the development of power industry, the magnetostriction is directly related to the quality of electrical steel sheet and becoming a hot issue of concern in steel sheet production enterprises. The sound pressure level has been the important technical parameter of transformer [3,4]. The deep study of the magnetostrictive properties of the electrical steel sheet could accelerate the development of magnetic materials. At the same time, due to the continuous expansion of cities and the demand of urban power grid transformation, some substations need to be built in commercial and residential areas, so the noise problem of electromagnetic devices become prominent.
The magnetostriction of silicon steel sheet is one of the main causes of vibration, environmental noise pollution [5], and long-term vibration also shortens the life of power equipment. There are three main methods for reducing the noise created by the electromagnetic devices [6,7]: (1) Adopting new core materials and low-noise fans, and applying optimal techniques for winding design; (2) Setting up acoustic boards in front of the converter transformer that can absorb and insulate noise; (3) Adopting “box-in” technology that encloses converter transformers with noise barriers. These methods can decrease noise by 10–30 dB but with high costs and side effects. In the design stage of electromagnetic devices, how to accurately calculate the vibration of the core is a critical step, but the premise is to accurately measure the magnetostriction of silicon steel sheet.
Grain-oriented silicon steel sheet has better magnetic properties in the rolling direction, so it is applied to manufacture the core of transformers and other electrical devices. The magnetostriction of grain-oriented silicon steel will cause the vibration of electrical devices [8,9]. In recent years, the magnetostrictive characteristics of the grain-oriented silicon steel sheet have been studied in a large amount. The influence of different factors on magnetostrictive properties is studied, including temperature, stress, annealing process and grain size of grain-oriented silicon steel, so as to reduce the size of magnetostriction [10–13].
Most of the early studies of magnetostriction are from the micro angle of material structure, and are qualitative research. The magnetostriction of the single grain is obtained by applying strain gauge on each grain of the silicon steel in [14]. The magnetic flux density and the orientation of grain affect the magnetostriction, and the coating on the surface of the sample reduces the magnetostrictive variables of the single grain. A mathematical model is established to quantitatively describe the relationship between magnetostriction, magnetic flux density and stress, and the trend of magnetostriction is obtained in [15]. The magnetic and magnetostrictive properties of grain-oriented silicon steel with 3.25% to 6% silicon content are studied in [16], the results show that the increase of silicon content can improve the permeability and reduce the loss, the magnetostrictive property has also been greatly improved, so the vibration caused by magnetostriction can be reduced largely by increasing the silicon content.
Enokizono and Philip I. Anderson measure the rotational magntostriction of electrical steel sheet under sinusoidal magnetic excitation by using three axis strain gauge [17,18], their study point out that the calculation accuracy of the vibration and noise of motor can improve by considering the magnetostriction anisotropy [19]. The study of Anouar Belahcen shows that the magnetostrictive effect in the high-power motor will increase the vibration of stator core more than 17% [20]. But the current studies on the magntostriction of silicon steel sheet and vibration of electric equipment are mostly under sinusoidal or harmonic excitations, there is lack of study on the magnetostriction of silicon steel sheet under the non-sinusoidal excitation. Therefore, the study of magnetostrictive characteristics of silicon steel sheet under non-sinusoidal excitation is of great significance to accurately calculate the core vibration in the design stage.
In this paper, the magnetostrictive characteristics of single silicon steel sheet under sinusoidal, rectangular and triangular wave excitations are studied by using a magnetostrictive strain measuring system (MST500). At the same time, the magnetostrictive butterfly curves, time domain and frequency domain of magnetostriction are compared and analyzed. Finally, the A-weighted magnetostriction velocity level of silicon steel sheet under different forms of excitation is calculated and compared. The rectangular wave excitation has a great influence on the vibration of electromagnetic devices. The measurement and research of the magnetostriction of silicon steel sheet under non-sinusoidal excitation provide the experimental basis for the calculation of vibration and noise of electromagnetic devices, such as converter transformer and saturable reactor.
Magnetostrictive measurement and mechanism
Measuring devices
A set of one-dimensional single sheet magnetostriction measurement system (MST500) produced by Brockhaus company is used in the experiment; it can well meet the IEC/TR 62581 standard [21]. The effective length and width of the silicon sheet sample(B30P105) is 600 mm and 100 mm. In the measuring process, one end of the sample is fixed by the clamping part of the device, and the other end of the sample is in free-state. The magnetic flux density of the sample is changed by the size of 50 Hz voltage excitation. The excitation waveform can be programmed for arbitrary waveform. In this paper, the sine wave, rectangular wave with different duty cycle and the triangle wave are applied to the windings. The laser beam will be reflected back to the laser by reflector pasted in front of sample, and then the magnetostriction of the sample can be measured. The resolution of the laser is 10 nm/m, the experiment set-up is shown in Fig. 1.
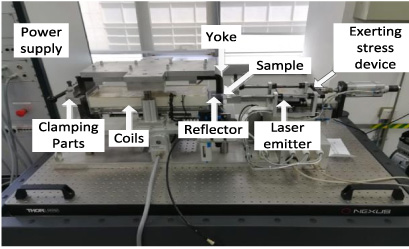
The experiment set-up.
The magnetostrictive effect of the grain-oriented silicon steel sheet is caused by the displacement of the internal magnetic domain under the action of the magnetic field. The structure and change process of the magnetic domain of are observed by M. Imumara and T. Sasaki [22], as shown in Fig. 2 and Fig. 3.

“lancets” and transverse subdomain.
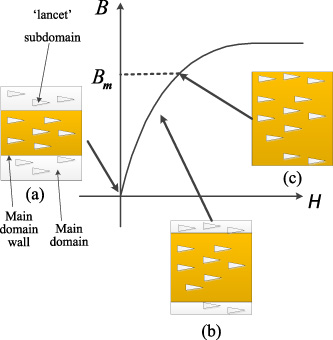
Changes of magnetic domain in the magnetization process.
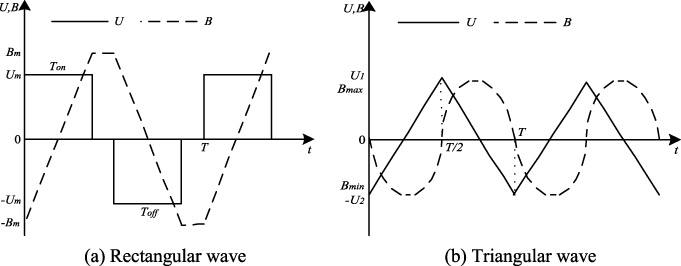
The change of magnetic flux density with rectangular and triangular wave.
The main magnetic domain, the ‘lancet’ subdomain and the transverse subdomain [23,24] which connect two different ‘lancet’ subdomains are found inside the laminated silicon steel. The structure of the ‘lancet’ subdomain and the transverse subdomain is shown in Fig. 2, the main magnetic domain is shown in Fig. 3(a). In the process of magnetization of silicon steel sheet, the 180 degree domain wall of main domain began to merge with the increase of magnetic flux density, and the distribution density of ‘lancet’ subdomain increased gradually, as shown in Fig. 3(b). When the magnetic flux density reaches the saturation value B m , the 180 degree domain wall of the main domain disappears and the density of the ‘lancet’ subdomain reaches the maximum, which is shown in Fig. 3(c).
The increase of the density of ‘lancet’ subdomain will lead to the contraction of the silicon steel sheet in the rolling direction, and the magnetostriction of the silicon steel sheet is negative value at this time. When the magnetic flux density continue to increase, the density of ‘lancet’ subdomain begins to decrease. Meanwhile, the angle between the transverse subdomain and the surface of the silicon steel sheet becomes smaller and the transverse subdomain is elongated, then the magnetostriction of the silicon steel sheet starts to increase monotonously. When the magnetic flux density increases to a certain extent, the magnetostriction of the silicon steel sheet will become positive value. The tensile stress of silicon steel will change the process of the magnetic domain and the density of the ‘lancet’ subdomain, and the saturation magnetic flux density B m of silicon steel sheet will increase at the same time, then the saturation magnetostriction M s will increase. If the silicon steel sheet is subjected to the action of compressive stress, there will be an opposite trend of change.
Rectangular wave is a typical waveform in the converter valve, and the triangular wave is closer to the sine wave. The relation between the voltage and the change rate of magnetic flux density is as follows:
For the rectangular wave, the relation between voltage and magnetic flux density is shown in Fig. 4(a), the voltage across the transformer can be positive, negative, or zero. The corresponding flux density waveform in one switching period can be deduced by integration of voltage and divide it by winding turns and effective core cross section. Therefore, the magnetic flux density waveform has a linear behavior, and it can be accurately represented by a piecewise linear model.
For the triangular wave, the relation between voltage and magnetic flux density is shown in Fig. 4(a). In the same way, the function expression of a triangular wave in one cycle is as follows:
Magnetostrictive results
According to the IEC62581 standard, the magnetostriction butterfly curve is usually drawn as shown in Fig. 5. The vertical axis represents the size of magnetostriction (nm/m). The transverse axis represents the magnetic flux density B (T), and the butterfly curve is drawing the relationship between the magnetostriction and B in one excitation time period. At the same time, there are two important parameters of the magnetostriction in the standard of IEC62581, which is called 𝜆 op and 𝜆 pp . The 𝜆 op is the magnetostriction which from 0 to peak, which means the instantaneous magnetostriction when the magnetic flux density reaches the maximum. The 𝜆 pp is peak to peak magnetostriction, which means the variation magnitude of magnetostriction in a period.
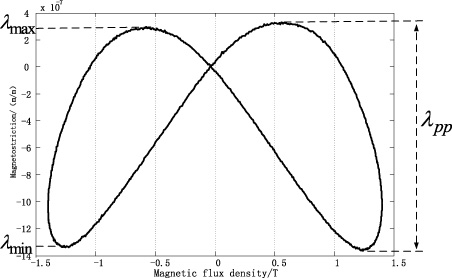
The schematic diagram of 𝜆 pp .
The relationship between 𝜆
pp
and the maximum elongation 𝜆max +, the maximum contraction 𝜆max− of magnetostriction is as follows.
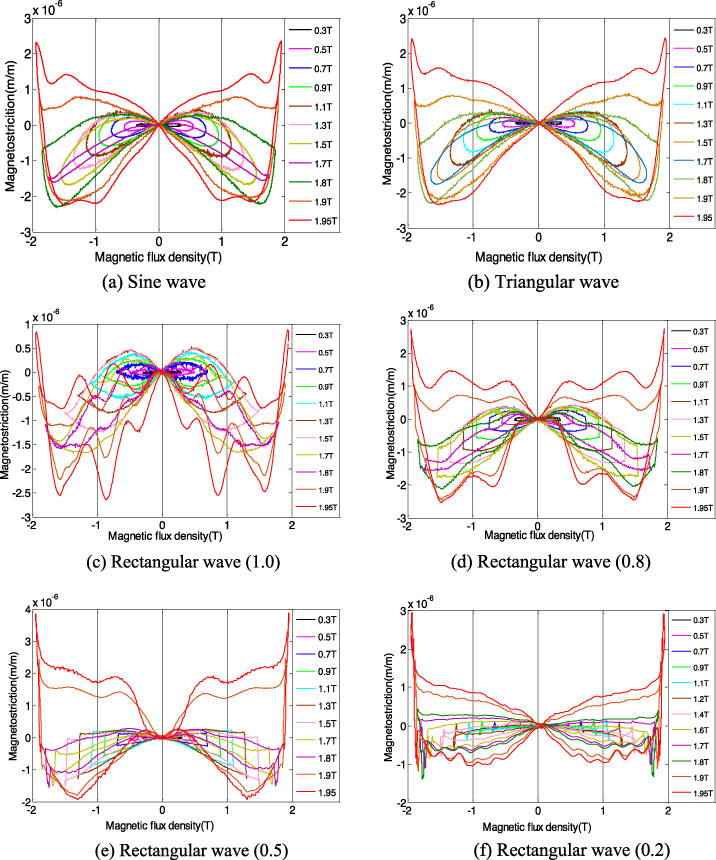
Magnetostriction butterfly curves under different excitations.
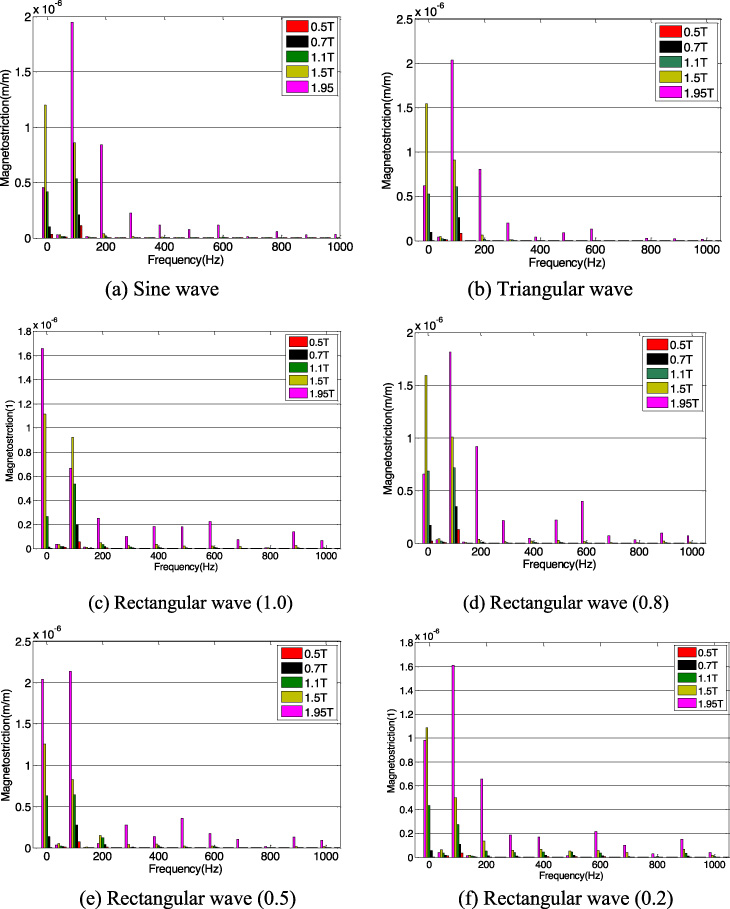
Magnetostrictive spectrum of different excitations (The magnetic flux density corresponding to magnetostriction of each frequency from left to right is 0.5T, 0.7T, 1.1T, 1.5T, 1.95T).
The magnetostrictive butterfly curves and spectrum excited by rectangular wave with 1.0 duty cycle are shown in Fig. 6(c) and Fig. 7(c) respectively, the “wings” area of the magnetostrictive butterfly curves is bigger than which excited by sine wave, and the end of magnetostrictive butterfly curves are in the obvious up state. When the magnetic flux density is bigger than 1.7T, the distortion of magnetostrictive butterfly curves becomes very serious. When the magnetic flux density reaches 1.95T, the distortion degree of magnetostrictive butterfly curve reaches the maximum, the 𝜆max + and 𝜆max− are 900 nm/m and 2700 nm/m respectively, and the magnetostrictive components of 200 Hz, 300 Hz, 400 Hz, 500 Hz, 600 Hz, 700 Hz, 900 Hz and 1000 Hz increased significantly.
The magnetostrictive butterfly curves excited by rectangular wave with 0.8 duty cycle is shown in Fig. 6(d), the end of the butterfly curves are different from which excited by the sine wave and rectangular wave with 1.0 duty cycle, there are a certain “truncation” effect in the end of butterfly curves, the 𝜆max + and 𝜆max− are 2700 nm/m and 2500 nm/m respectively. When the magnetic flux density reaches 1.95T, the magnetostrictive components of 200 Hz, 300 Hz, 500 Hz and 600 Hz increased significantly.
When the duty cycle of rectangular wave is 0.5 and 0.2, the magnetostrictive butterfly curves are shown in the Fig. 6 (e) and Fig. 6(f) respectively. It can be seen that the magnetostrictive butterfly curves excited by rectangular wave with 0.5 duty cycle have severe “truncation” effect, the 𝜆max + and 𝜆max− are 3910 nm/m and 1930 nm/m respectively, the saturation magnetostriction M s is much larger than other excitations. The end of the magnetostrictive butterfly curve excited by 0.2 duty cycle rectangular wave has more serious “transverse” effect than excited by the rectangular wave with 0.5 duty cycle, the degree of distortion is the largest of these excitations, the 𝜆max + and 𝜆max− are 3920 nm/m and 1930 nm/m respectively.
When the magnetic flux density of silicon steel sheet is 1.3T, it is working in the linear region of magnetization curve. It can be seen from Fig. 8 that the magnetostrictive waveform is basically combined with periodic changes without distortion under sine and triangular wave, and the 𝜆max + is 0.32 × 10⁻⁶ m/m, the 𝜆max− is 1.36 × 10⁻⁶ m/m, the magnetostriction is mainly concentrated in 0 Hz and 100 Hz. When the excitation is rectangular wave with 1.0 and 0.8 duty cycle, the 𝜆max + is 0.53 × 10⁻⁶ m/m and 0.42 × 10⁻⁶ m/m respectively, the 𝜆max− is 1.02 × 10⁻⁶ m/m and 1.46 × 10⁻⁶ m/m respectively, the magnetostrictive waveform is basically sinusoidal and has small distortion and many burrs, and the magnetostriction mainly concentrates in 0 Hz and 100 Hz. When the excitation is rectangular wave with 0.5 and 0.2 duty cycle, the 𝜆max + is 0.22 × 10⁻⁶ m/m and 1.39 × 10⁻⁶ m/m respectively; the 𝜆max− is 0.04 ×10⁻⁶ m/m and 0.71 × 10⁻⁶ m/m respectively. The magnetostrictive waveform under the rectangular wave with 0.5 duty cycle has certain distortion, and the magnetostrictive mainly concentrates on 0 Hz, 100 Hz and 200 Hz. The magnetostrictive waveform under the rectangular wave with 0.2 duty cycle is greatly distorted, and magnetostriction mainly concentrates in 0 Hz, 100 Hz, 200 Hz, 300 Hz, 400 Hz and 500 Hz.
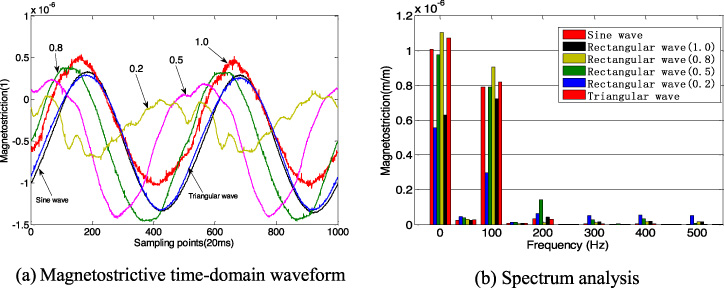
Magnetostrictive time-domain waveform and spectrum analysis under 1.3T (The waveform type corresponding to magnetostriction of each frequency from left to right is sine wave, rectangular wave (1.0), rectangular wave (0.8), rectangular wave (0.5), rectangular wave (0.2) and triangular wave).
When the magnetic flux density of silicon steel sheet is 1.95T, the magnetostrictive time domain waveform under different excitation forms are shown in Fig. 9(a), the magnetostrictive spectrum under different excitations by fast fourier transformation is shown in Fig. 9(b). It can be seen from Fig. 9 that magnetostrictive distortion excited by all waveforms is more serious than which at 1.3T. The magnetostrictive distortion excited by sine and triangular wave is the least, the magnetostriction mainly concentrate in 0 Hz, 100 Hz and 200 Hz, a small part concentrate in 300 Hz, 400 Hz, 500 Hz, 600 Hz, the 𝜆max + is 2.13 ×10⁻⁶ m/m, and the 𝜆max− is 2.51 ×10⁻⁶ m/m, and the 𝜆 pp is 2.7 times of which is at 1.3T. When the excitation is rectangular wave with 1.0 duty cycle, the 𝜆max + is 1 ×10⁻⁶ m/m, the 𝜆max− is 2.51 ×10⁻⁶ m/m, the magnetostriction also mainly concentrates in the 0 Hz, 100 Hz, 200 Hz, 300 Hz, 400 Hz, 500 Hz, 600 Hz and other frequency components are smaller. When the duty cycle of the rectangular wave is 0.5, the 𝜆max + is 3.82 ×10⁻⁶ m/m, and the 𝜆max− is 1.76 ×10⁻⁶ m/m, which the magnetostriction value and distortion reaches maximum in all forms of excitation at saturated state, the magnetostriction mainly concentrates in 0 Hz, 100 Hz, 300 Hz, 500 Hz and 600 Hz. When the duty cycle of the rectangular wave is 0.8, the 𝜆max + is 2.63 ×10⁻⁶ m/m, the 𝜆max− is 2.45 ×10⁻⁶ m/m, and the magnetostriction mainly concentrates on components of 0 Hz, 100 Hz, 200 Hz, 300 Hz, 500 Hz and 600 Hz. When duty cycle of the rectangular wave is 0.2, the 𝜆max + is 3.01 ×10⁻⁶ m/m, the 𝜆max− is 1.06 ×10⁻⁶ m/m, and magnetostrictive mainly concentrates on components of 0 Hz, 100 Hz, 200 Hz, 300 Hz, 400 Hz and 600 Hz.
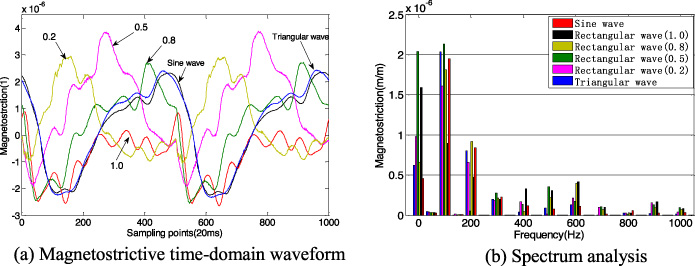
Magnetostrictive time-domain waveform and spectrum analysis under 1.95T.
The 𝜆 pp -B max interpolation curve under different excitation types.
The peak to peak magnetostriction and magnetic flux density.
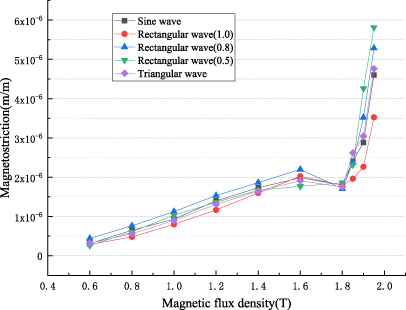
In order to facilitate the application of magnetostrictive measurement data to the finite element calculation [25], we extract the magnetostrictive characteristic curve under alternating magnetization based on the butterfly curve family depicted in Fig. 5. In order to get a set of (𝜆 pp , B max ) data, the magnetostrictive peak to peak value 𝜆 pp and the peak value of magnetic flux density B max are selected in every magnetostrictive butterfly curve, and then the smooth magnetostrictive characteristic curve is obtained by spline interpolation method.
𝜆 pp can represent the size of the magnetostrictive strain of silicon steel sheet, but also can be used to calculate the vibration of electric equipment by the 𝜆 pp − B max interpolation curve of magnetostrictive. The 𝜆 pp − B max interpolation curve and data under different excitation types is shown in Fig. 10, it can be seen that the 𝜆 pp increases slowly when the B max is less than 1.8T, but the 𝜆 pp increases quickly when the B max is greater than 1.8T, this is because the main domain wall produce fusion in the saturation stage, it makes the density of ‘lancet’ subdomain decrease quickly, then the magnetostriction will increase.
Magnetostrictive noise
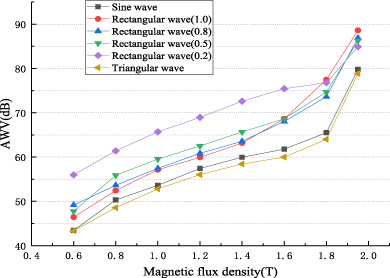
The A-weighted velocity level (AWV) is the frequency characteristic of the simulated human ears, because its characteristic curve is close to the auditory characteristics of human ear, A-weighted sound level is the most widely used noise representation method in the world. Many noises related national standards are based on A-weighted sound level as an important index. The noise decibel value formula caused by magnetostriction is calculated as follows [21].
According to the values at different frequency components of magnetostriction under different excitations, we get the noise decibels values induced by magnetostriction of silicon steel sheets by using formula (9), which are shown in Fig. 11. It can be seen from the Fig. 11 that the noise increases with the increase of the magnetic flux density, when the magnetic flux density is greater than 1.6T, the noise increases significantly faster, this is due to large magnetostriction and many harmonic components in the saturation condition. When the magnetic flux density is less than 1.55T, the noise under rectangular wave with 0.2 duty cycle is the largest, which is due to the large number of magnetostrictive harmonics. When the magnetic flux density is greater than 1.55T, the noise caused by the rectangular wave with 1.0 duty cycle is larger than that of other excitations, and the maximum noise is up to 88.61 dB. The noise excited by the sine and triangular wave is the lowest.
In this paper, a set of one-dimensional single sheet magnetostriction measurement system (MST500) is used to study the magnetostrictive properties of silicon steel sheet under different excitations. The magnetostrictive butterfly curves, time domain and frequency domain of magnetostriction of different types of excitation are compared and analyzed, and the conclusions are drawn as follows.
(1) Under all types of excitation, the distortion of magnetostriction increase significantly with the increase of saturation degree of the silicon steel sheet.
(2) The magnetostriction butterfly curves under the triangular excitation are basically consistent with the sinusoidal excitation, and the magnetostriction mainly concentrates in the frequency of 0 Hz and 100 Hz.
(3) The degree of magnetostrictive distortion excited by rectangular wave is greater than that of sine or triangular wave, and the smaller duty cycle causes the more serious distortion of magnetostriction.
(4) The end of magnetostrictive butterfly curves excited by rectangular wave is not smooth. Meanwhile, with the decrease of duty cycle of rectangular wave, the “truncation effect” is more serious.
(5) The noise under the rectangular wave excitation is much larger than that of sine wave or triangular wave under the same working condition.
Footnotes
Acknowledgements
This work was supported in part by National Key R&D Program of China (2017YFB0903904), and in part by National Natural Science Foundation of China(NSFC)(51677064).