
Abstract
Accurate measurement of magnetostriction is the basis for calculating the vibration of silicon steel laminated core. In this paper, a laser magnetostriction measurement system (MST500) is used to study the magnetostriction characteristics of silicon steel under sinusoidal, third harmonic, and DC bias magnetization. The magnetostrictive butterfly curves, time domain waveforms, and spectrum diagrams of silicon steel sheets under different excitations are compared and analyzed. The effects of different operating conditions on the magnetostrictive properties of silicon steel sheets were studied and analyzed, mainly including amplitude and spectrum analysis. Finally, the magnetostrictive peak to peak curves under different operating conditions were extracted, providing a data basis for the core vibration of power equipment.
Introduction
Oriented silicon steel sheet is a kind of soft magnetic material commonly used in the core of power equipment such as transformers and reactors. It is a kind of ferrosilicon soft magnetic alloy with a silicon content of 0.5–4.5%. The role of silicon is to increase the resistivity and maximum permeability of iron and to reduce coercivity and core losses. Silicon steel sheet usually goes through the process of rolling and annealing, and different processes have a great influence on the magnetostrictive and magnetization properties of silicon steel sheet, so the anisotropy of magnetostrictive and magnetization properties of silicon steel sheet needs to be studied. The premise of accurately calculating the vibration of silicon steel laminated core is to precisely measure the magnetostriction and magnetization characteristics of silicon steel sheet under different working conditions.
Somkun, Moses et al. studied the magnetostriction of unoriented electrical steel in motor cores under conditions of rotational magnetization and illustrated the correlation between anisotropy and rotational magnetostriction of unoriented electrical steel [1,2]. Zhang Yanli, Ou Xiaodong et al. studied the magnetostrictive properties of silicon steel wafers in the presence of a DC magnetic bias [3–5]. Xiaojun Zhao et al. studied the magnetostrictive properties of oriented silicon steel under DC bias and multi-sinusoidal magnetization, and analyzed the effects of frequency and DC bias on magnetostrictive properties [6]. Wang Yaqi, Zhong Sichong et al. studied the magnetostrictive properties of oriented silicon steel sheets under the influence of harmonics. [7–10]. Dezhi Chen et al. studied the electromagnetic-force characteristics of silicon steel sheet considering the effects of different temperatures and harmonics [11]. M. Yamagashira et al. made a comprehensive investigation on the magnetostrictive properties of silicon steel sheet under rotating magnetization [12]. Lingyun Zhang et al. studied the effect of mechanical stress on magnetic properties such as magnetostriction of oriented silicon steel sheet [13]. Yuichiro Kai et al. studied the effect of shear stress on two-dimensional magnetostriction of non-oriented electrical steel sheet [14]. Yanli Zhang et al. measured magnetostrictive strain of non-oriented (NO) and oriented (GO) electrical steels under sinusoidal excitation, DC bias and third harmonic excitation [15]. Lihua Zhu et al. established the magnetostrictive model of oriented silicon steel based on the improvement of JA model and quadratic domain rotation model, and carried out magnetostrictive analysis of oriented silicon steel under ideal sinusoidal, harmonic and DC magnetic bias conditions [16].
At present, most studies compare and analyze the magnetostrictive characteristics of silicon steel sheets under one type of excitation. This article comprehensively and detailedly compares the magnetostrictive characteristics of silicon steel sheets under sinusoidal excitation, sinusoidal superimposed third harmonic, and sinusoidal superimposed DC bias excitation. The measured data also provides a data basis for the vibration and noise simulation research of transformers or reactors. Because the magnetostrictive order of magnitude of silicon steel sheet is very small, about 10−6 m/m, high precision instruments and equipment are needed. Dynamic strain gauges and laser measurement systems are widely used to measure the magnetostriction of silicon steel sheet. Although the testing method using dynamic strain gauge can achieve the required accuracy, this method belongs to direct measurement method, which is complex in operation and vulnerable to external electromagnetic environment and temperature interference, and the pasting of strain gauges requires skilled technology to ensure high accuracy. The above shortcomings make it difficult to measure the magnetostriction of silicon steel sheets by this method. Therefore, in this article, the magnetostriction and magnetization characteristics of oriented silicon steel sheet are measured by laser magnetostriction measurement equipment in accordance with IEC/TR62581 standard, and the effects of different working conditions on magnetostriction of silicon steel sheet are studied and analyzed, including amplitude and spectrum analysis. Finally, the magnetostrictive peak-to-peak curves under different working conditions are extracted to provide data basis for core vibration of power equipment.
Magnetostriction and magnetization of silicon steel sheet under sinusoidal excitation
The measuring method of Magnetostriction of Silicon Steel sheet at present only the relevant standard has been established in the IEC62581 report. The physical quantity that describes the magnetostrictive effect is magnetostrictive strain, which is defined as follows:
In the above formula, 𝜆 is the magnetostrictive strain, l B is the length of silicon steel sheet when the magnetic flux density is B, and l 0 is the length of silicon steel sheet without magnetic field. The order of magnitude of 𝜆 is generally between several hundred nm/m and several μm/m.
Measurement of the magnetostrictive properties of silicon steel sheets is important for calculating magnetostrictive stresses and strains in the cores of power equipment. This article adopts a single-chip magnetostrictive measurement system, which is produced by Brockhaus company in Germany and conforms to the IEC/TR62581 standard. The MST500 laser magnetostrictive measurement system is as shown in Fig. 1. The measurement system is composed of mainframe, magnetic circuit device and laser transmitting and receiving device. The magnetic circuit device includes an excitation coil, an induction coil and an iron yoke forming a flux circuit. The sample piece with effective length and width of 600 mm and 100 mm is placed in the internal cavity of the winding. One end of the sample is fixed by the clamp, the other end can be freely telescopic, and the freely telescopic end is affixed with a reflector.
In the process of using laser magnetostriction measuring equipment to measure the magnetostriction of silicon steel sheet, the excitation coil is excited by the power supply system, and the resulting magnetic field forms a closed loop between the iron yoke and the silicon steel sample sheet. The silicon steel sample will be deformed along the magnetization direction to drive the vibration of the reflector, and the laser signal generated by the laser generator is reflected to the signal receiver by the reflector. The optical processor calculates the magnetostrictive strain produced by the silicon steel sample through the laser difference received. Its accuracy can reach 10 nm/m and fully meet the requirements of magnetostrictive data in the calculation process. The entire magnetic circuit and the laser transmitting and receiving device were placed on a suspended platform supported by air during the experiment, which was done to minimize the influence of environmental factors on the experimental results. In this article taking the B30P105 silicon steel sheet produced by Baowu Steel Group Corporation as the measuring sample, the magnetostrictive characteristics of this kind of silicon steel sheet under power frequency magnetic field, harmonic magnetic field, DC bias magnetic field and non-sinusoidal excitation are studied. The experimental results are analyzed and processed, and the changing rules of magnetostrictive properties of oriented silicon steel sheets under different working conditions are summarized.
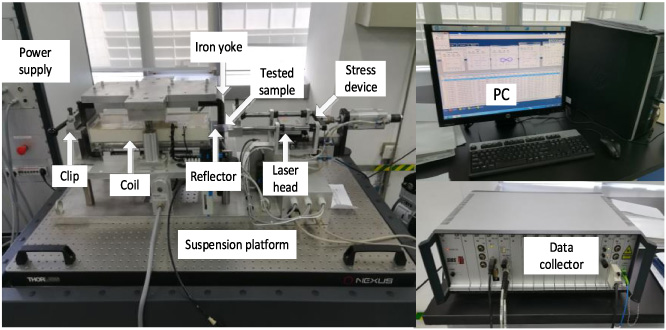
The magnetostriction measurement set-up.
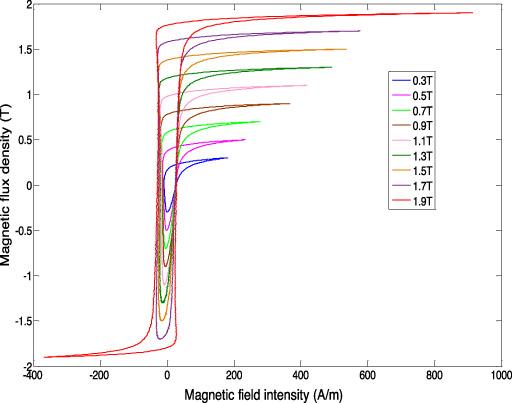
Under 50 Hz sinusoidal excitation, the magnetization characteristics of B30P105 silicon steel sheet in the range of 0.1 T to 1.9 T were measured with 0.1 T flux density and 0.05 T as measuring step. The hysteresis loops measured under several typical flux densities are shown in Fig. 2. It has been observed from Fig. 2 that when the magnetic flux density is less than 1.5 T, the area of the hysteresis loop of the silicon steel sheet increases slowly with the increase of the flux density, when the magnetic flux density reaches 1.7 T, the silicon steel sheet is already in a state of saturation, and when the magnetic flux density reaches 1.9 T, the silicon steel sheet has reached a state of extreme saturation.
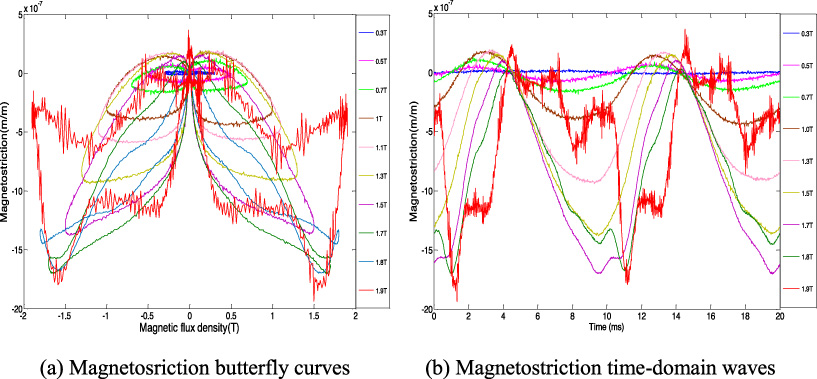
Under 50 Hz sinusoidal excitation, the magnetostrictive butterfly curve of silicon steel sheet under different magnetic flux density is shown in Fig. 3. It can be observed from Fig. 3 that when the magnetic flux density in the silicon steel sheet is less than 1.7 T, the magnetostriction of the silicon steel sheet shows a negative growth, that is, the contraction state. at this time, the area of the magnetostrictive butterfly curve is smaller and the wings gradually bend downward; when the magnetic flux density is greater than 1.7 T, the magnetostriction increases rapidly and the wing of the butterfly curve narrows gradually, because the silicon steel sheet has entered the saturation zone, the magnetic domain begins to rotate, and the magnetic domain wall fuses at the same time; when the flux density reaches 1.8 T, the area of the magnetostrictive butterfly curve decreases and the wing tip increases gradually; when the magnetic flux density reaches 1.9 T, the wing area of the magnetostrictive curve reaches the maximum, at this time the silicon steel sheet has reached a completely saturated state, the magnetic domain rotates and the magnetic domain wall is completely fused.
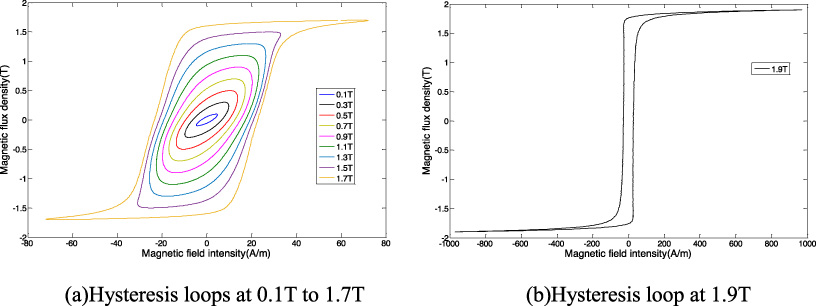
Hysteresis loops under sinusoidal excitation.

Magnetostriction butterfly curves at different flux densities.
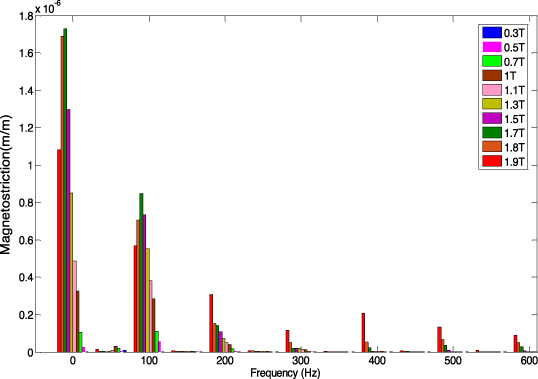
Under 50 Hz sinusoidal excitation, the magnetostrictive time domain curve of silicon steel sheet in one period in the rolling direction (RD) is shown in Fig. 4(a), in which the horizontal axis represents 1000 sampling points, that is, one cycle, and the time is 20 ms. It can be seen from Fig. 4(a) that the magnetostriction of silicon steel sheet changes periodically when the magnetic flux density is less than 1.7 T, but when the magnetic flux density is greater than 1.7 T, the time domain curve of magnetostriction begins to produce some distortion. The time domain waveform of magnetostriction is decomposed by Fourier transform, as shown in Fig. 4(b). It can be observed from Fig. 4(b) that when the flux density is less than 1.7 T, the magnetostriction is mainly concentrated in 0 Hz and 100 Hz, and when the flux density is greater than 1.7 T, the magnetostriction increases in the 200 Hz component. This is because the magnetostriction is not only caused by the magnetic domain wall shift, but also caused by the rotation of the magnetic domain.

Magnetostrictive time domain and spectrums waveforms at different magnetic flux densities.
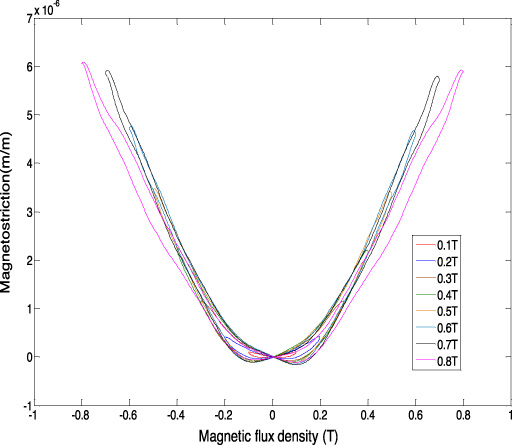
Magnetostrictive butterfly curves in TD direction.

Magnetostrictive spectrum of silicon steel sheet in TD.
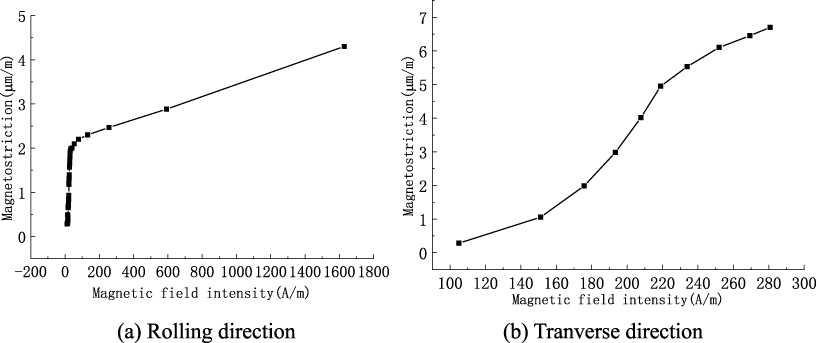
In this paper, the magnetostriction of silicon steel sheet in perpendicular to the rolling direction (TD) has been measured, and the magnetostriction butterfly curve and spectrum are shown in Figs 5 and 6, respectively. It can be observed from Fig. 5 that when the magnetic flux density in the silicon steel sheet is 0.8 T, the magnetostrictive peak value of the silicon steel sheet perpendicular to the rolling direction has reached 6.1 × 10⁻⁶ m/m, while when the magnetic flux density is 1.9 T, the magnetostrictive peak value in the rolling direction is 2.2 × 10⁻⁶ m, the peak value of magnetostriction perpendicular to the rolling direction at 0.9 T is 2.8 times higher than that at 1.9 T. It can be observed from Fig. 6 that the magnetostriction of silicon steel sheet perpendicular to the rolling direction is concentrated on the 0 Hz, 100 Hz and 200 Hz components. The magnetostriction of the silicon steel sheet perpendicular to the rolling direction is very large, and there is a rotating magnetic flux density at the corner of the transformer or reactor core and in the “T” region, and the magnetostriction perpendicular to the rolling direction will also have an effect on the core vibration. Therefore, the magnetostriction perpendicular to the rolling direction cannot be ignored in the calculation of core vibration of power equipment.
In order to apply the measured magnetostrictive data in finite element simulation, a smooth curve is obtained by interpolating the peak and peak 𝜆
pp
of magnetostrictive butterfly curve with the peak value of magnetic field, which is used to calculate the coupling of magnetic field and structural force field. The definition of magnetostrictive peak is as follows [17]:
In the above formula, 𝜆max and 𝜆min represent the maximum and minimum values on the magnetostrictive butterfly curve, respectively, as shown in Fig. 7.
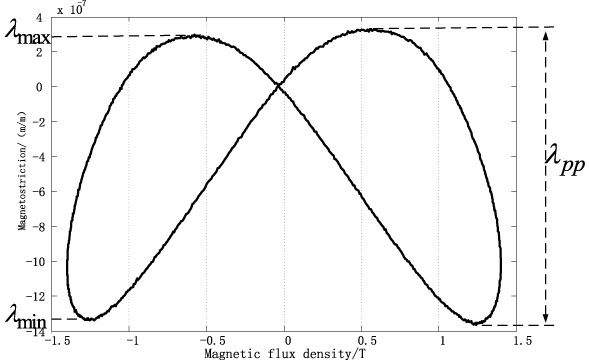
The meaning of peak-to-peak value of magnetostriction.
Magnetostrictive interpolation curve of silicon steel sheet in RD and TD.
The magnetostrictive single-valued interpolation curve of silicon steel sheet RD and TD is shown in Fig. 8, and the corresponding plotted data are in Table 1. It can be observed that when the magnetic field intensity is the same, the magnetostriction in the TD direction is much larger than that in the RD direction, which is due to the fact that it is difficult to be magnetized in the TD direction. The BH curves of RD and TD of silicon steel sheet are shown in Fig. 9. It can be seen that it is difficult for silicon steel sheet to be magnetized in TD direction.
Magnetostriction data for silicon steel wafers RD and TD
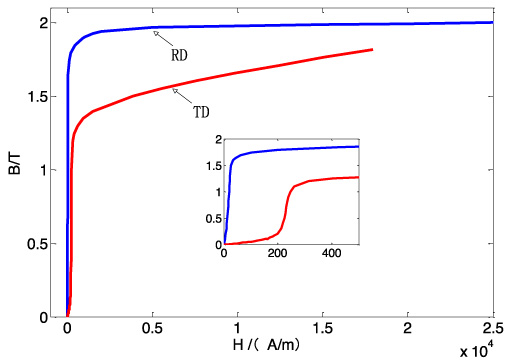
The B-H curve of silicon steel sheet in RD and TD.
The magnetostrictive properties of silicon steel sheets are measured with 50 Hz sinusoidal excitation as the fundamental wave and the third harmonic excitation of different contents. The percentage of the third harmonic is 10%, 20%, 30%, 40% and 50%, respectively. When the proportion of harmonics added is 30%, the magnetostrictive butterfly curve and time domain waveform of silicon steel sheet under different flux density are shown in Figs 10(a) and 10(b). It can be observed that when the percentage of harmonics is constant, the magnetostriction increases with the increase of the magnetic flux density, but the magnetostrictive waveform of the silicon steel sheet at low magnetic flux density has a greater distortion because of the existence of the third harmonic. When the core reaches saturation, the magnetostrictive butterfly curve distortion reaches the maximum and contains more burrs. The spectrum of the waveform after Fourier decomposition is shown in Fig. 11. It can be observed that due to the excitation of the third harmonic component, the original undistorted magnetostrictive waveform has a large distortion, the largest increase in the magnetostrictive waveform is not the second harmonic component of the third harmonic, that is, 300 Hz, but mainly the 200 Hz and 400 Hz components. Therefore, it can be concluded that the addition of the third harmonic will significantly increase the even frequency components of magnetostriction.
Magnetostrictive butterfly curves and time domain waveforms at different magnetic densities.
The spectrum of magnetostrictive waveform when the harmonic proportion is 30%.
When the harmonic content in the excitation increases, the magnetostrictive peak value will increase slightly, and the DC component will also increase slightly. The original non-coincident left and right magnetostrictive butterfly curves began to approach or even intersect. This is mainly the result that the third harmonic makes the magnetization curve produce “beam waist”, and the “beam waist” part gradually decreases or even coincides with the increase of harmonic proportion, resulting in the intersection of magnetostrictive butterfly curves. The variation of the magnetostrictive peak value of silicon steel sheet with magnetic flux density under different percentage of third harmonic excitation is shown in Fig. 12.

The peak to peak value of magnetostriction under third harmonic excitation with different percentage.
The phenomenon of DC magnetic bias is caused by geomagnetic storms, the elevation of neutral potential of power transformers or the unbalanced operation of HVDC unipolar transmission, which distorts the current waveforms in the power grid. This has a significant impact on the temperature rise and vibration of many important power equipment, such as power transformers, reactors and generators.
Hysteresis loops at different magnetic flux densities when DC bias magnetic field is 40 A/m.
Hysteresis loops with different DC biases at 1.2 T.
The BH curves of silicon steel sheet under different DC biased magnetic field.
The measurement of magnetostriction of silicon steel sheet under DC magnetic bias is based on the superposition of DC components under power frequency sinusoidal excitation. Because the magnetic field produced by DC bias current does not change with time, the magnetic field measuring coil cannot measure the DC component of magnetic flux density and magnetic field intensity in silicon steel sheet through the change of current or voltage. Therefore, the bias magnetic field intensity and magnetic flux density need to be calculated separately according to the applied current. When AC and DC excitation are injected into the measurement system at the same time, the excitation magnetic field can be expressed as follows:
In the above formula, H AC is the amplitude of AC magnetic field, H DC is DC bias magnetic field, and AC excitation magnetic field is 50 Hz sinusoidal periodic variation.
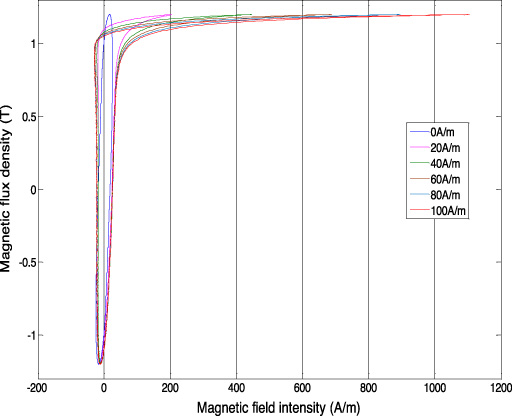
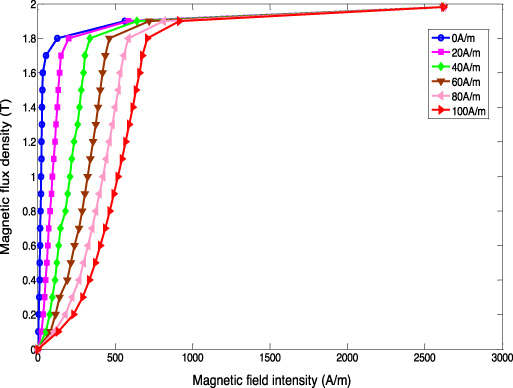
When the DC bias magnetic field is 40 A/m, the hysteresis loop of the silicon steel sheet is shown in Fig. 13. It can be observed that the DC bias magnetic field makes the whole hysteresis loop move up, resulting in the positive half-cycle saturation in advance. When the magnetic flux density in the silicon steel sheet is 1.2 T, the magnetic hysteresis loops under different DC biases are shown in Fig. 14. It can be seen that the greater the DC bias magnetic field, the greater the influence on the hysteresis loop early saturation of the silicon steel sheet. The BH curves under different DC bias magnetic fields are extracted, and the extracted BH curves are shown in Fig. 15. It can be observed that the magnetic conductivity of silicon steel sheet decreases with the increase of DC bias magnetic field, indicating that the DC bias magnetic field can make the magnetic conductivity of silicon steel sheet worse.
When the DC bias magnetic field is 20 A/m and 60 A/m, the magnetostrictive butterfly curve of silicon steel sheet is shown in Fig. 16(a) and Fig. 16(b), respectively. It can be observed from Fig. 16(a) that when the DC bias magnetic field is 20 A/m, the asymmetry of magnetostrictive butterfly curve is very serious when the magnetic flux density is small. With the increase of magnetic flux density, the asymmetry degree of magnetostrictive butterfly curve of silicon steel sheet decreases gradually. It can be observed from Fig. 16(b) that the increase of DC bias magnetic field makes the magnetostrictive butterfly curve asymmetry more serious, and the burr of magnetostrictive butterfly curve also increases a lot, indicating that the increase of DC bias magnetic field increases the degree of magnetostrictive distortion.
When the DC bias magnetic field is 20 A/m, the magnetostrictive waveforms and spectra at different flux densities are shown in Figs 17(a) and 17(b). It can be observed that with the gradual increase of magnetic flux density, the even component of magnetostriction concentrated on 0 Hz, 100 Hz and 200 Hz increases most obviously, and the odd component of magnetostriction concentrated on 50 Hz, 150 Hz and 250 Hz also increases. When the DC bias magnetic field is 60 A/m, the magnetostrictive waveforms and spectra under different flux densities are shown in Figs 17(c) and 17(d). Compared with the magnetostriction of silicon steel sheets with DC bias of 20 A/m, the increase of even magnetostrictive components on 0 Hz, 100 Hz and 200 Hz is very small, while the increase of odd magnetostrictive components on 50 Hz, 150 Hz and 250 Hz is very large. Therefore, it can be concluded that the addition of DC bias will significantly increase the odd frequency component of magnetostriction.
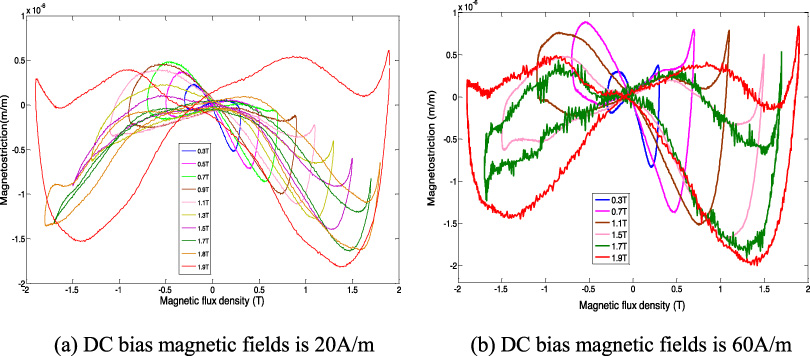
Magnetostrictive butterfly curves when DC bias magnetic fields is 20 A/m and 60 A/m.
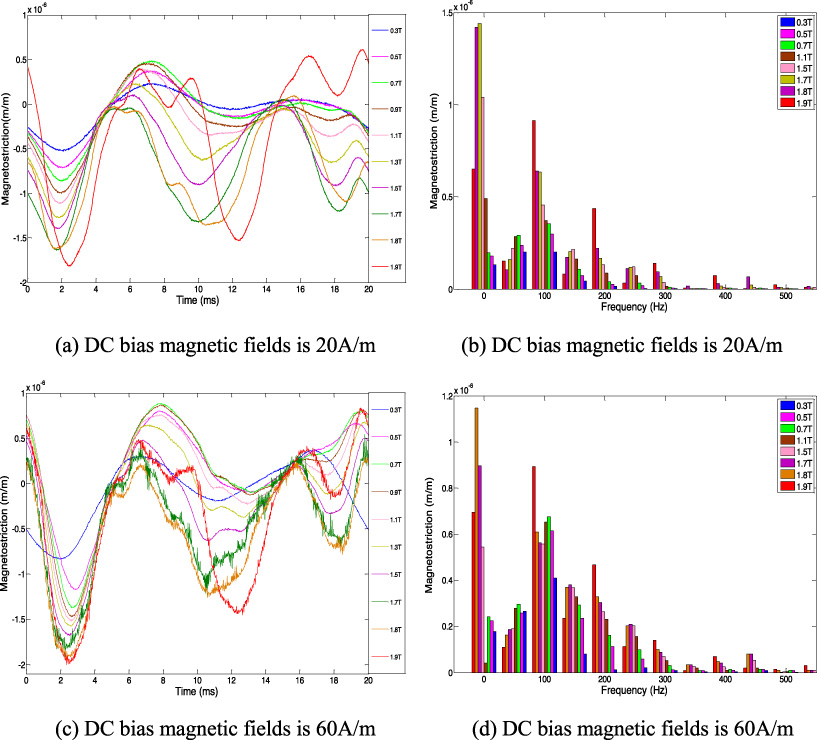
Magnetostrictive waveforms and spectrum when DC bias magnetic field is 20 A/m and 60 A/m.
When the magnetic flux density in the silicon steel sheet is 1.2 T, the bias magnetic fields of 0 A/m, 20 A/m, 40 A/m, 60 A/m, 80 A/m and 100 A/m are superimposed respectively, and the measured magnetostrictive butterfly curve and time domain waveform are shown in Fig. 18. It can be observed from Fig. 18 that the peak-to-peak value of magnetostriction increases with the increase of DC bias magnetic field, and the saturation increases gradually in the positive half-cycle, at the same time, the peak value of magnetostrictive peak and its waveform distortion are also increasing in the positive half-cycle. The magnetostrictive peak value under different flux density under DC bias is shown in Fig. 19. It can be observed that the magnetostrictive peak-peak curve gradually shifts upward with the increase of DC bias.
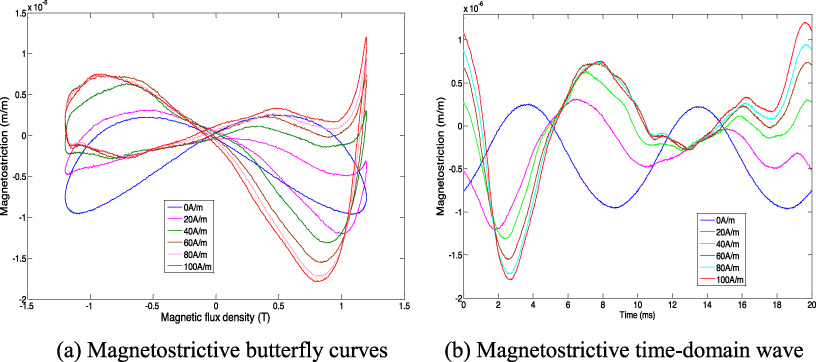
Magnetostrictive time-domain waveforms with different DC bias at 1.2 T.
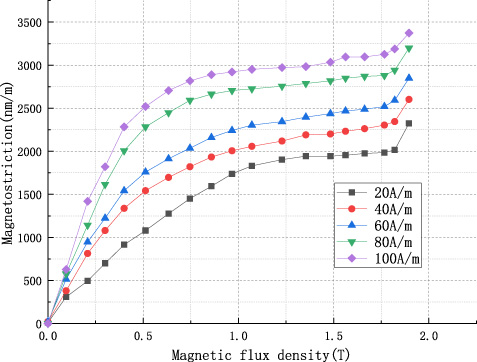
Magnetostrictive peak to peak curves with different DC biases.
The accurate measurement of magnetostriction is the basis for calculating the vibration of silicon steel laminated core. In this paper, the magnetostrictive properties of silicon steel sheet under sinusoidal, third harmonic, DC magnetic bias and non-sinusoidal excitation are studied by using laser magnetostrictive measurement system (MST500). The magnetostrictive butterfly curve, time domain waveform and frequency spectrum of silicon steel sheet under different excitation are compared and analyzed. The main conclusions are as follows: The magnetostriction of silicon steel sheet under power frequency sinusoidal excitation is mainly composed of DC component and 100 Hz component, and its amplitude is positively correlated with magnetic flux density, but it is non-linear. At the same magnetic field intensity, the magnetostriction perpendicular to the rolling direction is much larger than that in the rolling direction, so the magnetostriction perpendicular to the rolling direction cannot be ignored in the vibration calculation of power equipment core. The third harmonic excitation will increase the amplitude of magnetostriction of silicon steel sheet and cause the magnetostrictive time domain curve to produce high-order harmonic components, but the harmonics generated are not the second harmonic relationship of adding harmonic components, the addition of the third harmonic will significantly increase the even frequency components of magnetostriction. DC magnetic bias will increase the peak value of magnetostrictive peak and the asymmetry of magnetostrictive butterfly curve. These two factors are the main reasons for the increase of core model vibration caused by DC magnetic bias. The increase of magnetostriction caused by DC magnetic bias is proportional to the intensity of bias magnetic field, and the bias magnetic field will cause the silicon steel sheet to be saturated prematurely in the positive half-cycle. The addition of the DC bias will significantly increase the odd frequency components of magnetostriction.
Footnotes
Acknowledgement
This work was supported in part by National Natural Science Foundation of China under Grant 52007192. and in part by the Fundamental Research Funds for the Central Universities (2023ZKPYJD09).