
Abstract
One of the main cause of acoustic noise from iron core in electrical machines is magnetostriction. However, good reproducibility of magnetostriction measurement cannot be expected due to its ppm-order value. To measure the magnetostriction accurately, it is required to clarify principal factors affecting the measurement accuracy. In this paper, a high-resolution method of measuring magnetostriction by means of an open-type single sheet tester equipped with double laser Doppler vibrometers is investigated. It is revealed that the odd components of a magnetostriction waveform should be removed as noises because the reproducibility of odd harmonic components is low. To improve the reproducibility, the friction between a test specimen and a support plate installed under the specimen should be reduced. Furthermore, it is demonstrated that the developed measuring system can be also applied to magnetostriction measurement of Fe-based amorphous sheets.
Keywords
Introduction
Magnetostriction of electrical steel sheets is one of the main causes of acoustic noises of electrical machines. A single sheet tester (SST) equipped with a strain gauge has been used [1] to measure the magnetostriction. The strain gauge is directly pasted on a specimen and it may lead to low reproducibility. An SST with yoke, which forms closed magnetic path, is widely used for the magnetostriction measurement. However, electromagnetic force between the yoke and the specimen may have an influence on the measurement accuracy of magnetostriction [2]. On the other hand, using an SST without yoke, longitudinal magnetic forces may have an influence on the measurement accuracy of magnetostriction, although it can be expected to suppress the effect of friction forces. Since the value of magnetostriction is very small, high accuracy is required for its measurement. However, various factors affecting reproducibility of the magnetostriction measurement have not been clarified in detail.
In this paper, a measurement of magnetostriction by means of an open-type SST equipped with double laser Doppler vibrometers (LDVs) is investigated as a non-contact and high-resolution method. First, the magnetostriction of transverse direction of a grain-oriented electrical sheet is measured to verify the validity of the developed measuring system from the shape of measured butterfly loops. Next, we examine the influences of harmonic components of a magnetostriction waveform and friction between a specimen and the support plate installed under the specimen. Finally, it is demonstrated that the proposed system can measure the magnetostriction of Fe-based amorphous sheets, which is very thin compared with ordinary electrical steel sheets.
Structure of measuring system
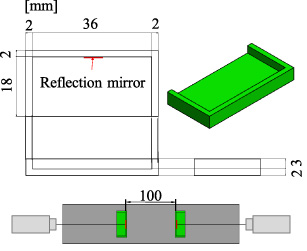
Figure 1 shows the dimensions of coil unit of the SST and schematic diagram of test apparatus. Double LDVs (V100: Denshigiken Co., Ltd., Japan) measure the velocities of two optical targets placed at different positions (distance between them: 100 mm) on the surface of the specimen simultaneously. Figure 2 shows the optical target. Its base is made of resin. As a reflection mirror, a normal adhesive reflection tape is used. The magnetostriction is calculated as the difference of displacements of two optical targets obtained through numerical integration of their velocities. This measurement method does not require clamping of the specimen. The magnetostriction is evaluated by its peak-to-peak value 𝜆p-p along the direction of applied AC magnetic field. To suppress environmental noise, the test apparatus is fixed on a vibration-free non-magnetic table. Rectangular specimens of M90-23P5 (GO) and M250-50A5 (NO) are measured, of which the dimensions are 60 mm × 360 mm. The exciting frequency is 50 Hz.
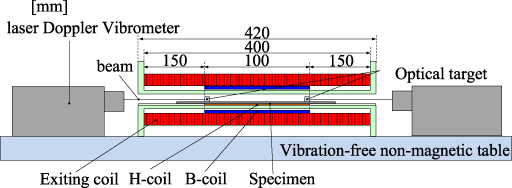
Dimensions of coil unit of SST and schematic diagram of test apparatus.
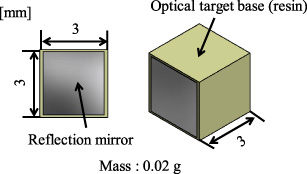
Optical target.
Magnetostriction measurement is considerably affected by environmental noise. Therefore, it is difficult to achieve higher reproducibility compared with iron loss measurement. To get enough reproducibility, the number of averaging is investigated. The appropriate number of averaging is evaluated under the condition of no excitation. “No excitation” means that all instruments are switched on, but a dial of potentiometer is set at zero, which is installed between an arbitrary waveform generator and a power amplifier. Figure 3 shows the effect of the number of averaging on the amplitude of magnetostriction 𝜆noise corresponding to the environmental noise. The more the number of averaging increases, the more 𝜆noise decreases. The number of averaging is set to be 500 from the standpoint of measurement time at which 𝜆noise is 9.74 × 10⁻⁹. Since the distance between the optical targets is 100 mm, 𝜆noise of 9.74 × 10⁻⁹ corresponds to the displacement of 1 nm. This number of averaging is much larger than usual magnetic property measurement such as measurement of iron loss.
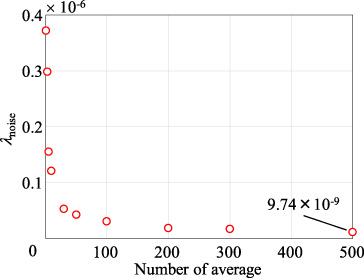
Effect of the number of averaging.
It is known that the shape of a butterfly loop of GO in the transverse direction (TD) has a form similar to a letter “V” with narrow wings from the viewpoint of magnetic domain behavior [3]. Therefore, the magnetostriction of GO in the TD is measured to confirm the validity of the proposed measuring system shown in Fig. 1. The flux density is detected by a B-coil and its amplitude B m is controlled from 0.5 T to 1.5 T at intervals of 0.1 T under the sinusoidal flux condition. Figure 4 shows the butterfly loop of GO in the TD. Since the shape of the butterfly loop is close to a letter “V”, it seems that the proposed measuring system can be applied to the magnetostriction measurement of electrical steel sheets. Its measurement accuracy is sufficiently good.
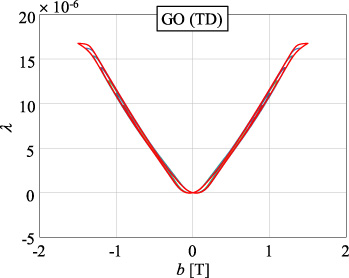
Butterfly loop of GO in the TD.
The magnetostrictions of GO and NO in the rolling direction (RD) are measured five times for each specimen. B m is controlled from 0.5 T to 1.7 T at intervals of 0.1 T under the sinusoidal flux condition. Figures 5 and 6 show the butterfly loops of GO and NO in the RD. The magnetostriction waveform does not have the odd harmonic components theoretically. However, the butterfly loops become bilaterally asymmetric. It means that the measured magnetostriction waveforms contain the odd harmonic components. To examine the influence of each harmonic component on the peak-to-peak value of magnetostriction 𝜆p-p, the harmonic components of the measured magnetostriction waveforms are calculated by using FFT.

Butterfly loop of GO in the RD.
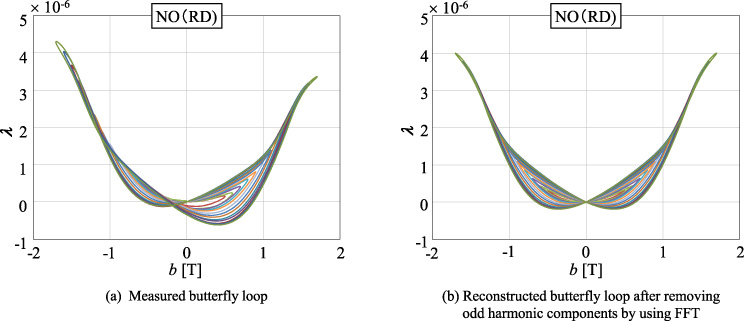
Butterfly loop of NO in the RD.
Figure 7 shows the relative standard deviation (RSD) of amplitude 𝜆
n
of each harmonic component. The RSD of 𝜆
n
is defined as follows:
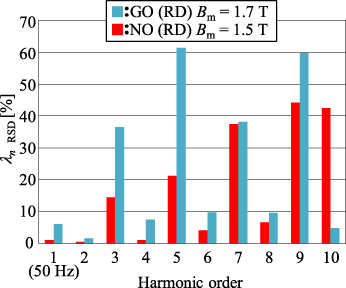
Relative standard deviation of the 𝜆 p-p of each harmonic order amplitude 𝜆 n .
The odd harmonic components tend to have a larger relative standard deviation than the even harmonic components. Therefore, the odd harmonic components can be regarded as noise and be removed. Figure 8 shows the ratio of 𝜆 n with respect to 𝜆p-p.

Ratio of 𝜆 n with respect to 𝜆 p-p.
The values of the 11th and higher harmonic components are less than 0.05 ×10⁻². The influence of those harmonic components of the magnetostriction waveform on 𝜆p-p is negligibly small. However, Fig. 7 shows the first-order component has a smaller relative standard deviation than the other odd harmonic components. Furthermore, Fig. 8 shows the ratio of amplitude of the first-order component with respect to 𝜆p-p has larger than those of other odd harmonic components. To investigate this tendency, the measurement of magnetostriction is carried out by using two different LDVs of other manufacturers. The measured results did not show a similar tendency about the first-order component. This result indicates that the first-order component may occur due to the internal analog circuit of the V100. On the other hand, the magnetostriction waveforms reconstructed by removing odd harmonic components are very close to each other. Therefore, any of the LDVs are available when removing odd harmonic components.
To investigate the influence of friction between the test specimen and the specimen support plate made of glass epoxy, a thin polytetrafluoroethylene (PTFE) sheet with approximately 0.1 mm thickness is pasted on the support plate. The sheet has a low coefficient of friction. We compared measured results with and without the sheet. The magnetostriction of GO and NO in the RD are measured five times for each specimen. B
m is controlled from 0.5 T to 1.7 T at intervals of 0.1 T under the sinusoidal flux condition. Figure 9 shows the standard deviation of 𝜆p-p. The standard deviation 𝜆σ of 𝜆p-p becomes smaller when the PTFE sheet is inserted. This tendency results from slightly different contact state between the specimen and the PTFE sheet or support plate. Thus, the reproducibility of magnetostriction measurement depends on friction between the specimen and the specimen support plate. When using the PTFE sheet,
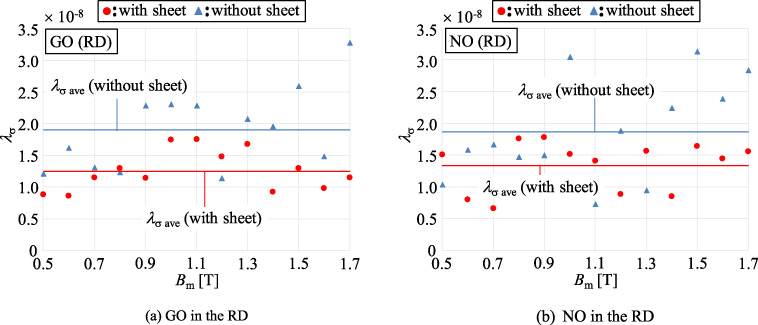
Standard deviation of the 𝜆 p-p.
The open-type SST does not have a problem of electromagnetic force between the yoke and specimen. Therefore, the proposed measuring system is suitable for magnetostriction measurement of a specimen which has low rigidity due to its thickness such as Fe-based amorphous sheets (thickness: about 25 μm). Metglas® 2605HB1M (AM) in the RD is measured five times for each specimen. B m is controlled from 0.5 T to 1.6 T at intervals of 0.1 T under the sinusoidal flux condition. The magnetostriction of AM is known to be positive [4], but the measured result of AM shows negative magnetostriction when using the same optical target base as that for the electrical steel sheet. This is caused by the phase shift of the magnetostriction waveform with respect to the magnetic flux density waveform. The phase shift is influenced by the out-of-plane vibration. Therefore, the optical target base for an AM shown in Fig. 10 is specially prepared, of which the shape is found through time consuming trial and error to reduce the influence of out-of-plane vibrations. Figure 11 shows the butterfly loops of AM. By selecting the proper shape of the optical target base, it is possible to measure magnetostriction of AM. 𝜆σ is 6.81 × 10⁻⁸ for AM, which is the same order as those of GO and NO.
Installation situation of optical targets for AM.
Finally, the relationships between magnetostriction and flux density of GO in the RD and TD, NO in the RD, and AM in the RD are shown in Fig. 12. Magnetostriction mainly occurs by 90° domain wall motion and magnetization rotation. In other words, it hardly occurs by 180° domain wall motion. Therefore, the magnetostriction of GO in the TD is much larger than that of GO in the RD.

Butterfly loop of AM in the RD.
This paper investigated several factors that affect the magnetostriction measurement. As a result, it is confirmthe reproducibility of the odd harmonic components in the magnetostriction waveform is low. Therefore, those components should be removed as noise. Moreover, the influence of the 11th and higher harmonic components of the magnetostriction waveform on 𝜆p-p is negligibly small. Furthermore, to measure the magnetostriction with higher reproducibly, the friction between the specimen and the specimen support plate installed under the specimen should be as small as possible. Therefore, a sheet having a low coefficient of friction should be pasted on the support plate. The proposed measurement method of magnetostriction has very high effective resolution. Therefore, the method can be applied to the measurement of relatively small magnetostriction. Therefore, the method can be applied to the measurement of relatively small magnetostriction. Finally, it is demonstrated that the measuring magnetostriction of an amorphous sheet is also possible with this developed measurement system by selecting the proper shape of the optical base.
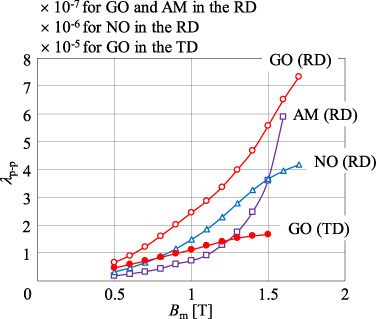
Relationship between magnetostriction and flux density.
To investigate the influence of yoke on the measurement accuracy of magnetostriction, we will compare the measurement results of magnetostriction using an SST with and without yoke.