
Abstract
The particle movement speed in the pipe of an existing dust measuring device is too small, and the detection in the center area of the pipe is not sufficiently sensitive. According to the intake mode of the cyclone separator, here a new side inlet pipeline is designed that is oriented from the incident mode of the straight pipe. An experimental model was established in Gambit2.4, and the numerical simulation was performed in Fluent6.3. Different dust particle diameters were simulated, and velocity cloud and pressure cloud diagrams of the middle position of the device pipe were obtained. Compared with the velocity data of the straight tube and the side tube, the velocity value of the particle passing through the side tube was better than that of the straight tube. This improved the velocity of the particles and also reduced the settling of the particles. The probability of friction collision of the dust particles in the tube increased, meaning that their induced charge also increased. MATLAB was used to calculate the electrostatic induction, revealing that the charge of the particles in the improved device increased significantly. Therefore, the improved device can effectively improve the measurement accuracy of dust at low concentrations, and for small particle sizes.
Keywords
Introduction
China has a rich supply of coal resources, but its extensive use of coal has also given rise to many problems regarding productivity and life. For example, coal mining produces a large volume of mine dust, which is inhaled by miners as they work; this is harmful to their health. Mine dust can also cause harm through combustion and explosions; when there is a high concentration of mine dust in the air, it is easy for explosion accidents to occur, resulting in casualties. Therefore, it is vital to be able to detect high mine dust concentrations to prevent harm caused by it [1–4].
The method of measuring gas–solid two-phase flow parameters based on electrostatic induction technology has long been applied [5,6]. Murnane et al. studied the induction mechanism of the friction electrification of solid particles in a gas–solid two-phase flow, and proposed that the mirror charge method be used to describe the relationship between induced charges and solid particle charges on electrodes [7]. Jiange et al. established a charge induction model between dust particles and a rod electrode [8]. Measuring dust concentration via electrostatic induction is advantageous due to its durability, reduced maintenance requirements, and strong adaptability. However, the accuracy of these measurements at low concentrations and for small particle sizes are greatly reduced.
In order to solve the problem of inaccurate measurement for this existing device, improvements are suggested in this study. By changing the incident mode, the dust particles are forced to rotate along the pipe wall. The rotation of the wall means that most of the dust particles are distributed along the inner wall of the pipeline, with only a few located in the center. This addresses the difficulty of detecting particles in the middle region, thus improving the detection accuracy of the device for low concentrations and small sized particles.
Analysis of the main structure and problems of the existing dust measuring devices
Ring electrostatic sensor
Professor Yan Yong of the Teeside University proposed a mathematical model for an annular electrostatic sensor [9]. The induced charge of the ring electrostatic sensor can be calculated, as shown in Eqs (1) and (2):
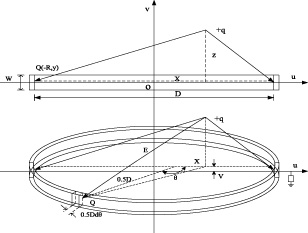
Mathematical model of the annular electrostatic sensor.
The straight pipe equipment of the existing device includes the air inlet, straight pipe, testing equipment, pumping equipment, and the outlet. Its structure is shown in Fig. 2.
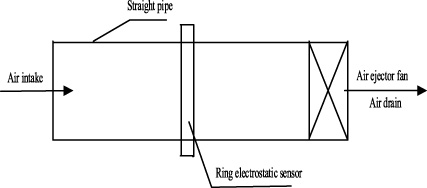
Diagram of the existing straight tube structure.
Dust flows from the air inlet into the straight pipe. In the pipeline, movement of the particles along the wall and movement of particles past other particles will cause friction and collisions. This produces static charges, which can be detected by the ring electrostatic sensors nested in the middle of the pipeline. The ring electrode is close to the inner wall of the pipe, and when the electrostatic charge moves through the ring electrostatic sensor, a corresponding induction signal will be generated. After amplifying the induced signal, the parameters of dust concentration can be obtained [10,11].
Although the structure of the device is simple and it is easy to operate, shortcomings still exist. First, because the dust particles carry very weak electricity, a large amount of dust enters the straight pipe, and there is insufficient friction collision in the limited space. This means that the electrostatic charge caused by the friction collisions is also very small. Second, the detection device is embedded in the circular electrostatic sensor, which is arranged outside the pipe wall of the middle section of the straight pipe. Particles flowing through the tube wall are easier to detect than the central area. A large number of dust particles in the straight pipe pass through the central area of the pipe, causing the particle concentration to not be accurately detected. When the dust concentration is low, the measurement error will be more obvious.
Design principle of the measuring device
Considering the defects of the existing straight pipe device, the structure of the straight pipe device is improved in this study. Referring to the intake mode of the cyclone separator, the incident mode of dust particles in the plane of the original straight pipe inlet, perpendicular to the dust particle channel, here is changed to the side of the first end of the dust particle channel. Further, the inlet plane is situated parallel to the dust particle channel, and tangential to the pipe wall. Due to the different incident modes, the dust particles are forced to rotate along the pipe wall, that is, the rotating attached wall. The dust particles rotate on one side of the inner wall of the tube, which increases number of particle collisions. By increasing the pipe length, the trajectory paths of the particles are also increased, which increases the movement of the particles. This design also increases the charges of the particles to a sufficient level. This occurs due to the rotating action, which means that the particles tend to stay near a pipe wall, avoiding the middle area (which is difficult to detect). The concentration of the unit cross section of the dust particles is also increased, More conducive to the detection of particulate matter concentration. The dust particles then exit the pipe from the air outlet [12,13]. The newly-designed dust concentration measuring device is referred to herein as the side inlet pip; its structure is shown in Figs 3 and 4.

Main view of side entry.
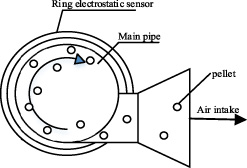
Left view of side into tube.
A three dimensional (3D) model of pipeline was established using gambit2.4. The simplified meshing model is shown in Fig. 5.

Grid division.
First, the main pipe, inlet, and front extension of the model were drawn. Then, the stereoscopic model was meshed, (each mesh area is 0.5 mm2); the other parameters were kept at their default values. Finally, we defined its boundary type, and set the portion of the pipe extension as an entry, which is of type (VELOCITY_INLET). The right side of the pipe is an egress, and its type is (OUTFLOW). The other default is the pipe wall (WALL). We then outputted and saved the structural model of this improved device.
In this design, the Fluent6.3 model was used to simulate and run under a standard atmospheric pressure environment. The Eulerian model was used to simulate the dust particles numerically, and the k-epsilon model equation was used to calculate the data. The relative data of the dust parameters were set, the thermal conductivity was 0.3 w/(m ⋅ k), the density was 2600 kg/m3, the specific heat capacity was 1200 j/kg, the viscosity was 1.8e-05 Pa ⋅ s. Regarding the physical properties, air was defined as the main phase, and dust as the second phase. The boundary conditions of the inlet were also defined. The turbulent intensity of the mixture was 5, the hydraulic diameter was 0.5, the air velocity was 4 m/s, The other values were kept as their default.
The dust particles will be affected by the inertia force, lift force, and the drag force of the gas in motion. The equation of the related force is as follows:
The momentum equation for the particle variation is as follows [14]:
In Eq. (4), μ is the gas dynamic viscosity (Pa.s), Δt is the time step (s)
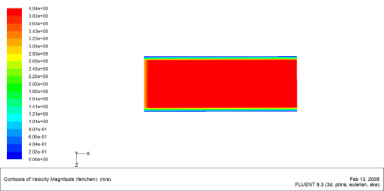
When the model was simulated by Fluent6.3, the inlet velocity air was 4 m/s, the dust velocity was 3 m/s, and the other conditions remained unchanged. Only the particle size of the dust particles was changed, and many experiments and calculations were carried out. The dust concentration was set to 5 mg/m3. In order to make the data easier to read, the XZ surface was created in the planes in 3D to view the calculation results. A particle size of 1 μm was taken as an example, as shown in Figs 6 and 7.

Side entry velocity cloud diagram.
Velocity data for different pipelines.
Straight tube velocity cloud diagram.
From the velocity cloud image, it can be seen that the dust was mainly distributed near the pipe wall, far from the middle area, which is difficult to detect. The velocity of dust was at its largest at about 1/3rd of the length of the tube from the inlet side. The motion was at its most intense here, and the wall-attached effect was at its strongest, so the circular electrostatic sensor was installed at the outer side of the inlet end of the side inlet tube, at about 1/3 of the length.
In the velocity cloud picture, the data of the straight tube and the improved device side into the pipe are shown in Table 1.
According to the data of different particle sizes shown in Table 1, a velocity comparison diagram of the straight tube and its side tube was drawn, as shown in Fig. 8. The induced charges in the straight tube and the side tube under different particle sizes were calculated by using MATLAB and the induction charge formula given in Eqs (1) and (2), as shown in Fig. 9.

Velocity contrast chart.
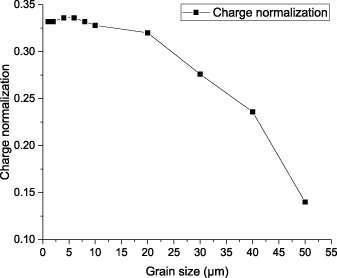
Charge normalization.
It can be seen from the velocity comparison diagram that the improved velocity value of the side entry tube was obviously higher than that of the straight pipe, and the velocity value was improved more significantly for particle sizes below 10 μm. According to the induced charge trend graph, the dust particles produced a higher inductive charge when entering the tube on the side, and the inductive charge increased when the particle size decreased. Through comprehensive analysis of the velocity and inductive charge, it is clear that the overall effect of the side entry tube is better, which is beneficial to the accuracy of the measurement obtained.
Through research and analysis of the structure of the existing straight pipe device, it was found that there are still shortcomings with the current design. At low concentrations, the charge of the dust particles is low, and detection in the intermediate region is insufficient. This limits the measurement accuracy.
A structural model of the side tube device was established using gambit2.4, and said model was simulated using Fluent6.3. The particle size of the dust was varied, and the other values were kept unchanged. A velocity cloud diagram of the side tube were obtained, and then the corresponding velocity data values were calculated. The charge of the particles was calculated according to the induction charge formula.
Comparing and analyzing the simulated data revealed that the velocity of the side tube were significantly higher than in the straight pipe, meaning that the dust particles could move more fully at the side into the pipe. The friction collision between the particles was therefore more intense, which increased the induced charge of the particles and improved the measurement accuracy of the dust concentration.