



Abstract
The accuracy of the existing dust measurement device comprising a straight pipe is not sufficiently high for low particle speeds. In this paper, a measuring pipe based on the Coanda effect is designed, an experimental model is established using Gambit 2.4, and a numerical simulation is performed using Fluent 6.3. In this way, speed nephograms at the middle section of the device pipe were obtained for different dust particle sizes. By comparing the velocity data of a devices comprising a straight tube, a venturi tube, or a Coanda tube, it was found that the velocity of the particles passing through the Coanda tube was higher than that for the other tubes. Therefore, the probability of frictional collision within the Coanda tube increases, thereby increasing the inductive charge of the particles. By calculating the electrostatic induction of the particles using MATLAB, it was found that the charge carried by the particles in the improved device significantly increased (25% on average). It is concluded that these findings are of significance for designing the structure of novel dust concentration measurement devices.
Introduction
With the acceleration of the country’s industrialization process, the living environment has also changed. In processes such as mining, rock blasting, and building heating, a significant amount of suspended particulate matter is produced, posing a serious risk to health. There exist many methods for dust detection, such as membrane weighing, beta-ray-based sample testing, crystal vibration, and micro-oscillation balance [1–4]. Further examples include the non-sampling light transmission method, the light scattering method, the charge sensing method, the flow rate prediction method, and the static/dynamic pressure balance measurement method [5–8]. Among them, the membrane weighing method is a the standard soot sampling method designated by the State; the national standard stipulates that, if particle concentration is measured by other methods, the membrane weighing method must be used as the reference.
At present, scholars at home and abroad have conducted significant research on electrostatic induction to measure the properties of gas–solid two-phase flow. Electrostatic induction based methods to measure dust concentration rely on the characteristics of solid dust particles; the main factors affecting particle charge in the process of particle conveyance are particle material, velocity, and particle size [9–11]. The collision of different materials with each other produces a static charge; under identical conditions, the higher the collision friction of the faster particles, the greater the charge generated from this process, and the greater the probability of collision within the pipe, the greater the corresponding charge [11–13]. Electrostatic induction based measuring devices present the advantages of high durability, low maintenance, safety operation, and high reliability. However, when particles present a relatively low charge, the inductive charge is also low, and the accuracy of the dust measurement results is significantly reduced.
The Coanda effect was proposed by the Romanian scientist Henry Coanda during his experiments on aircrafts performed in the 1920s. In 1981, G. Dipley and Kesuman used the Coanda effect to ventilate the heading face of a West Germany coal mine, Murai et al. proposed the application of the Coanda effect to a fluid injection system attached to the wall in 1989, and Wang Delong used this effect to design the ventilation system of Japanese public residential kitchens in 1992. In 1995, Zhu Hengli used the Coanda effect to design a new type of inertial force grader. In recent years, domestic scholars have employed the Coanda effect to design flow measurement devices for gas–liquid two-phase flow [14,15]. Therefore, in this paper, a gas–solid two-phase flow pipeline based on the Coanda effect is designed as well as a Coanda pipeline for gas–solid two-phase flow based on the Coanda effect. In addition, the velocity and particle size of the dust are simulated, the corresponding electrostatic induction is obtained, and the effectiveness of the system is verified.
Existing dust measuring devices
The existing dust measuring device based on electrostatic induction consists of a straight pipe. When dust particles enter the pipeline due to the action of air flow, collision, friction, and extrusion phenomena take place between particles and between particles and the pipe wall increasing the inductive charge of the particles. Detection equipment is used to measure the induction charge so as to obtain the concentration of dust particles [6–12].
The required components to set up this device include air inlets, dust passages, straight pipes, testing equipment, pumping equipment, and outlets. The structure of this device is shown in Fig. 1; in experimental devices D = 6 cm and L = 16 cm. Although this device is simple in structure and easy to operate, when dust particles present extremely low charge because a large amount of dust enters the pipeline and the limited space hiders friction collision or when dust concentration is low, the measurement accuracy of this device is not sufficient.

Structure of the existing dust concentration measuring device comprising a straight pipe.
Because of the straight structure of the pipeline, when the air flow containing dust passes through the straight pipe, the velocity of the gas is not changed because the cross-sectional area remains constant. Therefore, the particles are not accelerated, friction due to collision is reduced, and the induction charge of the particles does not increase significantly.
When measuring dust with small particle size and in low concentrations, the straight pipe cannot be used to measure the concentration of dust particles in a timely and accurate manner. Moreover, as the detection device is a ring-shaped electrostatic sensor mounted in the middle section on the outside wall of the pipe, when a relatively large number of particles pass through the central area of the pipe, the particle flow is high and the particle concentration cannot be accurately measured. In view of the problems related to the existing measuring device, the structure of the model is established and the existing device is optimized by performing simulations, so as to improve its measurement accuracy.
Design principle of the measuring device
The Coanda effect is also known as the wall attachment effect, that is, the fluid (water or air) tends to divert from the original flow direction and flow along a protruding object [15]. The principle of this effect is presented in Fig. 2. As the particle flow rate and collision on curved wall faces present a significant impact, by increasing the velocity of the particles, electrostatic induction increases. For particle concentration measurement in this paper, this approach undoubtedly constitutes a design innovation that increases the induced charge of the particulate matter and improves dust concentration measurement accuracy.

Coanda effect principle.
The structure of the designed dust concentration measuring device is shown in Fig. 3. The parameter value of the Coanda tube (d) is the same as that of the straight tube (3 cm). The dust measurement channel is a straight channel with a spoon-shaped tube in the center and the extraction fan is located at the end of the channel. In the dust measurement channel, air enters though the inlet port, passes through the Coanda pipe and the spoon-shaped tube, and leaves at the outlet.
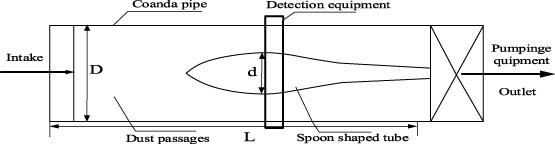
Structure of the improved device.
Because of the particular design of the dust measurement channel, the air flow in the spoon-shaped tube produces the Coanda effect, the air flow rate increases, and the pressure increases sharply coupled with the effect of the pumping fan. Therefore, the gas can flow through the measurement channel at high speed, increasing collision friction between particles and between particles and the pipe wall. Consequently, the induced charge of the dust particles increases and forces the particles to move near the pipe wall, increasing particle concentration measurement accuracy.
In order to render the results of the experiment more intuitive and clear, simulations were performed using a three-dimensional (3D) stereo model to simplify the import and export of its channel. The grid contained 196 264 nodes, 61 890 hybrid grids on the tube surface, and 2 136 395 hybrid grids on the inner surface. After defining the mesh for the stereo model by mesh division, the boundary conditions of the model were set by inputting the inlet velocity (free flow boundary type) and selecting the pipe wall. The structural model of the improved device was established using Gambit 2.4.
The dust channel of the device was modeled as a combination of a cylindrical tube and a spoon-shaped tube. In order to analyze the problem more clearly, the simulation was carried out using a 3D stereo model. The mesh was divided using the Tet/Hybrid type and the area of each mesh element was 0.5 mm2. The simplified mesh model used is shown in Fig. 4.

Grid division of the proposed model.
The model simulation was carried out in Fluent 6.3. The standard atmospheric pressure was used as the operating environment, the Eulerian model was used to carry out the numerical coupling of the gas–solid two-phase flow, and the 𝜅-epsilon model equation was used for the calculations; the dust-related parameter data were established, and the other parameters were defaulted. Physicality was used to define the main phase of air, define dust as the second phase, define the speed entry boundary conditions, calculate the channel inlet hydraulics according to the model’s hydraulic diameter and the model’s monomer inlet size, and set the turbulence strength of the mixture to 5; the hydraulic diameter was 0.5, air velocity was 4 m/s, dust velocity was 3 m/s, the particle volume fraction was 0.015, the volume relaxation factor was 0.5, and the other parameters were not modified. Convergence accuracy was set to 0.001. Dust concentration was set to 5 mg/m3 to improve the readability of the data and the XY surface was created on 3D planes to view the calculation results. Different dust particle sizes were used (1 μm, 10 μm, and 50 μm) as shown in Fig. 5.
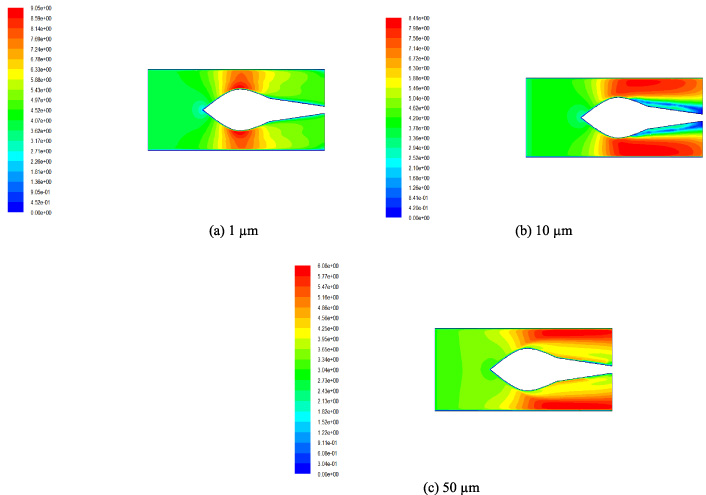
Velocity nephograms for different particle sizes.
As the detection device’s ring-shaped electrostatic sensor performs measurements where the middle section of the Coanda pipe is, the speed values at the middle segment of the channel are measured.
Velocity data for devices presenting different tubes
Table 1 presents the data obtained through simulation and computational analysis for the existing device with a straight tube and a venturi tube previously obtained by the project team, and that for the improved device featuring a Coanda tube. The comparison of velocity data shows that the speed of air in the improved device comprising a Coanda tube is significantly higher for the particle size of the measured particles, showing that particle movement is intense and prone to collision and extrusion. In the Conda tube, the speed is higher than that in the straight tube, which implies that the particles move more in the cavity, thereby increasing collision friction between particles. In comparison with the device comprising a venturi tube previously studied by the project team, the speed in the Coanda tube is also higher. Therefore, it is confirmed that the Coanda tube is more effective at increasing the speed of particles, and also present certain advantages that are conducive to higher dust concentration measurement accuracy.
For the calculation and analysis of induction charge, the following formulae can be used:
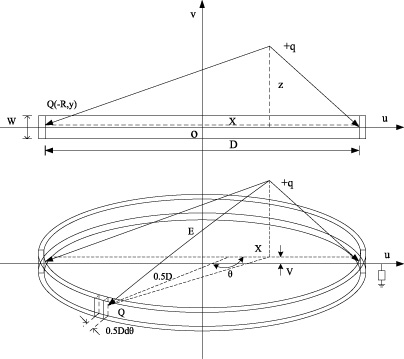
Mathematical model of ring electrostatic sensor.
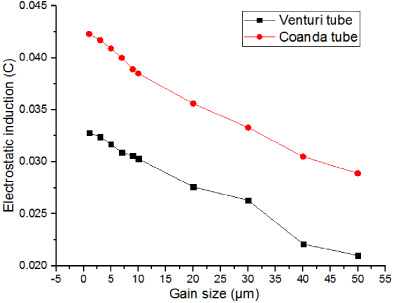
Electrostatic induction as a function of particle size.
Using the formulae presented above, the velocity and induced charge for the device presenting a venturi tube and the improved device comprising a Coanda tube were calculated using MATLAB (see Table 1). The variation of induced charge with different particle sizes is shown in Fig. 7; it can be seen that the induced charge of the particles in the Coanda tube is greater than that for the particles in the venturi tube. As the velocity of the particles increase, their electrostatic induction also increases, augmenting the overall induced charge of the dust by 25% on average. This finding presents relatively high significance for the design of dust concentration measuring devices based on the electrostatic induction method.
(1) A brief introduction is presented, in which the existing dust concentration measurement devices based on electrostatic induction are mentioned, the main structure of the device featuring a straight pipe is provided, and the advantages and disadvantages of this device for measurement at low dust concentrations are discussed, highlighting that measurement at the middle section of the device is not adequate to attain high accuracy. In view of these limitations, computation simulation is used to improve the structure and optimize the existing device, and thus increase its measurement accuracy.
(2) By referring to the literature, the Coanda effect is used to optimize the existing measuring device, the model of the improved device is established using Gambit 2.4, and the ideal experimental environment and experimental parameters are used as the research background. In the simulation experiments, a 3D stereo model is used to simplify the import and export of its channels. Using Fluent 6.3 for the simulation model, the geometric characteristics and calculation network are established, so as to obtain the velocity nephograms of the dust particles in the middle section of the Coanda pipe for different particle sizes and thus input that data into the induction charge formulae to obtain the charge of the particles.
(3) The electrostatic induction of the particles is analyzed and the electrostatic induction of the Coanda tube is processed. The electrostatic induction of the particles in the Coanda tube is higher than that of the particles in the venturi tube or the straight tube, indicating that the particles move more in the cavity, increasing collision friction between them. According to the calculated induction charge data, the improved device increases the induction charge of the particles by 25% on average. This indicates that the proposed device presents higher accuracy for dust concentration measurement. Although this improvement has been achieved, the optimal pipe diameter ratio for measuring more accurate pipes has not been obtained yet; therefore, further research should be conducted in this area.
