
Abstract
Reducing induction motor losses is very important because of the fulfilment of increasingly stringent requirements set by international regulations for reducing electricity consumption. Since core losses begin to dominate in motors operating at higher frequencies the exact calculation becomes more and more important. The common view is that losses due to higher harmonics caused by stator and rotor slotting constitute an important part of losses in the motor core. Proper calculation of the core losses requires inclusion both hysteresis and eddy current phenomena. For the hysteresis simulation, method included in package Opera 3D has been used. Using that model it was possible to investigate flux behavior at high frequency like as for higher harmonics field. Next part is focused on practical determining of proper method for higher harmonics losses limitation.
Introduction
Core losses are very important in induction machines design, especially in applications where iron losses have a negative influence on the performance, e.g. high-speed or time-varying speed machines. For years, the authors have worked for improving methods of losses calculation in induction motors [1,2]. These methods have to be very accurate but also very fast. For this reason, the emphasis was on analytical methods, which benefit from a number of simplifications and omit a number of phenomena. Therefore, the method of perfecting analytical methods is the field methods or experiment that allow us to look more closely at physical phenomena. Due to the computational cost, Finite Element 3D analysis is used only in specific cases. The 3D solutions were mainly related to problems occurring in high power machines and related to the current flow through the rotor sheets due to the skew of the slots or the losses due to the magnetic flux from the stator end-windings [3–8]. Usually, in 3D simulation, magnetic core is considered to be homogenous and different homogenization methods are used to model the laminated core [9–11]. In the literature, a whole series of publications on the calculation of losses in the core of induction motors can be found.
The general view is that the losses from higher harmonics caused by the occurrence of stator and rotor slots constitute an important part of the losses in the motor core. The second view, which is slowly perpetuating in the literature, is the statement that the losses in the core grow with the load [12].
The calculation methods are well specified for low frequencies. The losses in the core consist of hysteresis and eddy current losses. The hysteresis phenomenon has been studied for several years and can be represented by a variety of models: complex reluctivity [13], energetic [14], Preisach [15–17] and Jiles-Atherton [18,19]. Only few cases use a 3D model with the inclusion of lamination [20,21]. This is obviously associated with a very large calculation effort. An additional argument pointing to the lack of advisability to consider phenomena in laminations is the statement, not fully accurate as indicated by [22], that eddy currents don’t affect the field distribution in the core [23]. Several 2D solution introduce combined hysteresis and eddy-current model [22,24–26], but practically the majority of solutions that don’t take into account the skin effect in sheets. The skin effect causes a complete change in the description of eddy current losses. Moreover, in rotating machines, the magnetic flux is often forced to flow through ferromagnetic narrow strips (teeth, bridges over closed slots, etc.) [27]. In these cases, the effects of the eddy current component along the lamination thickness are not negligible. In the case of harmonic analysis occurring in the motor, the problem consists of determining the number of harmonics that are involved in the creation of losses [28].

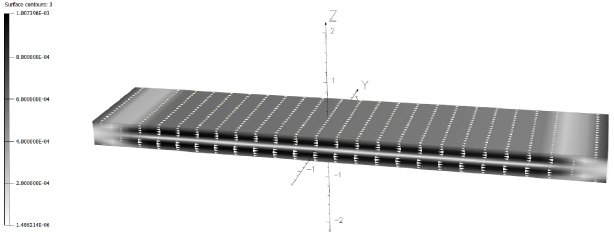
Basic dimension of the sample (R1 = 400 mm, R2 = 420 mm, mean path length is 1.29 m) – a; and magnitude of flux density on the surface of the sample – b.
Distribution of eddy currents inside of one of package sheets.
This paper first tested the method of considering hysteresis using a tool built into the Opera package. Then, a three-dimensional model was used to investigate the phenomenon of high frequency flux penetration into the rotor package. The conclusions were partly used in the method of determining core losses, taking into account higher harmonics.
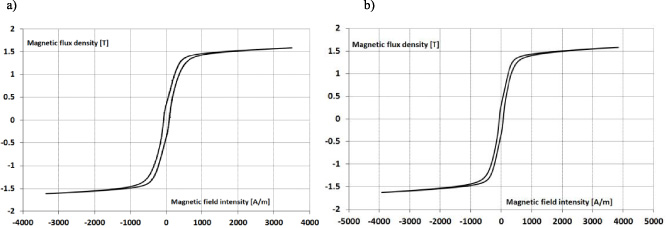
Measured (for frequency 5 Hz) major symmetric hysteresis loop for a – M470-50A and b – M270-35A.
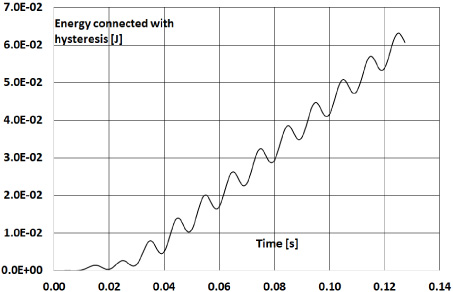
Distribution in time of energy connected with hysteresis calculated for 50 Hz in the sample for magnitude of flux density equal 1 T.
For the hysteresis simulation, method included in package Opera 3D has been used [29]. In this approach, the magnetic behaviour is considered as a trajectory B(H) determined with a measured major symmetric loop [30]. The method is based on the interpolation of the major symmetric loop, together with the empirical Madelung rules for the behaviour of minor hysteresis loops. A list of turning points is kept for each finite element and the list is updated by the addition or deletion of points as the simulation proceeds. The model includes the more complicated issues of nested minor loops and the “wiping out” of minor loops, which occurs when the B(H) trajectory goes through an earlier turning point. The model also recognizes oscillating fields and minimizes the storage of turning points in that case.

Comparison of specific core losses against frequency for magnitude of magnetic flux density equal 0.5 T calculated by hysteresis model and measured.

Model of induction motor lamination.

Distribution of magnitude of high frequency flux density for two for two frequencies (105 kHz – left column and 175 kHz – right column) with: only high frequency field – row 1 and with DC field of 1,7 T – row 2. At the top of each distribution, the ratio of calculated core losses, in shown part of the rotor tooth, according to case 105 kHz.
The first part of the work focuses on checking the correctness of the model. For this purpose, the measuring system described in [31] was used.
The model consists of a laminated ring core (with a weight of 978 g and made with 20 laminations of non-oriented electrical steel M470-50A of 0,5 mm thickness separated by 0.02 mm thick airgaps), a toroidal 646 turn coil and M270-35A with the thickness of 0.35 mm, 28 laminations, mass 956 g, a toroidal 670-turn coil with dimension shown in Fig. 1 which shows an example of solution for average flux density of 0,5 T. Figure 2 shows distribution of eddy currents inside of one of packaged sheets.

Distribution of magnitude of flux density for constant current flow but with frequency of a – 350 Hz, b – 7000 Hz, c – 52 500 Hz and d – 175 000 Hz.

Average value of magnetic flux density in the sample volume against frequency.
The basic design data for investigated motor

Core losses in top part of the sample against frequency.

BH curve measured for M270-35A.

Specific core loss versus flux density for different frequencies for M270-35A.

Magnitude of magnetic flux density for investigated motor fed from inverter by 350 Hz at load condition.

Stator core losses for higher harmonics up to 100 (basic – first harmonic losses included equal 20 W, higher harmonics losses equal 24.7 W).

Stator core losses for higher harmonics from 100 to 200 (sum of all losses 0,85 W – 1,9% of total losses).

Rotor core losses for higher harmonics up to 100.

Rotor core losses for higher harmonics from 100 to 200.

Average value of the magnitude of magnetic flux density in stator core (basic harmonic excluded) for higher harmonics up to 100.
The condition for obtaining a correct distribution inside the sheet is, of course, the appropriate dividing mesh. In the proposed case, each sheet was divided into 10 layers along the thickness. The authors tried to use hexahedral equilateral elements because they ensure the best quality of the solution.

Average value of the magnitude of magnetic flux density in stator core from 100 to 200.

Average value of the magnitude of magnetic flux density in rotor core for higher harmonics up to 100.

Average value of the magnitude of magnetic flux density in rotor core from 100 to 200.
Figure 2 shows exemplary distribution of eddy currents inside of one of package sheets. It can be observed that the division into 10 layers is sufficient to reproduce a strongly uneven distribution of current in the package sheet.

Finite element mesh and location of 47th harmonic losses at rotor core tooth-tip.

Magnitude and components of magnetic flux density against time at selected rotor core tooth-tip.

Hodograph of magnetic flux density during one voltage period at selected rotor core tooth-tip.

Location of 42th harmonic losses at stator core tooth-tip.

Magnitude and components of magnetic flux density against time at selected stator core tooth-tip.

Hodograph of magnetic flux density during one voltage period at selected stator core tooth-tip.
The hysteresis simulation is based on a measured major symmetric loop that is supplied by the user. These data are imported into OPERA as standard tables describing half the loop in the first, second and third quadrants. Figure 3 show measured at 5 Hz major hysteresis loop for both materials. The hysteresis loop should generally be measured with direct current to avoid the influence of eddy currents. In our case, direct current measurement has been replaced by measurement at alternating current for a minimum frequency of 5 Hz. As stated by comparing loops at low frequencies, the influence of eddy currents is still negligible at 5 Hz.
The conductivity of sheet was taken equal to 2,9 MS/m. The winding was connected to sinusoidal voltage source like in real working. To avoid a transient, which increases the calculation time considerably, the maximum voltage value is increased linearly during the first two periods. Time step is adjusted dynamically basing on two half-step method starting from 10−5 s. Program calculates at each time step eddy current losses and energy connected with hysteresis in the hysteretic material volume. From the energy change during one voltage period, hysteresis losses can be calculated. Exemplary distribution in time of energy connected with hysteresis calculated for 50 Hz is shown in Fig. 4.
Figure 5 shows exemplary comparison of specific core losses calculated with Opera hysteresis model with measurements made at toroidal sample for magnitude of magnetic flux density equal 0.5 T in frequency range from 50 Hz to 1000 Hz. The error in the whole range does not exceed 12%. For higher frequencies due to the increasing share of eddy current losses that are more accurately represented, accuracy is increased.
A significant part of the losses of higher frequencies occurs in the stator and the rotor core tooth tips. Figure 6 shows exemplary part of the induction motor core where the phenomenon of high frequency magnetic flux penetration into laminated core (similar to [32]) is investigated. Model is excited by two coils: one is connected to a voltage source of high frequency, the second is connected to current source enabling introducing DC or sinusoidal low frequency flux component. In rotor core, high frequency component is added to DC (for synchronous speed) or low frequency (dependent on slip). Stator part is linear and non-conducting, which allows us to create a specific magnetic flux.
For core losses calculation, the authors used method described detailed in [29,30] which is based on the transient analysis snapshots to determine the harmonics of induction in mesh elements. Because the harmonics, the distribution can theoretically contain any number of harmonics (and of course the number of samples needs to be adjusted), and consequently the problem of choosing the number of harmonics arises. The problem is not trivial because additional harmonics appear due to discretization. If we maintained the assumption that losses for high frequencies, mainly eddy currents, increase with the squared frequency, this would cause that losses due to high harmonics, for which the amplitude of induction begins to set at a constant level, would grow significantly. Using lamination model, the author want to quantify the limitation of the flux penetration inside the laminated core. For solid material, we exactly known that magnetic flux has a limited access to the inside of the object. Figure 7 shows the magnetic flux distribution in laminated part at high frequency. The authors investigate motor with 350 Hz basic frequency and high order harmonics (300 harmonics – 105 kHz and 500 harmonic – 175 kHz) for two cases: (1) with only high frequency field and (2) with DC field of 1,7 T. Additionally at the top of each distribution, the ratio of calculated core losses, in shown part of the rotor tooth, according to case 105 kHz, was introduced.
The results show a significant skin effect, as we expected, but the damping of high frequency field is not so significant and core losses by the same value of exciting flux growth almost in power of 2. Saturation decreases the skin effect but it allows a deeper flux penetration and therefore losses are slightly increased. These conclusions, to be generalized, must be checked on a larger number of models. However, it looks like these results cannot be used as a tool for determining the number of harmonics in loss modelling, which does not disqualify him from being used to solve other problems.
Since a significant part of the losses is caused by the leakage flow, as evidenced by the significant increase in losses from higher harmonics at the transition from no-load to load state, subsequent simulations were performed not at the forced flux but at a constant current flow value in the excitation winding. Figure 8 shows the exemplary distribution of flux density.
Figure 9 show average flux density in top part of the sample. As can be seen from this drawing and previous drawings, although there is some damping of the field entering the rotor, it is not significant. So even with current excitation, the effect of the eddy currents on the distribution of the flux entering the rotor is small. Of course, the increase in frequency causes an increase in uneven distribution of the flux in the sheet, which is, however, weakened by the effect of saturation. Losses in the sample as a function of frequency contain (Fig. 10), as expected, a frequency-dependent member in the first power (corresponding to the hysteresis losses) and a dependent member in the square.
Next exemplary simulation for small power high frequency motor (350 Hz) have been presented. Table 1 shows the basic data for investigated motor built to work at frequencies from 10 Hz to 350 Hz, powered at 350 Hz with 230 V line voltage. Figure 11 presents BH curve and Fig. 12 specific core loss versus flux density for different frequencies for core material M270-35A.
Figure 13 shows distribution of magnitude of magnetic flux density for the selected time after reaching the steady state. The model assumes that the field does not extend beyond the core. Because it is a motor operating in a wide range of frequencies (from 10 Hz to 350 Hz) for 350 Hz it operates in the field weakening area, hence the basic induction component is about 0.3 T.
The next figures from 14 to 17 show distribution of harmonics components of core losses in stator and rotor calculated with the use of mentioned method [29,30]. If the finite element mesh is correctly selected for the motor geometry, losses for increasing frequencies (order of harmonics) decrease. For the machine under test, losses for 200 harmonics were calculated, and basically it could be reduced to 100, because the sum of losses for harmonics from 100 to 200 is below 2% of all losses. Because a wide range of motors with similar dimensional proportions has been tested [1,2,12], it can be concluded that this is a general trend. Of course, to achieve this result, the calculated higher harmonics of induction (Figs 18–21) must decrease much faster than the losses. This requires ensuring a sufficiently dense mesh of finite elements to avoid the appearance of harmonics resulting from discretization.
It should be emphasized, however, that the phenomena in the analyzed machine differ significantly from the standard ones. To this end, field distributions and trajectories (hodographs) of the induction vector are presented for the point in the rotor (for which there is a significant harmonic value of order 47) - Figs 22-- 24 and for the point in the stator (for which there is a significant value of 42 harmonics) - Fig. 25. Both points are placed on a tooth-tip.
For the rotor, induction changes resulting from the slotting effect overlap with the low-frequency (slip) fundamental harmonic field.
Appearance of magnetic flux density trajectory at presented stator core tooth-tip it results from a small (according to leakage flux) value of fundamental component of flux density due to work in field weakening regime. In the presented Figs 23, 24, 26 and 27 we can observe that the change of magnetic flux density vector in time significantly differs from the one-directional, alternating magnetization with which we have to operate in the case of the measuring sample and in other measuring devices like Epstein or SST. An approximate solution to this problem was presented in the paper [1]. More advanced solutions can be found, for example, in the book [33].
Conclusion
The paper presented solution that made possible 3D simulation of phenomena in parts of electrical machines laminated core included hysteresis and eddy currents. Theoretically, it will be possible to use that model in induction motor for transient simulations with PWM supply but computational cost and solution time will be significant. However, it can undoubtedly be used to solve partial problems and hence an accuracy increase of analytical methods so far most often used in design and optimization. A practical conclusion from the analysis of a fragment of the magnetic circuit of an induction motor (Section 3) is that eddy currents induced in the rotor lamination do not significantly suppress the high-frequency field, generated as a result of slotting, penetrating the rotor. The concentration of this field and losses caused by it in the tooth-tips results from the mechanism of their formation, as evidenced by the analyzes obtained in the second part of the work, where eddy currents and hysteresis were not taken into account.
Footnotes
Acknowledgements
The work is carried out partly (65%) within the framework of the research project POIR.04.01.04-00-0002/16 “Developing a new optimized from the point of view of power loss design high speed three phase induction motors used in industrial drives”, financed by NCBiR within the Operational Program Intelligent Development 2014-2020.