
Abstract
Magnetic nondestructive evaluation (NDE) for ferromagnetic steel using spectrum analysis of induced voltage at a pickup coil and magnetic flux density has been studied. A voltage induced at the pickup coil was measured, and the corresponding magnetic flux density was calculated. Then, their frequency spectrums were obtained through a Fourier analysis. For deformed specimen, higher harmonic components decrease as compared with undeformed specimen. The wave distortion factor for the induced voltage and the magnetic flux density were defined and evaluated. Those values decrease with increasing reduction ratio of the specimen; this means the waveforms of induced voltage and magnetic flux density for a less deformed specimen has a large distortion in those waves. Those changes reflect a nonlinearity of the magnetization curves of the specimen. The results in this study indicate a potential of magnetic NDE using spectrum analysis of measurement wave forms.
Introduction
The mechanical properties of steel depend strongly on the microstructures of the material such as dislocations and precipitates, etc. In addition, most steels contain a large amount of iron and therefore show ferromagnetic properties. Those magnetic properties are basically featured by hysteresis curves, and their magnetization process is due to domain wall motions and magnetization rotations. If dislocations or precipitates exist in the material, they interact with the domain walls and magnetization rotations. Therefore, the hysteresis curve is also highly dependent on the material microstructures [1–4]. Consequently, there is a correlation between mechanical and magnetic properties, which allows us to evaluate mechanical properties nondestructively using changes in magnetic properties [5–10]. So far, magnetic physical quantities defined on the hysteresis curve such as coercive force and initial permeability have been mainly used in magnetic nondestructive evaluation (NDE) [11–14]. However, a shape and slope of the hysteresis curve also change apparently in response to variations of material microstructures and applied stress to material. In addition, since these hysteresis curves are non-linear, the induced voltage generated at the coil based on the change of magnetic flux density in time has a distorted waveform. The IZFP (Fraunhofer Institute of Nondestructive Testing) group utilizes harmonics as parameters evaluated in 3MA (micromagnetic multi-parametric microstructure and stress analysis), developed by the research group, and successfully applied it for practical uses [15,16]. However, insightful investigation related to material microstructures and optimization of conditions for method using harmonics were seldom conducted. Thus, the investigation about excitation frequency, waveform and target signal will be effective to advance nondestructive evaluation using these differences in waveform distortion.
Experimental method
Specimen and Measurements
In this study, low carbon steel, S15C (0.16 wt.% carbon), undeformed or deformed with cold rolling were used as specimens measured. The reduction ratio (R.R.), R.R. = (d − d ′ )/d where d and d ′ are plate thickness before and after rolling, respectively, was 5, 10, 20 and 40%. The dimension of the specimens is 40 × 60 × 10 mm. The magnetic yoke having a single core made of Fe-Si steel, an excitation coil and a pickup coil, was located on the surface of a specimen, and a closed magnetic circuit was composed. A sinusoidal or triangular current was applied to the excitation coil, for magnetizing the specimen, and then the induced voltage at the pickup coil due to magnetic flux change in the closed circuit was measured. Two measurement signals were used: the voltage V B induced at the pickup coil and the magnetic flux density B obtained by integrating them in time. The excitation frequency varied from 0.05 Hz to 1 Hz.
Spectrum analysis and distortion factor
The measured signals, induced voltage V
B
and magnetic flux density B were subjected to spectrum analysis using a Fourier transform. Though the sampling frequency for detecting raw signal depends on the excitation frequency, sampling number fixed 2000 points for one cycle. For example, sampling frequency for measurement with excitation frequencies of 0.05 and 1 Hz are 100 and 2000 Hz, respectively. The Fourier transform was done by FFT based on Labview software, and frequency resolution is same as excitation frequency. From these analyzed results, the distortion factor for each waveform were calculated. Equations (1), (2) represent the distortion factor, K
fVB
, K
fB
of induced voltage V
B
and magnetic flux density B, respectively.
Raw signal
Figure 1 shows examples of the time-varying waveforms of the excitation current I, the magnetic flux density B, and the induced voltage V B at the pickup coil for the undeformed (R.R. 0%) and deformed (R. R. 40%) specimens. Here, excitation current is sinusoidal wave with 0.05 Hz. Although it is difficult to see the apparent difference in the total waveform of magnetic flux density between the undeformed and deformed specimens, a slight difference can be seen near saturation region. The undeformed specimen shows a steep down (around 5 sec.) and rise (around 15 sec.), while the deformed specimen shows a slightly slower down and rise (around 5 and 15 sec., respectively). The peak of induced voltage is clearly lower in the deformed specimen, and the shape of the waveform became broader than that of the undeformed.
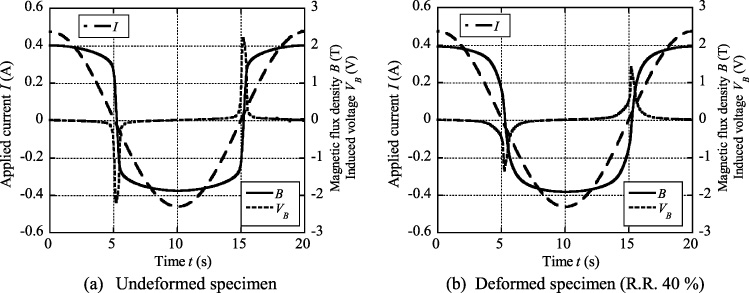
Time-varying waveform of applied current, induced voltage and magnetic flux density.
Figure 2(a), (b) show the results of spectrum analysis of the induced voltage V B and magnetic flux density B changes, respectively, by a Fourier transform based on the measurement results of time-varying parameters for undeformed and deformed specimens. The horizontal axis shows the value of each frequency divided by the fundamental frequency f1 (0.05 Hz). The harmonic component of the induced voltage is significantly reduced in the deformed specimens compared with undeformed specimen. On the other hand, there is no clear difference in the spectra of magnetic flux density between the undeformed and deformed specimens on the figure, however, we see that the amplitude decreases with increasing reduction ratio around 3-9th components (See inset).
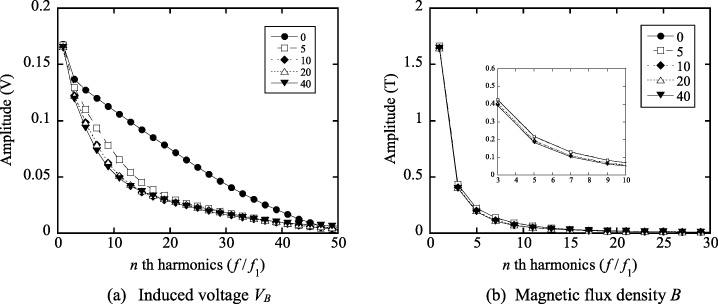
Spectrum of induced voltage V B , and magnetic flux density B.
Figure 3(a), (b) show the dependence of each harmonic on reduction ratio when the excitation frequency is 0.05 Hz, and sinusoidal wave. The fundamental component does not change against reduction ratio for both cases in induced voltage V B and magnetic flux density B. In the case of magnetic flux density B compared to induced voltage V B , the harmonic components are smaller compared to the fundamental. In both cases, the amount of change relative to the reduction ratio increases as the harmonics increase. Figure 3(c) plots the normalized each component based on the values at 0% against reduction ratio. The results are the same for the cases in induced voltage V B and magnetic flux density B, showing that the ratio in change increases as the harmonic component increases.
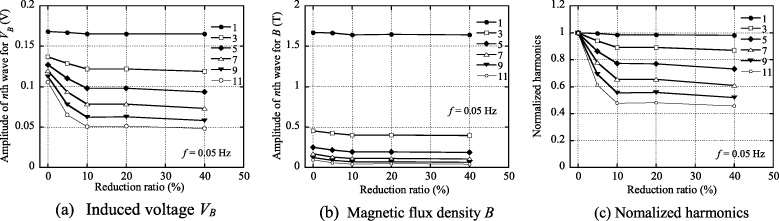
Reductin ratio dependence of each hamonic component.
Figure 4 plots the distortion factor calculated using Eqs (1), (2) based on the spectrum analysis against the reduction ratio with different excitation frequency of sinusoidal wave. At all frequencies, the distortion factors decrease with the increase of the reduction ratio. The lower the excitation frequency, the larger the distortion factors for both induced voltage V B and magnetic flux density B. The distortion factor of induced voltage V B is larger than that of magnetic flux density B. This is because the fundamental component was larger than the other harmonics in the case of magnetic flux density B as shown in Fig. 3.
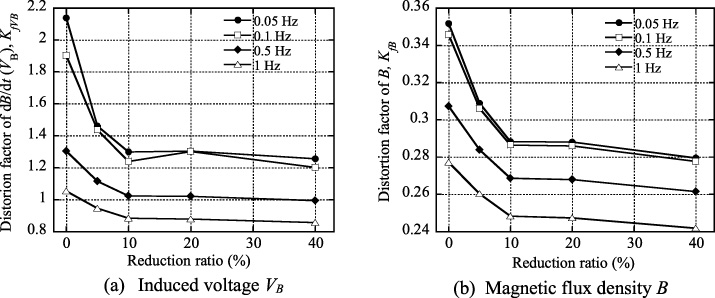
Distortion factor of induced voltage V B , and magnetic flux density B, with different excitation frequency.
Figure 5 summarizes the results of Fig. 4, normalized by the value at 0% reduction ratio. The trend of change is the same for both induced voltage V B and magnetic flux density B parameters and independent of frequency. On the other hand, the rate of change decreases with increasing frequency, a feature common to induced voltage V B and magnetic flux density B. At 0.05 Hz, the values decrease to about 0.6 for induced voltage V B and 0.8 for magnetic flux density B at a reduction ratio of 40%. The V B case shows a larger change than magnetic flux density B. The results in Fig. 1 reflect that the time waveform of induced voltage V B is more distorted than that of magnetic flux density B.
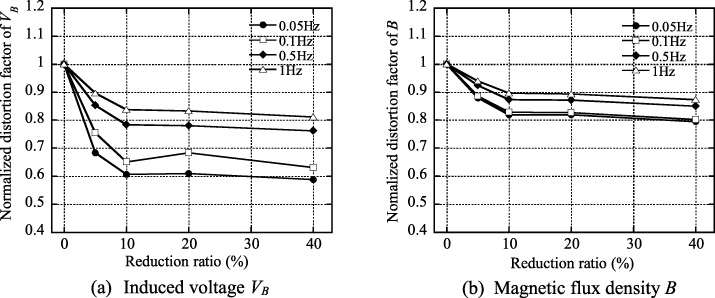
Normalized distortion factor of induced voltage V B , and magnetic flux density B.
Figure 6(a) shows the changing ratio versus reduction ratio for the coercive force, a typical evaluation parameter, and the distortion factor of harmonic components. The excitation frequency is 0.05 Hz and is shown for sinusoidal and triangular excitation, respectively. The changing ratio is determined by the percentage change from the value at a reduction ratio of 0% (undeformed). Regarding the difference in excitation waveforms, the changing ratio in both coercive force and distortion factor with triangular wave excitation is larger than the cases in sinusoidal wave excitation. For the same excitation waveform, a larger changing ratio is obtained with distortion factor. In both cases, the parameters agree in increasing with respect to the reduction ratio, however they differ in the trend of the change. The distortion factor increases rapidly up to 10%, then the increment becomes mild, while the coercive force increases constantly.
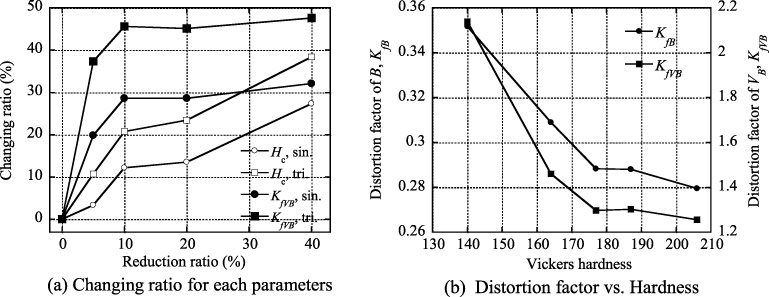
Comparion with conventional parameter and relationship between distortion factor and hardness.
A detailed report on the microstructure changes of the low carbon steel when cold rolled, can be found elsewhere [17,18]. Based on the results, dislocations increase homogeneously at first, i.e., dislocation density increases, then make tangles, and finally build up cell structures as reduction ratio increases. The dislocations act as pinning sites for domain wall motions, and the coercive force is interpreted to be more reflective of the strength of the interaction between the pinning sites and the domain wall motions. On the other hand, a strain field is generated around the dislocation, which inhibits magnetization rotation. A larger magnetic field is required to rotate and align the magnetization parallel to the applied magnetic field direction with overcoming this inhibition, which makes the slope of magnetization curve larger. The distortion factor is expected to reflect mainly the tilting of the magnetization curve, the effect of strain field on magnetization process. As described above, the difference between the change in both parameters may be due to differences underlying physical phenomena. The difference in excitation waveforms is thought to be related to electromagnetic phenomena such as eddy current loss, and this is addressed as further study.
Figure 6(b) shows the distortion factor of induced voltage V B and magnetic flux density B plotted against Vickers hardness, one of the mechanical parameters. The distortion factors had good correlation with hardness, which can be used for nondestructive evaluation of mechanical parameters.
Conclusion
The voltage induced at the pickup coil and magnetic flux density were measured, and their spectrum were analyzed. There was a significant difference in the spectral waveform between the undeformed and deformed specimens and distortion factors were calculated to characterize them. The distortion factors decreased as the reduction ratio increased, which means that the wave distortion for undeformed specimen is larger than that of deformed specimen. The factors also have good correlation with hardness, which allows us to evaluate hardness nondestructively using the voltage induced at the pickup coil and magnetic flux density.